
ABSTRACT
A detailed assessment of a pasture’s functioning based on soil properties characterization, floristic composition, and ‘functional summary’ by evaluating competitor–stress tolerator–ruderal (CSR) strategies is provided for a doline in Central Italian Alps. A floristic survey was carried out at 35 sampling points, representative of the main topographic features, soil and vegetation types; the functional profile at the community level was evaluated by assessing for each species its Grime’s CSR strategy; each point was characterized through soil profiles and topsoil (0–10 cm) sampling; pH, soil organic carbon and total nitrogen, available P, soil humus fraction, root density, bulk density, water content, and available water capacity were determined. Our study showed i) a strong relationship between vegetation, soil properties, topography, and grazing; ii) a prevalence of stress-tolerant strategies; iii) the ability of plant strategy variation to reflect the ecological parameters; and iv) the vegetation potentiality to be an indicator of environmental spatial variability.
Introduction
Natural alpine environments are often characterized by great spatial variability in their geomorphological, geological, pedological, and vegetation properties. This variability sometimes occurs at short spatial scales (Aalto et al. Citation2013) and is strongly conditioned by highly dynamic geomorphic processes.
In alpine ecosystems, soil–plant relationships involve a wide range of essential environmental issues by affecting ecosystem biodiversity, soil potentiality as a carbon sink, and biogeochemical processes, while also representing a valid indicator of the global warming response (Qin et al. Citation2007; Grand et al. Citation2016).
The relationships between soil and vegetation in alpine environments have long been studied (Isard Citation1986; Rose et al. Citation1988; Gensac Citation1990; Darmody et al. Citation2004; Lane et al. Citation2016). Some studies showed the importance of edaphic factors by investigating physical parameters (texture, soil thickness, surface characteristics; Rubio and Escudero Citation2000), chemical parameters (pH, but also soil fertility, in particular N and P; Anic et al. Citation2010; Ahmad et al. Citation2016), or water availability (Kammer et al. Citation2013). Other factors, such as climate (Zelnik and Čarni Citation2013), bedrock (Toure et al. Citation2015), and topographic aspects (absolute and relative altitude, slope, etc.; Zhang and HuGang Citation2013), have been investigated to explain vegetation variability and characteristics. Plant cover variability is also affected by management (chemical or organic fertilization, livestock use and grazing intensity (Marini et al. Citation2008; Teuber et al. Citation2013). In some cases it has been shown that the soil–vegetation relationship may be expressed in a synthetic way simply using the pedological taxonomy (Gensac Citation1990; Caria et al. Citation2015; Grand et al. Citation2016).
Ecosystem properties are reflected by variation in the adaptive traits of plant species, which may reflect the main ecological gradients shaping plant phenotypes (Diaz et al. Citation2016). For this reason, plant communities may be effectively described through their functional profile, allowing the comparison of ecosystems within a coherent framework. A successful scheme for the assessment of the functional strategies of plant species is Grime’s Competitor–Stress tolerator–Ruderal (CSR) scheme (Grime Citation1977, reviewed by Grime and Pierce (Citation2012). CSR theory predicts that the strategies of plant species are an adaptive response to a three-way trade-off in the investment of resources between the ability to compete with neighbors (competitive strategy, C), tolerate stress (stress-tolerant strategy, S), or survive disturbance (ruderal strategy, R). The morpho-functional traits of each species can be used to assess its life strategy in the form of coordinates on the C, S, and R axes (Pierce et al. Citation2017). This theory provides a functional interpretation of plant communities in different ecological conditions and has been successfully used in alpine grasslands and pastures (Caccianiga et al. Citation2006; Pierce et al. Citation2007; Li and Shipley Citation2017). The use of community-weighted mean (CWM) trait values (i.e. values weighted by species abundance at the plot level) allows the application of such an approach at the community level (Garnier et al. Citation2004; Dubuis et al. Citation2013) following the mass ratio hypothesis (Grime Citation1998), which suggests that the traits of the most abundant species have a proportionally higher role in ecosystem functioning. However, except for Moog et al. (Citation2005) on semi-natural grasslands in Germany or Bahr et al. (Citation2012) and Ejrnaes and Bruun (Citation2000) on dry prairies in Denmark, the CSR approach has usually been used without considering soil characteristics; in general, studies have rarely considered the interactions of all the mentioned factors and their relative importance in shaping vegetation patterns.
The objective of this study was to provide a detailed assessment of ecosystem functioning based on quantitative and analytical measurements of soil chemical and physical parameters, biomass and productive measurements, floristic composition, and a ‘functional summary’ (Pierce et al. Citation2017) provided by an assessment of the CSR strategies; such an assessment was performed for an alpine pasture characterized by high soil and vegetation variability at a detailed scale to provide further insights into the capability of plant strategy variation to reflect the underlying ecological parameters and into the role of biodiversity in perspective of environmental changes.
Materials and methods
Study site
The study site () is a 1.5 ha doline in Valchiavenna (Central Italian Alps, Lombardy; 46° 27′ 22″ N, 9° 21′ 05″ E), between 1920 and 1950 m in altitude, used as a cattle pasture under-loaded and grazed mainly by dairy cows, heifers, and calves.
Figure 1. Study area: (a) geographic position of the study area; (b) the doline; (c) the earth hummock vegetation; (d) locations of the sampling points.
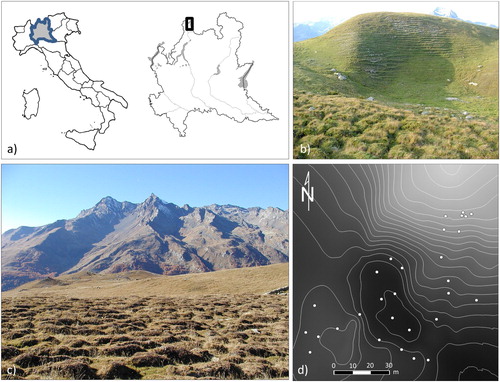
The mean annual air temperature, measured by three meteorological stations located inside or very near the study area and characterized by different exposure types (north, plain, and south), is 3.1 °C; the mean annual precipitation is about 1300 mm (45%–50% as snow). During the vegetative period (June–September), the mean air temperature is 10.3 °C, the mean precipitation is about 600 mm, and the mean solar radiation is 19.3 MJ m−2 d−1.
The doline shows strong topographic variability (maximum height difference of 30 m): in the northern part there is a rounded summit, the south-facing steep slope is subjected to water and wind erosion, while the flat bottom is sometimes subjected to water stagnation. Close to the doline at the west and east, respectively, there are a rolling plain surface covered by earth hummocks and a low-marked impluvium zone.
The study site has a carbonate (marble, crystalline limestone) substrate and a discontinuous felsic (mainly schist) glacial cover. Due to the different thicknesses of glacial deposits and because of slightly developed periglacial phenomena (earth hummocks, nivation, gelifluction, ploughing blocks) in the absence of permafrost, the soil characteristics are very variable and the pattern of vegetation is intricate.
The main soil types (IUSS Working Group WRB Citation2015) are Leptosols and Cambisols, to a smaller extent Umbrisols, and more rarely Podzols (Comolli et al. Citation2011).
The study area was characterized from the pedological, vegetation, and topographic points of view. Thirty-five sampling points were selected as representative of the main soil and vegetation types and of the main topographic features ().
Vegetation sampling
A floristic survey was carried out at each sampling point to detect the occurrence and abundance of plant species and to outline the main plant communities. Vegetation sampling was performed during the growing season (20th July) through point-quadrat analysis. Thirty-five plots, each consisting of a 0.5 × 0.5 m quadrat with a 10 cm grid, were considered. At each node of the grid, the plant species touching the grid and the vertical line passing through the node were identified, and the number of contacts, which is a good indicator of relative abundance, was recorded. The overall number of contacts can also be considered a proxy for the biomass of the whole community (Redjadj et al. Citation2012).
After the floristic survey, at each sampling point, a soil core sample was taken down to 10 cm (core diameter 10 cm; sampled volume 785 cm3) for determination of the root biomass. Extraction of roots from the cores was carried out by presoaking the sampled soil overnight in a solution of EDTA (40 g L−1) to facilitate washing. After that, roots were washed, picked out, separated into three diameter classes (<2 mm; 2–5 mm; >5 mm), and oven dried at 80°C for 24 h to determine the following dry masses of the root biomass, expressed as g dm−3: total (totRoots), <2 mm diameter (very fine, vfRoots), 2–5 mm diameter (fine, fRoots). There were no roots with diameter >5 mm. At 15 sampling point, roots were also sampled in the deeper layers (10–20 cm and 20–30 cm layers).
Twelve-year aboveground biomass data of the main types of the doline’s vegetation are available; they were collected by mowing the grass at about 3 cm height within exclusion cages of 2 × 1 m. The mowing was performed at maximum vegetative development (between 15th and 30th July) and was repeated on the regrowth at the end of the season (September).
The functional profile of each vegetation type was evaluated by assessing for each species its Grime’s CSR strategy through the approach proposed by Pierce et al. (Citation2017). Such an approach allows the assessment of the competitive, stress-tolerant, and ruderal components of a species’ strategy, expressed as a percentage, using a few leaf traits: the leaf area (LA), leaf dry matter content (LDMC), and specific leaf area (SLA). These parameters were calculated from the values of leaf fresh weight, leaf dry weight, and leaf area data obtained by previous studies (Caccianiga et al. Citation2006; Pierce et al. Citation2007; Pierce et al. Citation2017), an available comprehensive dataset (Cerabolini et al. Citation2010), and other data (Caccianiga and Cerabolini, unpublished).
For each sampling point, the CWM of the CSR average scores was calculated by weighting by the overall frequency of the observed species.
Soil sampling and laboratory analyses
Immediately after the vegetation sampling, besides the soil core sample for the determination of root biomass, another sample was collected down to 10 cm (core diameter 10 cm; sampled volume 785 cm3) for soil organic carbon (SOC) content and bulk density (BD) determination, and other soil analyses. Sometimes (11 cases for roots and 3 cases for SOC) the sample depth was shallower than 10 cm due to the presence of the fractured rock substrate near the soil surface.
On the collected soil samples, the following parameters were determined: pH in water (pHw; soil-to-solution ratio 1:2.5); SOC and total nitrogen (totN) by dry combustion with a Flash EA 1112 NC-Soil elemental analyzer (Thermo Fisher Scientific CN, Pittsburgh, USA) after removal of carbonates, if present, by hot HCl treatment; soil texture (four fractions) by sieving and sedimentation after dispersion with sodium hexametaphosphate; and available P (avP) according to Bray and Kurtz (Citation1945).
For BD determination, soil cores were oven dried at 105°C for 24 h and weighed; in the case of soils containing rock fragments (>2 mm diameter), the soil volume and mass were proportionally reduced to obtain the fine earth BD. The SOC content was also calculated on an area basis (Cstock, kg m−2, 0–10 cm depth) considering the soil BD and rock fragment volume.
The soil particle density (PD) was estimated according to PD (g cm−3) = 2.65 − 0.02SOM (%), where SOM (soil organic matter) was calculated as SOC (%) × 1.724. The total soil porosity (totPor) was calculated from PD and BD.
Soil humus fractions were determined according to Anderson and Schoenau (Citation2008) to obtain the carbon and nitrogen contents of fulvic acids (CFA, NFA), humic acids (CHA, NHA), and humin (CHUM, NHUM).
Throughout the vegetative season, the soil temperature at 5 cm depth and soil water content at 0–8 cm depth were measured every two weeks at each sampling plot, and the measurements were then averaged. The soil water content was measured using a portable TDR system (IMKO Micromodultechnik, GmbH, Ettlingen, Germany) and then converted (using the measured BD) to the water-filled pore space (WFPS).
The morphologic and topographic features of the doline were obtained from a digital terrain map (DTM) with a 2 m resolution.
The mean solar radiation for the vegetation period (June–September) was calculated for each sampling point in ArcGIS Desktop (ESRI 2011, Release 10) using the DTM.
After the topsoil sampling, a soil profile was opened at each of the 35 sampling points until a depth of about 100 cm or until the rock substrate. The soil was described and sampled by horizons (FAO Citation2006). Laboratory analyses were carried out on all the collected samples using the methods indicated above and, for Fe and Al fractionation only, using the official Italian methods (MiPAF Citation2000); soils were then classified using the WRB taxonomic system (IUSS Working Group WRB Citation2015). Based on the characteristics of the soil, taking into account the horizons A and B (thus excluding C and R), the available water content (AWC) was calculated for each sampled point; the empirical equations of Ghanbarian-Alavijeh and Millàn (Citation2010) were used, considering the measured BD for the 0–10 cm layer and an estimated BD value for the underlying layer (Hallet et al. Citation1998). The intensity of water erosion was qualitatively evaluated on the basis of the bare soil percentage by direct observation and using remote sensing images.
The list of all investigated parameters and their abbreviations are shown in .
Table 1. Investigated soil properties, environmental variables, vegetation, and their abbreviations.
Statistical analyses
A clustering procedure was used to identify the main vegetation types using the Chord distance and Unweighted Pair-Group Method using arithmetic Averages (UPGMA) as a clustering method. In order to test the relationships between soil properties and vegetation types, the linear mixed model (LMM) procedure was performed (Bolker et al. Citation2009) to test for autocorrelation among the model residuals (Searle et al. Citation2009). If linear model assumptions on the residuals distribution were not satisfied, a Gaussian anamorphosis transformation (using ISATIS release 13.01 of software package; Geovariances Citation2013) of the response variable was performed. To compare the –2 log likelihood fitting criteria of different models (spatial, nonspatial), a likelihood ratio test was performed.
Statistical analyses were performed using PROC MIXED (Littell et al. Citation2006) of SAS (release 9.4, SAS Institute). The spatial covariance function of residuals was iteratively determined using the statement REPEATED by estimating the partial sill, range, and nugget effect parameters (Littell et al. Citation2006). The statistical difference between means was assessed through contrast analysis using the instruction LSMEANS.
The relationships between soil properties, environmental variables, and plant species were investigated using canonical correlation analyses (CCA; CANOCO version 4.5). Only the most abundant plant species (i.e. those with the highest number of recorded contacts) were included in the CCA. We selected the five most abundant species for each of the five vegetation types; as some species dominated in more than one vegetation type, a total of 14 species was included in the analysis.
The Monte Carlo permutation test was performed in order to assess both the significance of the environmental variables and the ordination axes. To reduce the data set complexity and noise in the variance components, one from each pair of highly correlated variables was removed from the analysis (Perez-Riverol et al. Citation2017).
The CSR life strategy was also interpreted by principal component analysis (PCA; CANOCO version 4.5) mapping C, S, and R coordinates, soil and environmental variables, and vegetation types into the same space to investigate their correlations.
Results
Vegetation
The main vegetation types identified by cluster analysis were: 1. communities dominated by bentgrass (Agrostis schraderiana) (B); 2. Nardus stricta pastures (N); 3. rich pasture dominated by tall grasses and forbs (Phleum pratense, Poa alpina, Alchemilla vulgaris, Deschampsia caespitosa) (RP); 4. Sesleria varia grasslands (SV); and 5. earth hummocks (EH) (Table S1).
The number of contacts was the highest for RP, followed by EH, B, N and SV; the average number of species was higher for SV and N than for the other vegetation types ((a and b)).
Figure 2. Vegetation types of the investigated doline: (a) number of contacts; (b) number of species; and (c) aboveground biomass (2006–2018). SV: Sesleria varia grassland; RP: rich pasture; N: Nardus stricta pasture; EH: earth hummocks; B: bentgrass.
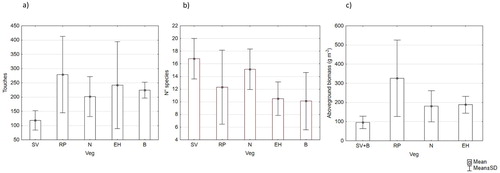
The annual aboveground biomass production measured for the main vegetation types showed great differences ((c)): RP vegetation produced more than the others; N pasture and earth hummocks gave intermediate biomass; while B and SV (considered together) were characterized by lower production. The average water content of the biomass was instead similar between the vegetation types (64%–68%; data not shown). The totRoots biomass (about 80% represented by vfRoots) averaged to 4.9 g dm−3, with a minimum of 1.8 and a maximum of 13.2 g dm−3. Most of the roots, except for those from earth hummocks, which have a more homogeneous distribution with depth, were amassed in the first 10 cm (), with no statistical differences among vegetation types.
Table 2. Total root density (g dm−3) for each vegetation type in the three investigated layers.
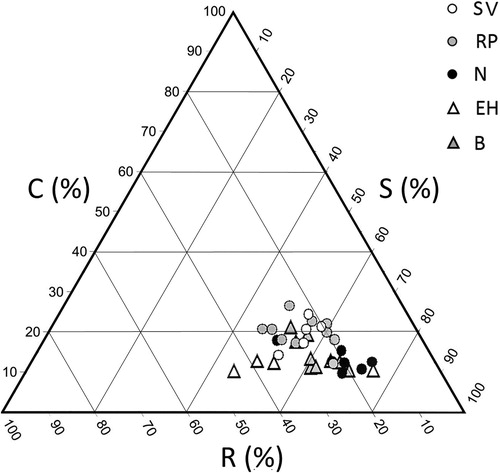
The distribution of Grime's life strategies showed small variations among the investigated communities (), within which the species mainly exhibited a stress-tolerant attitude (Table S1): the bentgrass community was mainly composed of different stress tolerators, with Agrostis schraderiana dominant; in Sesleria varia grasslands, species mainly showed stress-tolerant (S) (Sesleria varia, Carex caryophyllea, Poa alpina, Helianthemum oleandicum) and stress-tolerant–ruderal (SR) (Hippocrepis comosa) strategies; earth hummocks were characterized by few species, mainly stress tolerators (Nardus stricta, Agrostis schraderiana, Vaccinium uliginosum) and SR (Trifolium alpinum, Avenella flexuosa); Nardus stricta pastures included species showing S strategy, with Nardus stricta dominant and Festuca nigrescens and Agrostis schraderiana much less frequent. Rich pastures were marked by a wider range of strategies, with dominance of the S species (Agrostis schraderiana, Poa alpina, Festuca nigrescens, Deschampsia caespitosa) and the presence of other species which mainly exhibited relatively generalist strategies, such as Alchemilla vulgaris and Trifolium pratense, with stress-tolerant–competitive (SC) and R attitudes, respectively.
Figure 3. Functional profiling through Grime’s CSR model (R: ruderal strategy; C: competitive strategy; S: stress-tolerant strategy) for each sampling point of the investigated vegetation types (SV: Sesleria varia grassland; RP: rich pasture; N: Nardus stricta pasture; EH: earth hummocks; B: bentgrass).
Soil
The representative soil types which characterized the investigated doline are shown in . They were mainly Leptosols and Cambisols, all rich in SOC content in the topsoil. Leptosols, shallow and lowly developed soils, were mainly located along steeper slopes with southern exposure and limited by carbonate bedrock, which influenced their base saturation and reaction (Rendzic Leptosols; 10–15 cm thick; base saturation (BS) > 50%; pH > 6.0). Where slopes were still steep but marbles were slightly deeper, we found a few thin soils with thick (25–35 cm) surface horizon, low BS, and high SOC (Leptic Umbrisols).
Table 3. Main properties of representative soil profiles (taxonomy according to IUSS Working Group WRB, Citation2015).
The most widespread soil type at the study site was Cambisol, slight to moderately developed soil, which mainly differed in thickness and saturation status. In flat and moist areas of the lower part of the doline, these soils were thick (until 100 cm deep) and with high base saturation (Eutric Cambisols), while along the slight slopes and in the high plain part, not as wet as the bottom of the sinkhole, we mainly found thinner soils, desaturated in bases (Dystric Cambisols) and rich in rock fragments. In areas with thick glacial cover rich in highly weathered schist, Cambisols passed gradually towards Podzols, with evidence of cryoturbation caused in the past by frost action; these soils, classified as Dystric Cambisols (Protospodic) – Entic Podzols, were deep, very acid, with strong silt content and few rock fragments, more compacted, and with less organic matter than the other soils.
When considering only the first layer (0–10 cm depth, but slightly less for three points), the SOC and Ntot contents were high and very variable, ranging between 2.2% and 13.6% and 0.2% and 1.2%, respectively (); the average C/N ratio (±SE) was 10.9 ± 0.2. The average avP content was 23.6 ± 2.9 mg kg−1; the surface soil texture was mainly sandy loam; and the pHw varied over a wide range, from very acid (4.3) to neutral (7.1) values.
Table 4. Main statistics of soil properties in the 0–10 cm layer. For abbreviations and units of variables, see .
The average soil temperature (at 5 cm depth) during the grazing season was 16.1 °C, ranging between 12.7 and 19.3 °C; the WFPS (mean ± SE) was 42.6% ± 1.58%, varying between 24.3% and 59.9%.
Soil–plant interactions
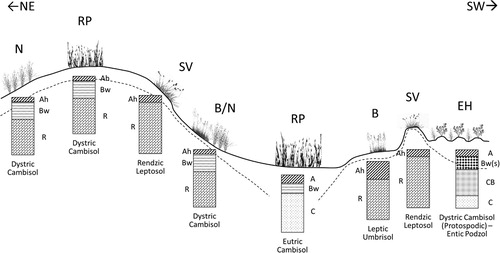
At the top of the slope, where soil was poorly developed, thin, and limited by highly fractured bedrock, the typical vegetation was Sesleria varia grassland (). The south-facing slope was moderate to high in terms of gradient (25%–51%) and soil erosion was often strong (activated by cattle grazing, but mainly due to runoff and snow and wind erosion); here, the distribution pattern of Sesleria varia and Agrostis schraderiana communities was very intricate, with patches often less than 1-meter-wide, making their separation difficult. However, soils under Sesleria varia grassland (Rendzic Leptosols) usually differed from those under bentgrass (Leptic Umbrisols) showing a neutral instead of acidic reaction and higher total porosity due to their low bulk density. In flat or gently sloped areas, particularly at the concave bottom of the doline, the prevailing vegetation was rich pasture, and soils were mainly deep Eutric Cambisols with intense biological activity by earthworms in the topsoil. Along water flow zones and near flat areas, Nardus stricta pastures spread over moderately deep and sometimes thin Dystric Cambisols, with low pH and common rock fragment content. In areas with weathered shale substrate, where soils were very acidic and deep, there was a significant presence of earth hummocks, with a pattern of small reliefs and depressions (about 40 cm difference between the top and bottom of the hummocks); the depressed areas were strongly compacted by cattle transit, resulting in water stagnation following prolonged rainy events.
Figure 4. Schematic representation of soil–plant relationships along a topographic transect in the investigated doline. The dotted line approximately represents the depth of the substrate. B: bentgrass; RP: rich pasture; SV: Sesleria varia grassland; EH: earth hummocks; N: Nardus stricta pasture.
Concerning surface soil characteristics, SV and EH greatly differed from the other vegetation types ( and Table S2). The Sesleria varia community significantly (p < 0.05) differed in terms of pH (the highest values), BD, and clay content (the lowest values) from the other vegetation groups; it exhibited, in common with EH, lower avP than the other vegetation types. EH was instead characterized by significantly (p < 0.05) higher BD, CN, and silt and lower SOCstock, CHA, and CFA than the other communities. The vegetation types N, RP, and B mainly had similar values for most of the investigated parameters, with intermediate values for CN, BD, pH, and textural fractions and highers value of SOCstock, CHA, and CFA than EH and SV. Concerning the soil water content, the SV and B vegetation types were significantly drier than N and RP, while EH showed intermediate WFPS values.
Figure 5. Box plots for the comparison of soil properties among vegetation types (B: bentgrass; RP: rich pasture; SV: Sesleria varia grassland; EH: earth hummocks; N: Nardus stricta pasture). Different letters indicate statistically significant differences (p < 0.05) in the response variable among vegetation types in the mixed model. For abbreviations of variables, see .
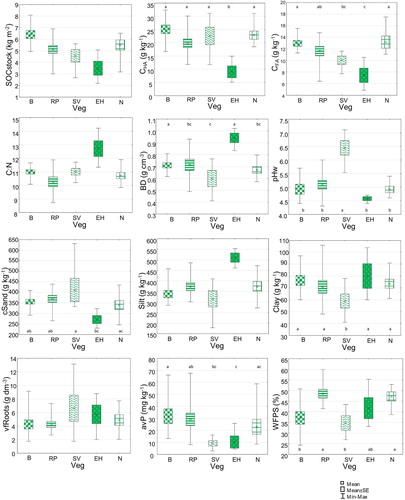
The parameter with the highest discriminating power was SOCstock. B, RP, and EH significantly differed from each other, with the highest values for B and the lowest values for EH; RP showed intermediate values, similar to SV and N.
The CCA resulted in high eigenvalues and cumulative percentage variances of the species–environment data, which were indicative of distinctive species assemblages across the different vegetation types ( and ); the cumulative constrained variability explained by the first two axes was 60.7%. The species–environmental parameter correlations were 0.965 for axis 1 and 0.880 for axis 2. The main identified ecological gradient was that of soil pH, temperature, and erosion risk, marked by base-requiring species such as Sesleria varia, Helianthemum oleandicum, Hippocrepis comosa, and Carex caryophyllea. Axis 2 identified a second gradient coinciding with higher C/N ratio, BD, and silt content and lower Cstock with dominant Vaccinium myrtillus and Avenella flexuosa; to a lesser extent, Trifolium alpinum; Phleum alpinum, and P. pratense seem to be linked to soils characterized by higher water content and avP.
Figure 6. CCA analysis of plant species in relation to the considered soil and environmental variables. Significant variables (at p < 0.05) are reported within rectangles. Species abbreviations: Agrostis schraderiana: Agr_schr; Alchemilla vulgaris: Alch_vul; Carex caryophyllaea: Car_car; Festuca nigrescens: Fest_nig; Heliantemum oleandicum: Hel_olea; Hippocrepis comosa: Hipp_com; Nardus stricta: Nard_str; Phleum alpinum: Phl_alp; Phleum pratense: Phl_prat; Poa alpina: Poa_alp; Sesleria varia: Sesl_var; Trifolium alpinum: Trif_alp; Vaccinum uliginosum: Vacc_uli. For abbreviations of variables, see .
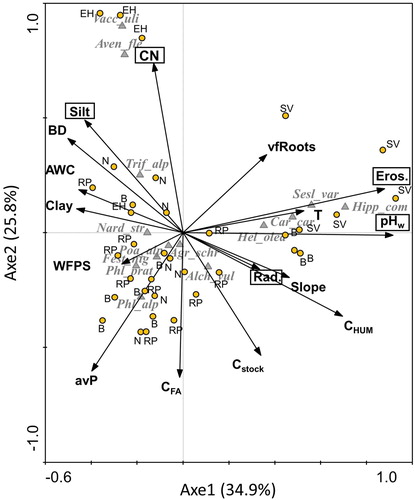
Table 5. Canonical correlation analysis (CCA) for the 14 most abundant plant species in relation to the considered environmental variables (soil properties of the 0–10 cm layer).
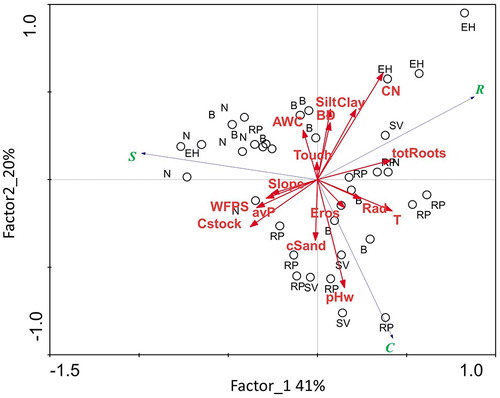
We conducted PCA to compare the CSR strategies with respect to soil and environmental properties. The first two factors explained 61% of the total variance: Factor 1 accounted for 41% and Factor 2 for 20%. A distinction between conditions favoring ruderal, competitive, and stress-tolerant components could be observed (). The ruderal component was associated to conditions favoring slow organic matter mineralization (high C/N) such as those in the earth hummock areas, while competitiveness was positively correlated with pHw. The stress-tolerant component was weakly correlated with WFPS and avP characterizing the resting areas. A clear main gradient of soil variables with respect to CSR strategies could not be observed; the investigated plant communities share an overall common stress-tolerant profile linked to regional environmental conditions, while, at small scale, specific local factors act as different stress sources (see discussion).
Figure 7. PCA analysis. Plot of CSR components, considered soil and environmental variables, and vegetation types. For abbreviations of variables, see .
Discussion
We selected an alpine pasture that exhibited a wide range of plant communities and soil conditions. This study showed evidence of strong relationships between vegetation (floristic composition, vegetation types, and life strategies) and soil chemical (pHw, avP, SOC, CN) and physical (BD, AWC, texture) properties, climatic and pedoclimatic parameters (T, WFPS, Rad, AWC), topography (slope, erosion), and livestock grazing.
It has long since been demonstrated that mutual soil–plant relationships produce spatial patterning in soil properties and that individual plant performance and plant communities may respond to soil variability (Rubio and Escudero Citation2000; Casa and Castrignanò Citation2008; Ferré et al. Citation2014). In mountain areas, such variability is exacerbated by heterogeneity in the geomorphology and lithology of the soil parent material. In accordance with this, changes along the topographic gradient from dry calcareous to damp acidic soils, reflecting variations in soil fertility and conditions of stress and disturbance, were observed.
The investigated doline mainly exhibited stress-tolerant strategies, although the kinds of stress were different. The overall, background S strategy of the investigated communities is probably linked to the climatic features of the investigated area, a temperature-limited high-altitude site with short growing season. At local scale, soil, topographic and grazing variables act as specific stress and/or disturbance factors, providing the specific features of each plant community (Pierce et al. Citation2007). In the upper part of the south-facing slope, on shallow soils, stress related to sub-alkaline reactions and dry conditions favored the presence of Sesleria varia, Carex caryophyllea, Poa alpina, and Helianthemum oleandicum. Biomass production was restricted, but biodiversity was high, in accordance with the ‘unimodal diversity–productivity relationship’ or ‘humped-back model’ which implies that the highest levels of biodiversity occur at intermediate levels of productivity rather than at the highest ones (Grime Citation2006; Adler et al. Citation2011). Where disturbances caused by erosion and cattle transit were higher, species with the stress-tolerant–ruderal (SR) strategy appeared. Grazing is known to have the potential to modify ecosystems and change their structure and function (Hobbs et al. Citation1996) – in this case, by promoting erosion through mechanical disturbance of the soil surface (Pietola et al. Citation2005).
With decreasing slope, in particular along the water flow areas, another stress-tolerant species, Nardus stricta, prevailed; this species is often dominant under acidic and nutrient-poor conditions (Landolt et al. Citation2010) and, thus, in communities characterized by low productivity, forage quality, and palatability. Bentgrass communities occurred nearby on convex slopes and, thus, under intermediate topographic conditions between Nardus stricta communities and those linked to steeper slopes. These communities share the overall ecological profile of Nardus-dominated pastures, with a slight displacement towards the C and R corners of the CSR triangle. For both communities, the dominant S strategy is an expected consequence of low productivity, the main driver of stress tolerance syndrome (Grime Citation2006).
In the flat zones at the bottom of the doline, where soils were deep, rich in nutrients, and damp, species with stress-tolerant (S), stress-tolerant–competitive (SC), and stress-tolerant–ruderal (SR) attitudes grew. Rich pastures were characterized by high biomass and a low number of species with high nutrient acquisition, high photosynthetic efficiency, and fast growth (Grime Citation2001); such species usually form tall and uniform stands with plastic biomass allocation to leaves and roots to maximize nutrient acquisition. Here, livestock rest, which increases the nutrient turnover rates and selective grazing, trampling, and soil compaction (Manier and Hobbs Citation2007; Jones et al. Citation2010). Patchy concentrations of nutrients, together with local stress factors such as temporary water stagnation, provide contrasting microsites for a range of life strategies; thus, dominant species include both S strategists, such as Festuca nigrescens, and species with a relatively high C component, like Phleum pratense. However, it should be considered that in spite of being the most productive and exhibiting the highest C component, these communities share the overall S strategy of the whole ensemble of investigated plant communities.
Despite the high aboveground productivity, the root biomass in the investigated surface layers of the rich pastures was not different from that of the other vegetation types. Cambisols of the stable areas were deep, but most of the roots were in the surface layer, and only a small part was deeper (10–30 cm); this is in accordance with what was found for tundra (an environment comparable with ours), which was characterized by 80%–90% of the root mass occurring in the upper 0.3 m of the profile (Jackson et al. Citation1996). The lower root/shoot ratio in this community is probably linked to its higher nutrient status with respect to the other investigated communities, as this ratio is expected to increase under low nutrient availability because of greater allocation of nutrients to root growth and increased root longevity (Chapin Citation1980).
The earth hummocks represented a separate case; this vegetation type developed above acidic soils in the level or near-level areas with low drainage and characterized by an alternation of raised and depressed areas due both to periglacial phenomena and livestock trampling, to which corresponded an alternation of stress-tolerant–ruderal and stress-tolerant strategies. The raised areas were characterized by shrub species of the subalpine heathlands (Vaccinium uliginosum), Trifolium alpinum, and high cover of Avenella flexuosa, to which the ruderal component is mainly due. The depressed areas, more compacted due to livestock transit and, thus, often damp after rainy events, showed flora which was instead comparable to that of a typical Nardus stricta grassland, with species tolerant to trampling and to high water availability, such as Agrostis schraderiana.
Conclusions
Overall, this study demonstrated the high spatial heterogeneity of soil properties and vegetation related to high variability in the topography, soil parent material, and pedoclimate. Moreover, vegetation pattern proved to be a valid indicator of environmental spatial variability resulting from all the factors working together; considering its spatial heterogeneity, and making use of its explanatory power for soil and morphology changes, it could be used to evaluate most of the biogeochemical processes related to the soil–vegetation complex. The use of CWM values effectively summarizes the overall ecosystem properties, even if they do not necessarily reflect the unique possible optimal strategies of the respective communities (Muscarella and Uriarte Citation2016), and a wide spectrum of strategies may occur in each plot, enhanced by the high small-scale variability of environmental parameters.
Our results highlight the importance of the use of complementary approaches to vegetation study, from quantitative data of the above- and belowground biomass to qualitative information provided by detailed floristic survey and functional approaches that may help to shed light on the processes underpinning community arrangement and functioning.
Supplemental Material
Download MS Word (24.9 KB)Acknowledgements
We received substantial help from Mr. Donnino Della Bella, president of the Alpe Andossi Consortium. We thank F. Vaninetti, A. Castrignanò, A. Farina, F. Pagani, G. Curioni for their help with field and laboratory work.
Disclosure statement
No potential conflict of interest was reported by the author(s).
Data availability
The datasets generated and analyzed during the current study are available in the Pangaea repository: Ferré, Chiara; Comolli, Roberto (2019): Soil and plant data of a pasture of the Italian Alps (Andossi, SO). PANGAEA, https://doi.org/10.1594/PANGAEA.910055.
Related Research Data
References
- Aalto J, Le Roux PC, Luoto M. 2013. Vegetation mediates soil temperature and moisture in Arctic-alpine environments. Arct Antarct Alp Res. 45:429–439. doi:10.1657/1938-4246-45.4.429.
- Adler PB, Seabloom EW, Borer ET, Hillebrand H, Hautier Y, Hector A, Harpole WS, OâHalloran LR, Grace JB, Anderson TM, et al. 2011. productivity is a poor predictor of plant species richness. Science. 333:1750–1753. doi: 10.1126/science.1204498
- Ahmad KS, Hameed M, Ahmad F, Sadia B. 2016. Edaphic factors as major determinants of plant distribution of temperate himalayan grasses. Pak J Bot. 48:567–573.
- Anderson DW, Schoenau JJ. 2008. Soil humus fractions. In: Carter MR, Gregorich EG, editors. Soil sampling and methods of analysis. Boca Raton, FL, USA: CRC Press; p. 675–680.
- Anic V, Hinojosa LF, Díaz-Forester J, Bustamante E, de La Fuente LM, Casale JF, de La Harpe JP, Montenegro G, Ginocchio R. 2010. Influence of soil chemical variables and altitude on the distribution of high-alpine plants: the case of the andes of central chile. Arct Antarct Alp Res. 42:152–163. doi:10.1657/1938-4246-42.2.152.
- Bahr A, Ellström M, Schnoor TK, Påhlsson L, Olsson PA. 2012. Long-term changes in vegetation and soil chemistry in a calcareous and sandy semi-natural grassland. Flora - Morphology, Distribution, Functional Ecol Plants. 207:379–387. doi:10.1016/j.flora.2012.03.003.
- Bolker BM, Brooks ME, Clark CJ, Geange SW, Poulsen JR, Stevens MHH, White J-SS. 2009. Generalized linear mixed models: a practical guide for ecology and evolution. Trends Ecol Evol. 24:127–135. http://www.sciencedirect.com/science/article/pii/S0169534709000196. doi:10.1016/j.tree.2008.10.008.
- Bray RH, Kurtz LT. 1945. Determination determination of total, organic and available forms of phosphorus in soils. Soil Sci. 59:39–46. doi: 10.1097/00010694-194501000-00006
- Caccianiga M, Luzzaro A, Pierce S, Ceriani RM, Cerabolini B. 2006. The functional basis of a primary succession resolved by CSR classification. Oikos 112:10–20. http://onlinelibrary.wiley.com/doi/10.1111/j.0030-1299.2006.14107.x/full. doi: 10.1111/j.0030-1299.2006.14107.x
- Caria MC, Capra GF, Buondonno A, Seddaiu G, Vacca S, Bagella S. 2015. Small-scale patterns of plant functional types and soil features within Mediterranean temporary ponds. Plant Biosyst- Int J Dealing Aspects Plant Biol. 149:384–394. doi:10.1080/11263504.2013.821097.
- Casa R, Castrignanò A. 2008. Analysis of spatial relationships between soil and crop variables in a durum wheat field using a multivariate geostatistical approach. Eur J Agron 28:331–342. http://www.sciencedirect.com/science/article/pii/S1161030107001050. doi: 10.1016/j.eja.2007.10.001
- Cerabolini BEL, Brusa G, Ceriani RM, de Andreis R, Luzzaro A, Pierce S. 2010. Can CSR classification be generally applied outside Britain? Plant Ecol. 210:253–261. doi: 10.1007/s11258-010-9753-6
- Chapin III FS. 1980. The mineral nutrition of wild plants. Annu Rev Ecol Syst. 11:233–260. doi: 10.1146/annurev.es.11.110180.001313
- Comolli R, Bernardelli E, Ferré C. 2011. Pedologia: tipi di suolo e loro caratteristiche. In: Aldighieri B, Mazzoleni G, editors. La Valchiavenna: un bacino pilota per il controllo dell’ambiente alpino. [place unknown]: [publisher unknown]; p. 55–107 (Quaderni di Geodinamica Alpina e Quaternaria; vol. 10).
- Darmody RG, Thorn CE, Schlyter P, Dixon JC. 2004. Relationship of vegetation distribution to soil properties in kärkevagge, Swedish Lapland. Arct Antarct Alp Res. 36:21–32. doi: 10.1657/1523-0430(2004)036[0021:ROVDTS]2.0.CO;2
- Diaz S, Kattge J, Cornelissen JHC, Wright IJ, Lavorel S, Dray S, Reu B, Kleyer M, Wirth C, Prentice IC, et al. 2016. The global spectrum of plant form and function. Nature. 529:167. doi: 10.1038/nature16489
- Dubuis A, Rossier L, Pottier J, Pellissier L, Vittoz P, Guisan A. 2013. Predicting current and future spatial community patterns of plant functional traits. Ecography. 36:1158–1168. doi: 10.1111/j.1600-0587.2013.00237.x
- Ejrnaes R, Bruun HH. 2000. Gradient analysis of dry grassland vegetation in Denmark. J Veg Sci. 11:573–584. doi: 10.2307/3246587
- FAO. 2006. Guidelines for soil description. 4., [rev.] ed. Rome: FAO. 97 p. ISBN: 9251055211. eng.
- Ferré C, Comolli R, Leip A, Seufert G. 2014. Forest conversion to poplar plantation in a Lombardy floodplain (Italy): Effects on soil organic carbon stock. Biogeosciences. 11:6483–6493. doi:10.5194/bg-11-6483-2014.
- Garnier E, Cortez J, Billès G, Navas M-L, Roumet C, Debussche M, Laurent G, Blanchard A, Aubry D, Bellmann A. 2004. Plant functional markers capture ecosystem properties during secondary succession. Ecology. 85:2630–2637. doi: 10.1890/03-0799
- Gensac P. 1990. Plant and soil groups in the alpine grasslands of the Vanoise Massif, French Alps. Arct Alp Res. 22:195. doi:10.2307/1551304.
- Geovariances. 2013. Isatis technical ref., ver. 2013.1. [place unknown]: Geovariances.
- Ghanbarian-Alavijeh B, Millàn H. 2010. Point pedotransfer functions for estimating soil water retention curve. Int Agrophysics. 24:243–251.
- Grand S, Rubin A, Verrecchia EP, Vittoz P. 2016. Variation in soil respiration across soil and vegetation types in an alpine valley. PLoS ONE. 11. doi:10.1371/journal.pone.0163968.
- Grime JP. 1977. Evidence for the existence of three Primary strategies in plants and Its relevance to ecological and evolutionary theory. Am Nat. 111:1169–1194. doi:10.1086/283244.
- Grime JP. 1998. Benefits of plant diversity to ecosystems: immediate, filter and founder effects. J Ecol. 86:902–910. doi: 10.1046/j.1365-2745.1998.00306.x
- Grime JP. 2001. Plant strategies, vegetation processes, and ecosystem properties. Chichester: Wiley.
- Grime JP. 2006. Plant strategies, vegetation processes, and ecosystem properties. Chichester: John Wiley & Sons.
- Grime JP, Pierce S. 2012. The evolutionary strategies that shape ecosystems. Chichester: John Wiley & Sons.
- Hallet SH, Hollis JM, Keay CA. 1998. Derivation and evaluation of a set of pedogenically-based empirical algorithms for predicting bulk density in British soils. https://www.landis.org.uk/Predicting_Bulk_Density.pdf.
- Hobbs NT, Baker DL, Bear GD, Bowden DC. 1996. Ungulate grazing in sagebrush grassland: Mechanisms of resource competition. Ecol Appl. 6:200–217. doi: 10.2307/2269564
- Isard SA. 1986. Factors influencing soil moisture and plant community distribution on Niwot Ridge, front range, Colorado, U.S.A. Arct Alp Res. 18:83. doi:10.2307/1551216.
- IUSS Working Group WRB. 2015. World reference base for soil resources 2014 - Update 2015. Roma: [publisher unknown] (World Soil Resources Reports; vol. 106).
- Jackson RB, Canadell J, Ehleringer JR, Mooney HA, Sala OE, Schulze ED. 1996. A global analysis of root distributions for terrestrial biomes. Oecologia. 108:389–411. doi:10.1007/BF00333714.
- Jones WM, Fraser L.H., Curtis P.J. 2010. Plant community functional shifts in response to livestock grazing in intermountain depressional wetlands in British Columbia, Canada (Tor). 2010:511–517. doi:10.1016/j.biocon.2010.10.005.
- Kammer PM, Schöb C, Eberhard G, Gallina R, Meyer R, Tschanz C. 2013. The relationship between soil water storage capacity and plant species diversity in high alpine vegetation. Plant Ecol Divers. 6:457. English. doi:10.1080/17550874.2013.783142.
- Landolt E, Bäumler B, Ehrhardt A, Hegg O, Klötzli F, Lämmler W, Nobis M, Rudmann-Maurer K, Schweingruber FH, Theurillat J-P. 2010. Flora indicativa: Okologische Zeigerwerte und biologische Kennzeichen zur Flora der Schweiz und der Alpen. [place unknown]: Haupt. ISBN: 3258074615.
- Lane SN, Borgeaud L, Vittoz P. 2016. Emergent geomorphic-vegetation interactions on a subalpine alluvial fan. Earth Surf. Process. Landforms. 41:72–86. doi:10.1002/esp.3833.
- Li Y, Shipley B. 2017. An experimental test of CSR theory using a globally calibrated ordination method. PLoS ONE. 12:e0175404. doi: 10.1371/journal.pone.0175404
- Littell RC, Stroup WW, Milliken GA, Wolfinger RD, Schabenberger O. 2006. SAS for mixed models. Cary, NC: SAS institute.
- Manier DJ, Hobbs NT. 2007. Large herbivores in sagebrush steppe ecosystems: livestock and wild ungulates influence structure and function. Oecologia. 152:739–750. doi: 10.1007/s00442-007-0689-z
- Marini L, Scotton M, Klimek S, Pecile A. 2008. Patterns of plant species richness in alpine hay meadows: local vs. landscape controls. Basic Appl Ecol. 9:365–372. doi:10.1016/j.baae.2007.06.011.
- MiPAF. 2000. Metodi di analisi chimica del suolo. Milano: Franco Angeli Editore.
- Moog D, Kahmen S, Poschlod P. 2005. Application of CSR- and LHS-strategies for the distinction of differently managed grasslands. Basic Appl Ecol. 6:133–143. doi:10.1016/j.baae.2005.01.005.
- Muscarella R, Uriarte Ma. 2016. Do community-weighted mean functional traits reflect optimal strategies? Proceedings of the Royal Society B: Biological Sciences. 283:20152434. doi: 10.1098/rspb.2015.2434
- Perez-Riverol Y, Kuhn M, Vizcaino JA, Hitz M-P, Audain E. 2017. Accurate and fast feature selection workflow for high-dimensional omics data. PLoS ONE. 12:e0189875. doi: 10.1371/journal.pone.0189875
- Pierce S, Luzzaro A, Caccianiga M, Ceriani RM, Cerabolini B. 2007. Disturbance is the principal α-scale filter determining niche differentiation, coexistence and biodiversity in an alpine community. J Ecol. 95:698–706. doi: 10.1111/j.1365-2745.2007.01242.x
- Pierce S, Negreiros D, Cerabolini BEL, Kattge J, Diaz S, Kleyer M, Shipley B, Wright SJ, Soudzilovskaia NA, Onipchenko VG, et al. 2017. A global method for calculating plant CSR ecological strategies applied across biomes world-wide. Funct Ecol. 31:444–457. doi: 10.1111/1365-2435.12722
- Pietola L, Horn R, Yli-Halla M. 2005. Effects of trampling by cattle on the hydraulic and mechanical properties of soil. Soil and Tillage Research. 82:99–108. doi: 10.1016/j.still.2004.08.004
- Qin D, Chen Z, Averyt KB, Miller HL, Solomon S, Manning M, Marquis M, Tignor M. 2007. IPCC, 2007: Summary for Policymakers.
- Redjadj C, Duparc A, Lavorel S, Grigulis K, Bonenfant C, Maillard D, Saïd S, Loison A. 2012. Estimating herbaceous plant biomass in mountain grasslands: a comparative study using three different methods. Alp Bot. 122:57–63. doi: 10.1007/s00035-012-0100-5
- Rose AB, Harrison JBJ, Platt KH. 1988. Alpine tussockland communities and vegetation-landform-soil relationships, Wapiti Lake, Fiordland, New Zealand. N Z J Bot. 26:525–540. doi:10.1080/0028825X.1988.10410659.
- Rubio A, Escudero A. 2000. Small-scale spatial soil-plant relationship in semi-arid gypsum environments. Plant Soil 220:139–150. http://link.springer.com/article/10.1023/A:1004764411116.
- Searle SR, Casella G, McCulloch CE. 2009. Variance components. Hoboken: John Wiley & Sons.
- Soil Survey Division Staff. 1993. Soil survey manual. Washington, DC: U.S. Gov Print Office (U.S. Department of Agriculture Handbook; vol. 18).
- Teuber LM, Hölzel N, Fraser LH. 2013. Livestock grazing in intermountain depressional wetlands—effects on plant strategies, soil characteristics and biomass. Agric Ecosyst Environ. 175:21–28. doi:10.1016/j.agee.2013.04.017.
- Toure D, Ge j-w, Zhou J-w. 2015. Interactions between soil characteristics, environmental factors, and plant species abundance: A case study in the karst mountains of Longhushan Nature Reserve, southwest China. J. Mt. Sci. 12:943–960. doi:10.1007/s11629-014-3053-x.
- Zelnik I, Čarni A. 2013. Plant species diversity and composition of wet grasslands in relation to environmental factors. Biodivers Conserv. 22:2179–2192. doi:10.1007/s10531-013-0448-x.
- Zhang Z-h, HuGang N. 2013. Effects of topographical and edaphic factors on the distribution of plant communities in two subtropical karst forests, southwestern China. J Mt Sci. 10:95–104. doi: 10.1007/s11629-013-2429-7