
 ?Mathematical formulae have been encoded as MathML and are displayed in this HTML version using MathJax in order to improve their display. Uncheck the box to turn MathJax off. This feature requires Javascript. Click on a formula to zoom.
ABSTRACT
Anabasis aphylla is a salt and alkali resistant shrub grows in arid and semi-arid areas, which is also a constructive species of desert soil. To reveal the population structure and genetic diversity in populations of A. aphylla, a total of 106 samples were used as experimental materials for sequencing by specific-locus amplified fragment sequencing. In total, we obtained 300105 SNP which had high consistency. Phylogenetic tree of A. aphylla result showed there was a certain difference between these samples, which can be divided into two groups. The Shanon–Wiener index of A. aphylla was 0.4440 and the Nei diversity index was 0.2854. AMOVA analysis showed there was genetic differentiation among the seven groups to a certain level. The genetic diversity analysis showed the genetic variation of A. aphylla mainly from groups. This study provides a reference for further comprehensive study of the genetic structure and evolutionary adaptation of A. aphylla.
1. Introduction
Biodiversity is the foundation of human survival and development. At present, based on niche modeling, natural selection genome, species differentiation, community construction and evolution, it has become one of the fields of biodiversity research by studying the relationship between geographic climate change, ecological interaction and community composition (Hickerson et al. Citation2010). Biodiversity includes genetic diversity, species diversity, ecosystem diversity and landscape diversity (Beer et al. Citation2008; Gibson et al. Citation2011). Among them, genetic diversity is one of the focus contents of conservation biology. The genetic diversity of plant population is often influenced by a variety of biotic and abiotic factors, such as plant breeding systems, genetic drift, natural selection pressure, gene flow, genetic mutations and human destruction (Sun and Geng Citation2014). Molecular marker technology has become one of the most commonly used methods for plant genetic diversity research. In recent years, molecular markers was commonly used in landscape genetics to explore evolution and ecological adaptation and their mechanisms. Wang et al. (Citation2015) studied the population genetic diversity of Tetrastigma hemsleyanum based on SSR. Babaei et al. (Citation2007) revealed the genetic diversity of Damask rose in different regions of Iran using SSR molecular marker technology. As a typical representative of molecular markers, SNP (Single Nucleotide Polymorphisms) not only has the characteristics of high polymorphism, wide distribution, strong genetic stability, but also can achieve high-throughput, automatic detection, with the advantages of low cost and high efficiency (Liu et al. Citation2013).
At present, SNP molecular marker technology has been widely concerned by the relevant fields. SNP markers have been successfully applied to the genetic diversity and phylogenetic analysis of woody plants (Pootakham et al. Citation2011; Ferguson et al. Citation2012; Distefano et al. Citation2013). SLAF-seq (Specific Locus Amplified Fragment Sequencing) technology enables SNP markers covering the whole genome with high density without relying on the genome sequence (Chen Citation2016), it reduces the complexity of the genome by finding suitable restriction enzymes to research the genetic variation of the species. Compared to traditional technologies, SLAF-seq technology not only saves sequencing cost and time, but also is widely used in both model and non-model organisms (Sun et al. Citation2013; Xia et al. Citation2015). It can effectively overcome the complexity of the genome (Duan et al. Citation2018). Reference genome sequences and reference SNPs are not necessary to be find with this method. De novo genotype definition was performed using high-depth sequencing, which overcame the limitations of previous methods (Huang et al. Citation2009; Xie et al. Citation2010; Kennedy et al. Citation2003). For example, SLAF-seq technology has been widely used in the research of soybean and maize (Li et al. Citation2014; Qi et al. Citation2014; Xia et al. Citation2015). Using SLAF-seq technology, Duan et al. (Citation2018) found Ammopitanthus mongolicus in Gansu and Ningxia of China were closely related. In sum, previous research has indicated that SLAF-seq technology was a highly efficient method for plant genetic analysis. However, there were relatively few studies on the genetic diversity of desert plants using SLAF technology.
The growth and distribution of plants in Xinjiang were restricted by drought and lack of rainfall. Due to the limitation of plant diversity, the genetic diversity of arid areas is relatively rare. Since the beginning of the quaternary, the global climate has become colder and drier, and northwest China has experienced many rapid expansion of drought. These changes have profound affection to hydrology and climate of arid regions, which also have an impact on the geographical distribution pattern of local plants (Lu Citation2015). A. aphylla is a chenopodiaceous shrub. It has important ecological, economic and medicinal values (Chu et al. Citation2014). Furthermore, A. aphylla has a certain distribution in China, Iran (Khatibi et al. Citation2017), Kazakhstan and Kyrgyzstan (Chermenskaya et al. Citation2010). In China, it is mainly distributed in Xinjiang. However, due to the influence of agricultural development, oil exploitation, harsh environmental conditions and other activities, the habitat of A. aphylla populations in Xinjiang was severely fragmented. All of this caused the self-renewal ability of A. aphylla population was poor, and most of the areas were in a recession trend (Chu et al. Citation2014).
Earlier, we have carried out research on the geographical distribution prediction of A. aphylla and analyzed the main environmental factors affecting its potential distribution (Chang et al. Citation2020). In Xinjiang, due to the blockage of the Tianshan Mountains and so on, it has a certain effect on gene communication among individuals. Therefore, it is very necessary to study the genetic diversity of the A. aphyllaʹs population. In view of the unique habitat of desert plants, the response to climate change is different from other plants. This study use SNP molecular marker technology to analyze the genetic diversity of A. aphylla distributed in different areas of Xinjiang, which has a certain regional characteristic. The level of genetic diversity of a species is affected by the external environment and internal genetic factors (Yang et al. Citation2017). By studying the genetic diversity of A. aphylla, we can better understand the influence of terrain, topography and other environmental factors on its growth distribution. Our study also provides a valuable resource for further genome-wide association studies in A. aphylla and has a special ecological significance for maintaining fragile ecosystems in the arid regions of northwest China.
2. Materials and methods
2.1. Group selection and sample collection
By investigating wild resources of A. aphylla, seven populations with concentrated distribution and relatively isolated geographical location were selected. About 15 plants were randomly selected in each selected population. To ensure the sample uniformity and minimizing the relationship between the sample plants, the average distance between plants were greater than 20 m. Selected plants with normal growth, no serious defects, no obvious diseases, no insect pests and collected fresh leaves. Using Global Positioning System (GPS) to locate selected groups. A total of 106 samples were collected, specific distribution locations were showed in .
Table 1. The origin of materials of A. aphylla.
2.2. Plant materials and DNA extraction
Collected young healthy leaves were stored in a freezer at −80 °C until DNA extraction. Then DNA isolation and purification of 106 samples were performed using the cetyl trimethyl ammonium bromide (CTAB) method (Doyle and Doyle Citation1987). DNA concentration and quality were estimated using Nanodrop 2000C and Qubit 2.0 by electrophoresis in 0.8% agarose gels with a lambda DNA standard.
2.3. Enzyme solution design
Enzyme digestion prediction software was independently developed by Biomarker Technologies Corporation in Beijing, it was used to predict the enzyme digestion of the reference genome and select the optimal enzyme digestion scheme. In order to acquire more than 119727 SLAF tags (defined as an enzyme fragment sequence of 364–394 bp) per genome, the selection principle is (1) low percentage of restriction fragments comprising repeat sequences; (2) even distribution of restriction fragments across chromosomes; (3) simulated fragments align uniquely to the reference genome (Matsumoto et al. Citation2005); (4) The number of SLAF tags meets the expected number of tag (Shi et al. Citation2016).
In order to evaluate the accuracy of the enzyme digestion experiment, we taking Oryza sativa as a reference genome. The size of Oryza sativa was 374.30 Mb, and the download address was http://rapdb.dna.affrc.go.jp/. We chose Oryza sativa because its genome has been sequenced based on the Sanger sequencing platform and the quality of its genome has been well recognized (Sun et al. Citation2013). HaeIII+RsaI (NEB, Ipswich, MA, USA) was used to digest purified genomic DNA into size of 364–394 bp fragments.
2.4. The development of SLAF tags and SNP tags
Dual-index software (Kozich et al. Citation2013) was utilized to identify SLAF-seq raw data and obtain the reads (isolated alleles) of each sample. Used the same restriction enzyme digestion, BLAF (The BLAST-like alignment tool software) clustered SLAF pairs of all samples according to sequence similarity (Kent Citation2002). Sequences with over 90% identity were clustered in a SLAF locus (or SLAF tag) and a large number of specific fragments were selected for specific molecular marker development. SLAF tags were developed and compared among different samples (Geng et al. Citation2016). Genome-wide SNP markers were developed with the highest depth sequence type in each SLAF tag as the reference sequence. Ultimately, consistent SNPs were selected by the criteria of minor allele frequency (MAF) ≥ 0.05 and integrity ≥ 50%.
Based on the SNPs identified in this study, phylogenetic trees were constructed using the MEGA5 software (Koichiro et al. Citation2011), principal components analysis (PCA) was performed using cluster software (Hoon et al. Citation2004), and the population structure of all samples was analyzed with the software Admixture (Alexander et al. Citation2009).
2.5. Statistical analysis
In this study, 300105 highly consistent SNPs were selected for population genetic analysis. Observed heterozygous number (Ao, Equation 1), Expected heterozygous number (Ae, Equation 2), Nei diversity index (Nei, Equation 3), Shanon-Wiener index (SHI, Equation 4), Polymorphysm information content (PIC, Equation 5), Minor allele frequency (MAF, Equation 6), genetic distance (D, Equation 7) and differentiation coefficients (Fst, Equation 8) were calculated by Biomarker Technologies Corporation. The presence of molecular variance among groups, among populations within groups and within populations was assessed via analysis of molecular variance (AMOVA) using Arlequin (Excoffier et al. Citation2005).
(1)
(1) where X is the number of alleles on location sites (including non polymorphic sites); n is the total number of location sites.
(2)
(2)
(3)
(3) where n is the number of samples; He is expected heterozygosity.
(4)
(4)
(5)
(5) where Pi and Pj are frequencies of ith and jth allele, respectively.
(6)
(6) where Minor_allel is the number of second highest genotypes detected at a site; n is the total number of genotypes detected at a site.
(7)
(7)
(8)
(8) where I is genetic identity; Isp is the total genetic diversity at species level; Ipop is genetic diversity within populations.
3. Results
3.1. Assessment of experimental scheme
We expected that 100000 SLAFs would be selected by Rsa I and Hae III to determine the reliability of this method. Using this scheme, the result predicted 119727 SLAF tags for 364–394 bp. Enzymatic cleavage efficiency of Rsa I and Hae III was 96.31%, which was consistent with expectation. Moreover, based on SLAF library construction and high-throughput sequencing, a total of 262.31Mb reads were obtained to develop SLAF tags. The developed SLAF tags with a Q30 ratio of 95.25% and a GC content of 40.28% (Table S1). The pilot data indicated that the reliability and quality of this SLAF-seq strategy was relatively high.
3.2. Development of polymorphic SLAF tags and selection of SNP markers
Through sequence analysis, a total of 1627177 SLAF tags were developed from the 106 samples of A. aphylla, and the number of SLAF tags obtained per sample ranged from 136410 to 218952 (Table S2). The average sequencing depth of each sample varied from 7.77x to 19.62x. The average sequencing depth was 12x, which met the expectations of SLAF predicted. Of these, 623145 SLAF tags showed polymorphism. Using the highest copy number of per SLAF as the reference sequence to develop SNP markers. A total of 4765351 SNPs were identified from all samples, and the integrity of SNPs in 106 samples was ranged from 15.71% to 38.74% (Table S3). Further, 300105 highly consistent and confident SNP markers with MAF≥0.05 and integrity≥0.5 were obtained. These SNP markers covered the whole genome of A. aphylla.
3.3. Analysis of population structure
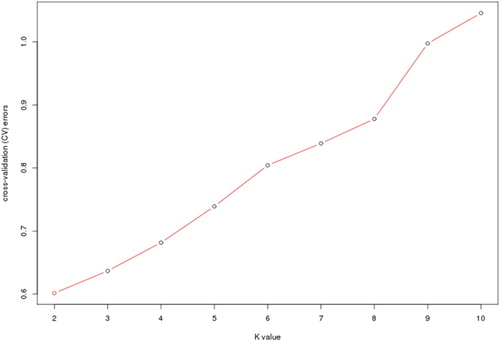
Population genetic structure analysis can provide information on the origin and composition of individuals. It is an important tool for genetic relationship analysis. Population structure results from different allele frequencies between subgroups in the population and suggests that members of each subgroup have the same ancestor, or they experience the same environmental and artificial selection (Xiao et al. Citation2012). Based on the SNP, the population structure of 106 samples was analyzed by admixture (Alexander et al. Citation2009) software. The number of subgroups (K) was predicted from 2 to 10 (), and the number of ancestors was determined according to the position of the minimum value, with error rate obtained from 5-fold cross-validation. Based on cross validation (CV) errors suggested the ancestral subgroup number was two ().
Figure 1. Admixture the individual cluster values corresponding to each K value. The x-axis showed different samples. The y-axis quantified the membership probability of samples belonging to different groups. Colors in each row represented structural components.
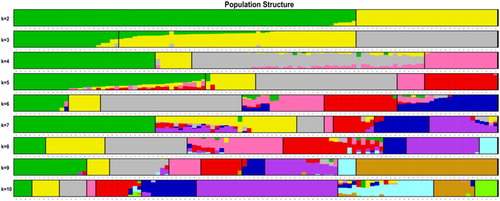
Figure 2. Admixture estimation of the number of groups for K values ranging from 2 to 10.
3.4. Analysis of phylogenetic tree
Based on the analysis of 300105 SNP loci developed, a phylogenetic tree was constructed by MEGA5 (Koichiro et al. Citation2011) software and neighbor-joining algorithm (Saitou and Nei Citation1987). Neighbor-joining cluster analysis clearly divided 106 samples into two groups (). This result was consistent with the assignments made using admixture software. From the clustering result, it can be seen that there are some differences between 106 samples of A. aphylla. Based on a phylogenetic tree, the genetic difference of A. aphylla was influenced by geographical isolation. According to the distribution of A. aphylla in south and north of Xinjiang. This could be the explanation for that is may be the Tianshan mountains block the gene communication between the individuals of A. aphylla and cause the genetic differentiation. Samples of A. aphylla in the KC and ATS regions clustered into a subgroup with a genetic distance of 0.001394 (). BL, CJ, HTB, KLMY and YSJ were clustered into a subgroup (), among them KLMY has a long genetic distance from the other three groups. CJ and YSJ have a closer genetic distance of 0.000806 (). This was consistent with the geographical distribution pattern of A. aphylla. The geographical distance between two populations is relatively close, and the genetic distance is relatively small.
Figure 3. Phylogenetic trees of 106 samples based on the analysis of 300105 SNPs.
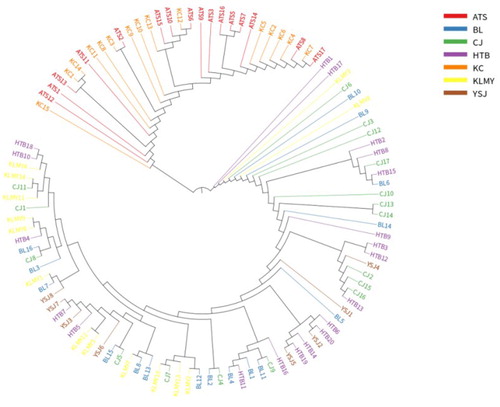
Figure 4. UPGMA dendrogram for the seven A. aphyllaʹs groups.
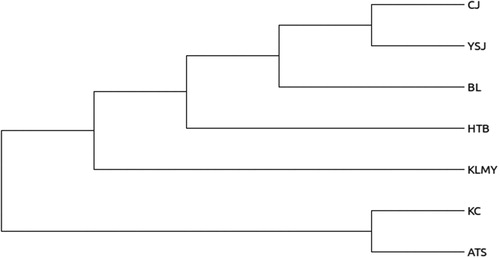
Table 2. Analysis of the genetic distance among seven groups.
3.5. Analysis of PCA
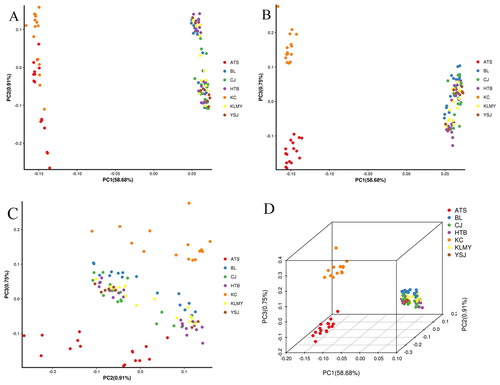
Through PCA analysis, it is possible to know which samples are relatively close and which ones are relatively distant, it can assist evolutionary analysis. The result showed that the first principal component and the second principal component divided 106 samples of A. aphylla into two groups (A). Based on (A), KC and ATS groups form a cluster. However, samples from BL, CJ, HTB, KLMY and YSJ regions of A. aphylla were clustered together, but there was no good distinction between them. The same conclusion is also obtained in the two-dimensional map of the first principal component and the third principal component (B). The second principal component and the third principal component have a small degree of discrimination between regions of KC, ATS and the other five regions (C). Furthermore, the first, the second, and the third principal components explained 58.68%, 0.91%, and 0.75% of the genetic diversity respectively (D).
Figure 5. PCA plots of 106 samples based on the analysis of 300105 SNPs.
3.6. Genetic diversity
The Shanon-Wiener index uses the frequency of an amplification product as the phenotypic frequency of the site to calculates the genetic diversity (Nei Citation1975). In this study, the Shanon–Wiener index of A. aphylla was 0.4440 and the Nei diversity index was 0.2854, the Nei diversity index was basically the same as the Shanon–Wiener index (). The genetic diversity of each population was different. Nei diversity index was between 0.3093 and 0.3811, and Shannon–Wiener index was between 0.4657 and 0.5444. The Nei diversity index and Shanon–Wiener index of the KC were the largest, and of HTB was the smallest. A comparison of the Polymorphysm information content (PIC) revealed that KC group was a highly Polymorphic of 0.2915, where HTB group exhibited the lowest PIC with 0.2462. The mean MAF across the seven groups ranged from 0.2121–0.2842.
Table 3. Genetic diversities of the seven groups of A. aphylla.
3.7. Population differentiation
A population differentiation analysis was performed to analyze the genetic variations among groups, within groups and within populations, as revealed by the population structure. Analysis of AMOVA revealed that the diversity of 72.36% occurred among groups, while the diversity of 34.59% was attributed to genetic differentiation within populations (). The Fst of A. aphylla was 0.7236, and there was a great genetic differentiation among the populations. Pairwise Fst analysis among the seven groups indicated that CJ group and YSJ group were the most closely related, with a Fst of 0.0300 (), this corroborated the results of UPGMA.
Table 4. AMOVA of 106 samples of A. aphylla samples collected in this study.
Table 5. Analysis of the Fst among the seven groups.
4. Discussion
In this study, using SLAF-seq technology developed 1627177 SLAF tags and 300105 SNP sites. The SLAF fragment can fully represent the genome-wide sequence characteristic information, then based on these fragments, a large number of molecular markers and particularly SNPs can be developed (Duan et al. Citation2018). This strategy is suitable for many types of populations and species (Sun et al. Citation2013). Reference genome sequences and polymorphism information are not necessary when this strategy is utilized. This obtained SNP markers distributed across the entire genome, it can represent most of A. aphylla genomic regions.
Due to reproductive isolation and environmental differences, natural populations of the same species distributed in different regions may have different genetic frequencies. It results in genetic differentiation among populations in different regions (Guo Citation2010). According to the phylogenetic tree based on SLAF-seq simplified genomic data, 106 samples of A. aphylla were divided into two subgroups. Preliminary studies on the breeding system of A. aphylla showed that the species was mainly mixed and the seed was transmitted through the wind (Chinese Flora Editing Committee 1979). Large-scale isolation and topography of geography and space can result in the blocking of gene communication between natural populations of plants (Diao et al. Citation2016). Therefore, it infers that the possible reason cause of the formation of two subgroups of A. aphylla is the block of the Tianshan Mountains, which blocks the gene exchange among individuals of A. aphylla and leads to genetic differentiation. The climatic environment of the northern and southern slopes of Tianshan Mountain is quite different. In KC and ATS where A. aphylla distributes in the south of Tianshan mountain, that has a distant relationship with otherʹs populations distribute in the north of Tianshan mountain. It shows that the isolation caused by geographical factors has a great influence on the existing distribution pattern of plant formation. Different latitude, longitude, altitude and water-heat can lead to different habitats of the species, which will affect the population structure and genetic differentiation of the species (Yan et al. Citation2006). Principal component analysis showed that the distribution characteristics of A. aphylla from north to south were consistent with the ecological characteristics of its habitat.
In this study, we find that the genetic distance between CJ and YSJ is the closest, while the genetic relationship between subgroups and subgroups is slightly farther. This indicates that the genetic differentiation of population is related to geographical distance and is affected by geographical isolation. Taking the Fukang of Xinjiang as the research area, Xu (Citation2003) found that there was no significant correlation between the genetic distance, genetic diversity and the geographic distance of subpopulations of A. aphylla distributed in a small range. But in this study, the distribution area of A. aphylla covers the northern and southern of Xinjiang, it belongs to the larger distribution area. Results of AMOVA analysis shows that 72.36% of the genetic variation of A. aphylla mainly come from among groups, and 34.59% come from with populations. The Nei diversity index is 0.2854 and the Shanon–Wiener index is 0.4440. The Fst of A. aphylla population is 0.7236, indicates there is a great genetic differentiation among the populations. Souza et al. (Citation2013) considered that the level of genetic diversity of a species is caused by a combination of evolutionary historical events, size of distribution, biological characteristics, ecological conditions and human disturbance. In the distribution area, A. aphylla often forms a single-dominant species community and maintains a high genetic diversity. Maybe because its special evolutionary history, unique breeding system and genetic characteristics makes it avoids the loss of genetic diversity (Xu Citation2003).
The climate of A. aphylla distribution area is arid and the soil layer is relatively barren. However, it is characterized by strong stress resistance and drought resistance, which are suitable for the arid climate in the desert area (Wang et al. Citation2017). The large-scale and high-intensity human activities have caused serious disturbance and damage to desert vegetation over a long period of time (Zhang et al. Citation2006) this will inevitably lead to the destruction of biodiversity. The SNP loci developed in this study can provide a reference basis for the subsequent development of SNP markers of A. aphylla. Through the development of SNP markers and the study of population genetic diversity, it can provide a basis for the further study of adaptive evolution of A. aphylla. In addition, because the genetic diversity of plant population is affected by various environmental factors and biological interactions (Souza et al. Citation2013), in the future research, it is of great significance to explore the selection effect of main environmental factors on the population of A. aphylla, so as to identify the site of selection, and further explore the response mechanism of A. aphylla to environmental factors.
5. Conclusions
This study used SLAF-seq technology to sequence A. aphylla distributed in seven different regions of Xinjiang. The population genetic structure of A. aphylla was studied by developing SNP markers with high density and uniform coverage of the whole genome. A total of 1627177 SLAF tags were developed through sequencing analysis of 106 samples of A. aphylla, of which 623145 were polymorphic SLAF tags. Through sequence analysis, a total of 4765351 SNPs was developed. Based on MAF≥0.05 and integrity≥0.5, 300105 highly consistent populations SNPs were obtained. Further phylogenetic tree analysis and PCA analysis of 300105 SNPs showed that 106 samples of A. aphylla from seven distribution areas could be divided into two groups. Through analysis, it was found that the results of molecular clustering of A. aphylla were basically consistent with the geographical location of populations, indicating that the genetic differentiation of A. aphylla was related to geographical distance and affected by geographical isolation. The genetic diversity analysis showed that the genetic variation of A. aphylla mainly from population. This study provides a reference for further comprehensive study of genetic structure and evolutionary adaptation of A. aphylla.
Supplemental Material
Download MS Word (156 KB)Supplemental Material
Download MS Word (88 KB)Supplemental Material
Download MS Word (130 KB)Acknowledgements
Guangming Chu and Yaling Chang designed the study. Mei Wang, Yaling Chang, Guangming Chu and Mengwen Peng performed the experiments and collected the data. Mei Wang and Yaling Chang designed and performed the data analysis. Yaling Chang led the writing of the manuscript. Guangming Chu and Mei Wang reviewed and edited the manuscript. All authors participated in data interpretation and revised the manuscript.
Disclosure statement
No potential conflict of interest was reported by the author(s).
Data availability statement
The raw data of sequencing data have been published in NCBI (https://www.ncbi.nlm.nih.gov/Traces/study/?acc=PRJNA549341).
Additional information
Funding
Notes on contributors
Yaling Chang
Yaling Chang is a master’s degree student, studied at the Agricultural College of Shihezi University, Xinjiang, China. Her main research direction is forest ecology.
Mengwen Peng
Mengwen Peng is a master’s degree student, studied at the Agricultural College of Shihezi University, Xinjiang, China. Her main research direction is forest ecology.
Guangming Chu
Guangming Chu is an associate professor of ecology, focuses on forest ecology and conservation and utilization of woody plant resources. His main works include the research on the construction of artificial oasis protection ecological security system (Xinjiang, China, 2012) and the physiological and ecological responses and adaptation strategies of vegetation in arid and semi-arid regions (Xinjiang, China, 2010).
Mei Wang
Mei Wang is an associate professor of ecology, focuses on forest ecology and conservation biology. Her main works include the research on the construction of artificial oasis protection ecological security system (Xinjiang, China, 2012) and the ecological and conservation techniques of endangered plant populations in Qinling (Xinjiang, China, 2015).
References
- Alexander DH, Novembre J, Lange K. 2009. Fast model based estimation of ancestry in unrelated individuals. Genome Res. 19:1655–1664. doi:10.1101/gr.094052.109.
- Babaei A, Tabaei-Aghdaei SR, Khosh KM, Omidbaigi R. 2007. Microsatellite analysis of Damask rose (Rosa damascena mill.) accessions from various regions in Iran reveals multiple genotypes. Plant Biol. 7:12. doi:10.1186/1471-2229-7-12.
- Beer R, Kaiser F, Schmidt K, Ammann B, Carraro G, Grisa E, Tinner W. 2008. Vegetation history of the walnut forests in Kyrgyzstan (Central Asia). Quat Sci Rev. 27:621–632. doi:10.1016/j.quascirev.2007.11.012.
- Chang YL, Peng MW, Chu GM, Wang M. 2020. Maxent modelling for predicting impacts of climate change on the potential distribution of Anabasis aphylla in northwestern China. Appl Ecol Env Res. 18:1637–1648. doi:10.15666/aeer/1801_16371648.
- Chen XJ. 2016. Genetic evolution and related species research of Mythimna separata in the overwintering range [Master thesis]. Chinese Academy of Agricultural Sciences.
- Chermenskaya TD, Stepanycheva EA, Shchenikova AV, Chakaeva ASH. 2010. Insectoacaricidal and deterrent activities of extracts of Kyrgyzstan plants against three agricultural pests. Ind Crop Prod. 32:157–163. doi:10.1016/j.indcrop.2010. 04.009 doi: 10.1016/j.indcrop.2010.04.009
- Chu GM, Wang M, Zhang SX. 2014. Spatial point patters of Anabasis aphylla populations in the proluvial fan of south Junggar Basin. Scientia Silvae Sinicae. 50:8–14. doi:10.11707/j.1001-7488.20140402.
- Diao SF, Shao WH, Chen T, Jiang JM, Duan WB. 2016. Genetic diversity of Sapindus mukorossi natural populations in China based on ISSR. For Res. 29:176–182. doi:10.13275/j.cnki.lykxyj.2016.02.004.
- Distefano G, Malfa SL, Gentile A, Wu SB. 2013. EST-SNP genotyping of citrus species using high-resolution melting curve analysis. Tree Genet Genomes. 9:1271–1281. doi:10.1007/s11295-013-0636-6.
- Doyle JJ, Doyle JL. 1987. A rapid DNA isolation procedure for small quantities of fresh leaf tissue. Phytochem Bull. 19:11–15.
- Duan YZ, Wang JW, Du ZY, Kang FR. 2018. SNP sites developed by specific length amplification fragment sequencing (SLAF-seq) and genetic analysis in Ammopitanthus mongolicus. Bull Bot Res. 38:141–147. doi:10.7525/j.issn.1673-5102. 2018.01.017.
- Excoffier L, Laval G, Schneider S. 2005. Arlequin (version 3.0): an integrated software package for population genetics data analysis. Evol Bioinform Online. 1:47–50. doi:10.1143/JJAP.34.L418 doi: 10.1177/117693430500100003
- Ferguson ME, Hearne SJ, Close TJ, Wanamaker S, Moskal WA, Town CD, Young JD, Marri PR, Rabbi IY, Villiers EPD. 2012. Identification, validation and high-throughput genotyping of transcribed gene SNPs in cassava. Theor Appl Genet. 124:685–695. doi:10.1007/s00122-011-1739-9.
- Geng XX, Jiang CJ, Yang J, Wang LJ, Wu XM, Wei WH. 2016. Rapid identification of candidate genes for seed weight using the SLAF-Seq method in Brassica napus. Plos One. 11:e0147580. doi:10.1371/journal.pone.0147580.
- Gibson L, Lee TM, Koh LP. 2011. Primary forests are irreplaceable for sustaining tropical biodiversity. Nature. 478:378–381. doi:10.1038/nature10425.
- Guo N. 2010. Genetic diversity of natural populations of Rosa Laxa Retz. and Rosa platyacantha Schrenk in Tianshan mountains of Xinjiang [Master thesis]. China Academy of Agricultural Science.
- Hickerson MJ, Carstens BC, Cavender-Bares J, Crandall KA, Graham CH, Johnson JB, Rissler L, Victoriano PF, Yoder AD. 2010. Phylogeography's past, present, and future: 10 years after Avise, 2000. Mol Phylogenet Evol. 4:291–301. doi:10.1016/j.ympev.2009.09.016.
- Hoon MJL, Imoto S, Nolan J. 2004. Open source clustering software. Bioinformatics. 20:1453–1454. doi:10.1093/bioinformatics/bth078.
- Huang X, Feng Q, Qian Q, Zhao Q, Wang L. 2009. High-throughput genotyping by whole genome resequencing. Genome Res. 19:1068–1076. doi:10.1101/gr.089516.108.
- Kennedy GC, Matsuzaki H, Dong S, Liu WM, Huang J. 2003. Large-scale genotyping of complex DNA. Nat Biotechnol. 21:1233–1237. doi:10.1038/nbt869.
- Kent WJ. 2002. BLAT—the BLAST-like alignment tool. Genome Res. 12:656–664. doi:10.1101/gr.229202.
- Khatibi R, Soltani S, Khodagholi M. 2017. Effects of climatic factors and soil salinity on the distribution of vegetation types containing Anabasis aphylla in Iran: a multivariate factor analysis. Arab J Geosci. 10:36. doi:10.1007/s12517-016-2812-0.
- Koichiro T, Daniel P, Glen S, Masatoshi N, Sudhir K. 2011. MEGA5: molecular evolutionary genetics analysis using maximum likelihood, evolutionary distance, and maximum parsimony methods. Mol Biol Evol. 28:2731–2739. doi: 10.1093/molbev/msr121
- Kozich JJ, Westcott SL, Baxter NT, Highlander SK, Schloss PD. 2013. Development of a dual-index sequencing strategy and curation pipeline for analyzing amplicon sequence data on the MiSeq Illumina sequencing platform. Appl Environ Microbiol. 79:5112–5120. doi:10.1128/AEM.01043-13.
- Li B, Tian L, Zhang JY. 2014. Construction of a high-density genetic map based on large-scale markers developed by specific length amplified fragment sequencing (SLAF-seq) and its application to QTL analysis for isoflavone content in Glycine max. BMC Genomics. 15:1086. doi:10.1186/1471-2164-15-1086.
- Liu SG, Li CG, Meng QX, Liu YW, Cheng FY. 2013. The progress and application of SNP in rice. North Rice. 43:67–71+74. doi:10.16170/j.cnki.1673-6737.2013.04.026.
- Lu W. 2015. Phylogeography of Nitraria roborowskii based on cpDNA sequences [Master thesis]. Shihezi university, China.
- Matsumoto T, Wu JZ, Kanamori H, Katayose Y. 2005. The map-based sequence of the rice genome. Nature. 436:793–800. doi:10.1038/nature03895.
- Nei M. 1975. Molecular population genetic sand evolution. Amsterdam and New York: North Holland Press. p. 372–373.
- Pootakham W, Chanprasert J, Jomchai N, Sangsrakru D, Yoocha T, Therawattanasuk K, Tangphatsornruang S. 2011. Single nucleotide polymorphism marker development in the rubber tree, Hevea brasiliensis (Euphorbiaceae). Am J Bot. 98:e337–e338. doi:10.3732/ajb.1100228.
- Qi ZM, Huang L, Zhu RS, Xin DW, Liu CY, Han X. 2014. A high-density genetic map for soybean based on specific length amplified fragment sequencing. Plos One. 9:e104871. doi:10.1371/journal.pone.0104871.
- Saitou N, Nei M. 1987. The neighbor-joining method: a new method for reconstructing phylogenetic trees. Mol Biol Evol. 4:406–425.
- Shi X, Wang RY, Tang J, Li ZY, Luo YH. 2016. Analysis of interspecific SNPs in sweet potato using a reduced-representation genotyping technology. Acta Agronomica Sinica. 42:641–647. doi:10.3724/SP.J.1006.2016.00641.
- Souza I, Souza V, Lima P. 2013. Molecular characterization of Platonia insignis Mart. (“Bacurizeiro”) using inter simple sequence repeat (ISSR) markers. Mol Biol Rep. 40:3835–3845. doi:10.1007/s11033-012-2462-6.
- Sun L, Geng QF. 2014. Research methods and influencing factors of genetic diversity of rare and endangered plants. Chinese J Anhui Agr Sci. 42:3793–3798. doi:10.3969/j.issn.0517-6611.2014.13.007.
- Sun XW, Liu DY, Zhang XF, Li WB, Liu H, Hong WG, Jiang CB, Guan N, Ma CX, Zeng HP. 2013. SLAF-seq: an efficient method of large-scale De novo SNP discovery and genotyping using high-throughput sequencing. Plos One. 8:e58700. doi:10.1186/1471-2229 -13-141 doi: 10.1371/journal.pone.0058700
- Wang YH, Jiang WM, Comes HP, Hu FS, Qiu YX, Fu CX. 2015. Molecular phylogeography and ecological niche modelling of a widespread herbaceous climber, Tetrastigma hemsleyanum (Vitaceae): insights into Plio-Pleistocene range dynamics of evergreen forest in subtropical China. New Phytol. 206:852–867. doi:10.1111/nph.13261.
- Wang TT, Ye CX, Wang M, Chu GM. 2017. Identification of cold-stress responsive proteins in Anabasis aphylla seedlings via the iTRAQ proteomics technique. J Plant Interact. 12:505–519. doi:10.1080/17429145.2017.1397204.
- Xia C, Chen LL, Rong TZ, Li R, Xiang Y, Wang P, Liu CH, Dong XQ, Liu B, Zhao D, et al. 2015. Identification of a new maize inflorescence meristem mutant and association analysis using SLAF-seq method. Euphytica. 202:35–44. doi:10.1007/s10681-014-1202-5.
- Xiao Y, Cai D, Yang W, Ye W, Younas M, Wu J. 2012. Genetic structure and linkage disequilibrium pattern of a rapeseed (Brassica napus L.) association mapping panel revealed by microsatellites. Theor Appl Genet. 125:437–447. doi:10.1007/s00122-012- 1843-5 doi: 10.1007/s00122-012-1843-5
- Xie W, Feng Q, Yu H, Huang X, Zhao Q. 2010. Parent-independent genotyping for constructing an ultrahigh-density linkage map based on population sequencing. Proc Natl Acad Sci U S A. 107:10578–10583. doi:10.1073/pnas.1005931107.
- Xu L. 2003. Studies on ecological genetics of the important desert plants natural populations in Fukang, Xinjiang [PhD thesis]. University of Xibei, China.
- Yan XB, Guo YX, Zhou H, Wang K. 2006. Analysis of geographical conditions affected on genetic variation and relationship among populations of E lymus. J Plant Resour Environ. 15:17–24.
- Yang HS, Wang Y, Qi XL, Wang CP. 2017. Advances in research methods of plant genetic diversity. China Sci Techn Inf. 15:47–48. doi:10.3969/j.issn.1001-8972.2017.15.015.
- Zhang P, Dong YZ, Wei Y, Hu CZ. 2006. ISSR analysis of genetic diversity of Haloxylon ammodendron (C. A.Mey) Bunge in Xinjiang. Chinese Acta Botanica Boreali-Occidentalia Sinica. 26:1337–1341. doi:10.3321/j.issn:1000-4025.2006.07.007.