
ABSTRACT
In this study, annual Magnolia denudata seedlings were treated with a 200 mmol L−1 NaCl solution. Na+ content in its stems increased by more than about 24 times after 72 h and K+ content in leaves basically maintained in a steady state. MdeSOS1, isolated from M. denudata, comprised a 3453-bp ORF and included 12 transmembrane structures within its N terminal and a hydrophilic tail in its C-terminal. Its protein shared the identity of 68.3% and 62.7% at the peptide level with the homologue PeSOS1 and AtSOS1 respectively. The MdeSOS1 was significantly induced to up-regulation in various tissues exposed to salt stress and improved the salt tolerance of Arabidopsis. Our results also revealed that the MdeSOS1-GFP fusion protein was located on the plasma membrane and MdeSOS1 encoded a salt-inducible plasma membrane Na+/H+ antiporter, which provides a reference to improve the salt tolerance of Magnolia species by transgenic approaches.
Introduction
Salt stress has a significant effect on plant growth and development that is mainly restrained by excessive soluble ions, such as sodium and chloride ions (Yue et al. Citation2012). Intracellular elevated Na+ concentrations not only cause single salt toxicity but also trigger a variety of physiological metabolic disorder in plants. Excessive Na+ competes with and replaces K+, disrupting the balance of the K+/Na+ ratio (Deinlein et al. Citation2014). The decrease in intracellular K+ concentration further affects the activity of enzymes, influences multiple enzymatic reactions and then produces toxic effects in cells (Olías et al. Citation2009). It is essential for plants to transport and exclude Na+ from cells to maintain ion balance under salt stress. In addition, the influx of Na+ is a passive process, which mainly depends on differences in the negative potential of the plasma membrane and low concentrations of Na+ in the cytosol, while Na+ compartmentation and exclusion are indirect and active processes (Deinlein et al. Citation2014).
In high salinity medium, Na+ of high concentrations enters the roots and is transported to the leaves. The excessive Na+ in the leaves is translocated to vacuoles or exude from cells through Na+/H+ antiporter proteins located in both the plasma and the tonoplast (Shi et al. Citation2002). The H+-adenosine triphosphatase (H+-ATPase) in the membrane will generate transmembrane electrochemical H+ gradient potential to provide energy for Na+/H+ antiporters (Gao et al. Citation2016). Salt overly sensitive (SOS) signal pathway is a major mechanism at the cellular level to control Na+ efflux and transport. Three main protein components SOS1, SOS2, and SOS3 were found in the model plant Arabidopsis thaliana (Shi et al. Citation2000). The gene for the first plasma membrane Na+/H+ antiporter, SOS1, was initially demonstrated by positional cloning in A. thaliana (Shi et al. Citation2000). Its salt tolerance was demonstrated in AtSOS1-overexpressing lines and 35S:AtSOS1 lines were correlated with decreased Na+ accumulation compared with that in control plants grown in MS medium with 50 mmol L−1 NaCl (Shi et al. Citation2003). Additionally, SOS3 activates and binds SOS2, and the SOS3-SOS2 protein kinase complex regulates the expression and activity of the ion transporter SOS1 (Qiu et al. Citation2002). To date, the gene encoding the SOS1 protein has been cloned from a variety of plants, including edible plants such as tomato (Olías et al. Citation2009), wheat (Xu et al. Citation2008) and cucumber (Wang et al. Citation2012), ornamental plants such as Helianthus tuberosus (Yan et al. Citation2007), Dendranthema crissum and Artemisia japonica (Song et al. Citation2012), and the woody plants Bruguiera gymnorrhiza and Populus euphratica (Wu et al. Citation2007). SOS1 mediates Na+ distribution in plant organs (Chung et al. Citation2008) and can be expressed preferentially in the root epidermis and the parenchyma cells of the xylem (Shi et al. Citation2002). In P. euphratica, the expression of PeSOS1 enhanced plant salt tolerance by exuding Na+ from cells (Wu et al. Citation2007).
Magnolias (Magnolia spp.) are an excellent ornamental tree species in early spring with wide distribution in China. Most of the present studies concentrate on their phylogenetic evolution, flooding or drought stress (Wu et al. Citation1991; Xu and Rudall Citation2006; Shi et al. Citation2014), while few reports on their salt tolerance. It was found that M. virginiana did not exhibit a remarkably reduction in shoot dry mass, root dry mass or leaf surface area during flooding or drought (Nash and Graves Citation1993), while other researchers investigated the physiological activities of M. wufengensis under drought stress and the changes of the photosynthesis parameters of M. sinostellata under flooding and shading stress (Sang et al. Citation2011; Yu et al. Citation2019).
In saline areas, magnolias tends to grow poorly and hard to form excellent visual effects. Magnolia denudata is widely used as a rootstock in the propagation of magnolias due to its strong resistance. In this study, the Na+ and K+ contents in different tissues (root, shoot and leaf) of M. denudata annual seedlings were detected under salt stress. The SOS1 homolog MdeSOS1 isolated from M. denudata was analyzed, and its expression was further detected under virous abiotic stress. The subcellular localization experiment suggested that MdeSOS1 was located on the plasma membrane. Furthermore, the MdeSOS1 gene in A. thaliana was transformed into wild-type (WT) and mutant (atsos1-1) to assess the contribution of MdeSOS1 to salinity tolerance.
Materials and methods
Plant materials and growth conditions
Annual M. denudata seedlings were maintained in the germplasm repository for magnolias (located at 30°15’14” N/119°43’39” E) at Zhejiang Agriculture and Forestry University, Hangzhou, China. All of the materials were grown in incubator (PGX-350B, Saifu, Ningbo) under a 14 h day/10 h night cycle, 27°C day/25°C night temperature, light intensity of 170 μmol m−2s−1 and 65%-70% relative humidity. Uniform seedlings were selected and transferred to a liquid culture containing half-strength Hoagland’s solution (Hewitt Citation1952), and NaCl was dissolved in it at 200 mmol L−1. 20% polyethylene glycol (PEG) 6000 and 50 mmol L−1 CdCl2 was configured in the same way. The seedlings were transferred into the climatic chamber (Premium ICH insect chamber; Snijders Labs, Tilburg, Netherlands) for the low temperature of 4°C, and the light and relative humidity remain the same as before. After 0, 1, 3, 6, 12 and 24 h of treatment, samples induced by abiotic stress were extracted for analysis of gene expression.
Determination of Na and K ion content in different tissues in M. denudata
To detect the ion content and distribution, different tissues (leaf, stem and root) were separately harvested under various stresses. The harvested leaves are middle mature leaves, and three leaves are taken from each plant. Experiments in each tissue sample were repeated three times. The samples were oven-dried at 70°C (3 d) and then ground into powder with a mortar. A total of 0.2 g of the powder was accurately weighed and digested with 18 mL of a solution (nitric acid: perchloric acid=5:1) on an electric heating plate until the white smoke appeared. Finally, 20 mL of deionized water was added after cooling that was then filtered and transferred to a 100 mL bottle. The Na+ and K+ contents were determined by atomic absorbance spectrophotometry (AA6650F; Shimadzu). Each measurement was repeated three times. The significance of the differences was analyzed using Duncan’s multiple range tests with SPSS v 17.0 software.
RNA extraction and cDNA synthesis
RNA was extracted from the tissues of plants exposed to 200 mmol L−1 NaCl using an RNA Prep Plant Kit (DP441; Tiangen) following the manufacturer's protocol. The first strand of the cDNA was synthesized according to the instructions of the Prime Script TM RT Master Mix (RR036A; Takara) reagent and used as a template for PCR amplification.
MdeSOS1 isolation and sequence analysis
According to the transcriptome database (NCBI: SRR6407153) constructed in the early stage of our research, we screened out the sequence (CL13.Contig3_JN) related to MdeSOS1 gene and designed specific primers (R_F/R_R) with PRIMER 5.0 software (). The PCR products were cloned into the pMD19-T vector using T4 DNA Ligase (2011A; Takara). Then, the recombinant vector was transferred into Escherichia coli (E. coli) DH5α competent cells and grown on Luria–Bertani (LB) medium with 50 mg·mL−1 kanamycin. Positive bacterial colonies were detected by PCR using specific primers. The bacteria solution was sent to Sangon Biotech (Shanghai, China) for sequence verification. Open reading frames (ORFs) were identified using the ORF-FINDER program (https://www.ncbi.nlm.nih.gov/orffinder). The physical and chemical parameters of the MdeSOS1 protein were analyzed by the ProtParam tool (https://web.expasy.org/protparam/). Protein signal peptides were predicted using the SignalP 4.1 server (http://www.cbs.dtu.dk/services/SignalP/). Conserved domains within proteins were obtained from NCBI (https://www.ncbi.nlm.nih.gov/Structure/cdd/wrpsb.cgi). Protein structure–activity analysis was carried out using SWISS-MODEL (https://swissmodel.expasy.org/) and TMHMM (http://www.cbs.dtu.dk/services/TMHMM/).
Table 1. The sequences of primers used for PCR.
Specific expression of MdeSOS1 in different tissues under abiotic stress
Real-time quantitative PCR (qPCR) was employed to detect the specific expression of MdeSOS1. The qPCR primers were designed by PRIMER 5.0 and are shown in . The GBP (GTP-binding protein), UBQ (Polyubiquitin protein) and UBC (Ubiquitin-conjugating enzyme) were used as the reference genes (Chang et al. Citation2018). Each 20 μL reaction contained 10 μL TB Green™ Premix Ex Taq™ II (RR820L; Takara), 2 μL cDNA, 0.8 μL of each primer (10 μmol·L−1) and 6.4 μL ddH2O. The amplification program comprised an initial denaturation (95°C/30 s) followed by 40 cycles of 95°C/5 s, 61°C/30 s and 72°C/20 s. A melting curve was from 60°C to 95°C, with each cycle increased by 0.5°C for 0.05 s to obtain the melting temperature, and the fluorescence signal was collected. Relative transcript levels were calculated using the 2−ΔΔCt method (Livak and Schmittgen Citation2001). Each sample was repeated three times.
Subcellular localization of MdeSOS1
A PCR-generated KpnI and SalI fragment containing the MdeSOS1 ORF was cloned in-frame to the C-terminal end of green fluorescent protein (GFP) in the 35S-GFP-nos plasmid to generate MdeSOS1-GFP and used to define the subcellular location of MdeSOS1. The primers (S_F/S_R) were designed by PRIMER 6.0 (). GFP was located behind the inserted MdeSOS1 gene, and the terminator was removed from the downstream primer sequence so that GFP could be expressed. A recombinant expression vector was used to transform E. coli DH5α grown on LB medium with kanamycin (50 mg·mL−1). Positive bacterial colonies were selected for and amplified to extract recombinant plasmid and then verified by PCR and double enzyme restriction. The recombinant plasmid was transformed into A. tumefaciens GV3101, cultivated overnight at 28°C and harvested at an OD600 of 1.5–2.0 in YEB medium supplemented with 100 mg·mL−1 rifampicin and 25 mg·mL−1 kanamycin. Finally, Agrobacterium cells were diluted to an OD600 of approximately 0.1 for the infiltration of onion epidermal cells (Xu et al. Citation2014). Images of epidermal cells expressing GFP were obtained by using a laser scanning confocal microscope (LSM-510, Carl Zeiss AG).
Constructs and plant transformation in WT and mutant Arabidopsis
The ORF of MdeSOS1 was amplified by PCR using the primers with restriction enzyme site (T_F/T_R) (Table. 1). The PCR products were ligated to pCAMBIA1301-35S-MdeSOS1 downstream of the CaMV 35S promoter. Then, the recombinant plasmid was transformed into A. tumefaciens GV3101 by the liquid nitrogen freeze–thaw method. A. thaliana transformation was performed using the inflorescence infection technique. Positive transgenic lines (WT 35S:MdeSOS1 and atsos1-135S:GmsSOS1) were selected on MS medium (HB8469, Hope, Qingdao) plus 50 mg·mL−1 hygromycin and advanced to the T3 generation to obtain homozygous lines for the next experiment. Seeds from the WT, atsos1-1, WT 35S:MdeSOS1, and atsos1-1 35S:MdeSOS1 plants were sown in MS agar medium supplemented with 100 mmol L−1 NaCl or no NaCl. After vernalization for 3 days at 4°C, the medium was moved to a phytotron under a controlled environment with 23°C /14 h of light and 20°C /10 h of darkness. Seedling root growth and seed germination were observed and determined after 15 days of incubation.
Statistical analysis
Data are reported as the means ± SEs of three replicates and were analyzed using Duncan’s multiple range tests with P<0.05 indicating significance.
Results
Phenotypes and ion contents were changed by salt stress
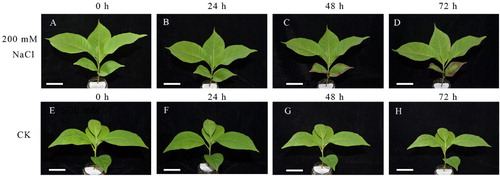
The phenotype of M. denudata following 200 mmol L−1 NaCl treatment was investigated, and the margin of the bottom leaves of plants exhibited wilting and yellowing at 48 h. These symptoms became more pronounced as the treatment time was extended. After 72 h, the tip of the middle leaves also appeared to scorched and the bottom leaves edges were showed necrotic phenotype().
Figure 1. Phenotypic change of M. denudata exposure to 200 mmol L−1 NaCl. (A)-(D): plants exposed to NaCl. (E)-(H): Plants grown in the absence of stress. Bar=5.0 cm.
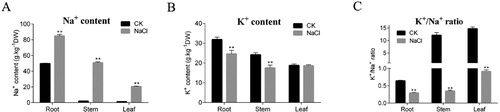
Na+ was significantly increased in roots and shoots after 72 h, while K+ was obviously reduced in roots and stems (but not in leaves). Compared with the expression at 0 h, Na+ increased respectively by 71.06%, 2425.09% and 1502.98% in the roots, stems and leaves after 72 h, while K+ contents reduced by 29.15% and 37.60% in the roots and stems (). Under normal physiological conditions, the plants maintained a high ratio of K+/Na+, which decreased when the plants were exposed to salinity stress. The ratio of K+/Na+ declined markedly in all tissues of M. denudata exposure to the salinity and showed biggest drops in the stem due to the large amount of Na+ was accumulated under salt stress.
Figure 2. Variation in ion contents in seedling tissues. (A) Na+ content, (B) K+ content, (C) K+/Na+ ratio. Data are presented as the mean ± SE (n=3). *, **: means differ significant from levels in the control treatment (P<0.05 and<0.01, respectively)
Sequence analysis of MdeSOS1
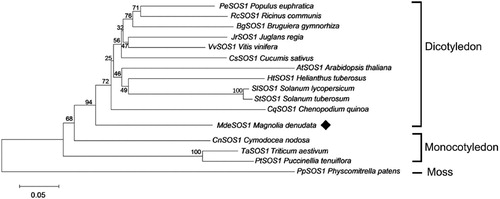
The length of the MdeSOS1 ORF encodeing a protein of 1150 aa residues is 3453 bp. The molecular formula of MdeSOS1 is C5959H9385N1617O1526S87, its relative molecular weight is 130.886 kDa and the theoretical isoelectric point (pI) is 9.70. SignalP analysis for protein signal peptide prediction indicated that MdeSOS1 functions directly in the cytoplasm when synthesized on the ribosome. MdeSOS1 belongs to a group of non-secretory proteins without signal peptides. Amino acid alignment analysis showed that the MdeSOS1 protein contains a conserved Na+/H+ exchanger domain spanning the Nhap transmembrane region, a catabolite gene activator protein-effector domain (CAP_ED), cAMP-receptor proteins (Crp) and cyclic nucleotide monophosphate (cNMP) binding sites. The secondary structure of the MdeSOS1 protein features 12 obvious transmembrane structures in its N-terminal region according to the TMHMM server. Comparison with other plant SOS1 amino acid sequences revealed highly conserved sequences: the identity between MdeSOS1 and AtSOS1 was 62.7%, and that between MdeSOS1 and PeSOS1 was 68.3% (). The phylogenetic tree showed that MdeSOS1 occupies a single branch in the evolutionary process of SOS1 proteins ().
Figure 3. Multiple sequence alignment analysis of MdeSOS1, AtSOS1 (NP_178307.2), PeSOS1 (ABF60872.1) and BgSOS1 (ADK91080.1). The 12 putative transmembrane domains are underlined and numbered 1 through 12. Residues conserved in at least three proteins are highlighted in pink and blue. Nhap, an Na+/H+ exchanger domain spanning the transmembrane region.
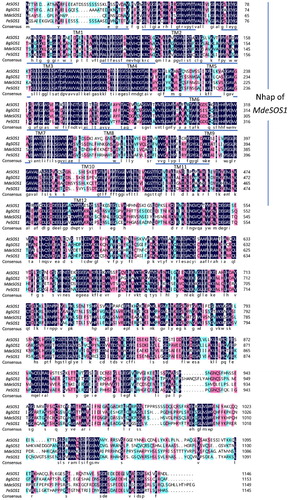
Figure 4. A phylogenetic tree of SOS1 proteins from M. denudata and some other species was constructed using the NJ method with 500 resampling replicates, and a black rhombus indicates the MdeSOS1 isolated here. The other SOSs amino acid sequences were obtained from NCBI. PeSOS1 (ABF60872.1), RcSOS1 (XP_002521897.1), BgSOS1 (ADK91080.1), JrSOS1 (XM_018973127), VvSOS1 (NP_001268140.1), CsSOS1 (AFD64618.1), AtSOS1 (NP_178307.2), HtSOS1 (AGI04331.1), SlSOS1 (NP_001234698.2), StSOS1 (XP_006364070.1), CqSOS1 (ACN66494.1), CnSOS1 (CAD20320.1), TaSOS1 (CAX83738.1), PtSOS1 (ACV60499.1), and PpSOS1 (CAD91921.1).
Transcription profiling of MdeSOS1 under salt and other abiotic stresses
Under salinity stress, MdeSOS1 gene was induced to express in all M. denudata tissues, although response time in roots was slightly later than in stems and leaves. The transcript level in roots and stems also showed a trend of increasing firstly and then decreasing under PEG stress, but in leaves, PEG negatively regulated MdeSOS1 expression. Low temperature increased the abundance of MdeSOS1 transcripts in roots and reduced in stems or leaves though there was a minor and short-lived spike in expression at 12 h. Additionally, all tissues MdeSOS1 transcript level decreased below the pre-treatment condition under CdCl2 stress.
Subcellular localization of MdeSOS1
The MdeSOS1 subcellular location was examined by monitoring GFP fluorescence in living onion epidermis cells transformed with both the MdeSOS1 construct (MdeSOS1-GFP) and the control (35S-GFP). GFP in the cells transformed with MdeSOS1-GFP was exclusively observed at the plasma membrane while35S-GFP fluorescence in the control plasmid-transformed cells was detected in the entire cellular region, including the nucleus and cytoplasm (). Therefore, we speculated that MdeSOS1 was located on the plasma membrane to control sodium ion movement in cells.
MdeSOS1 overexpression enhances salt tolerance in transgenic Arabidopsis plants
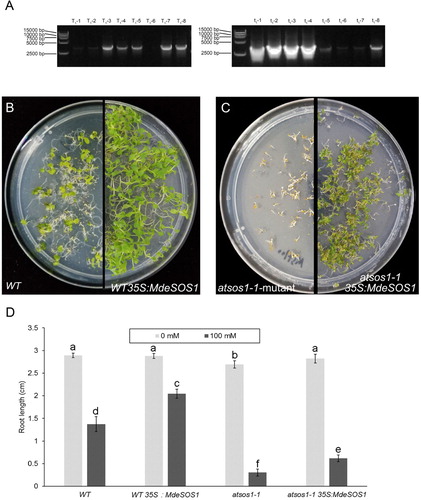
WT, WT 35S:MdeSOS1, atsos1-1 and atsos1-1 35S:MdeSOS1 seeds germinate normally when grown in MS medium with no NaCl, but the root length of the atsos1 seedlings was significantly decreased compared to that of the other plants (P<0.05). When 100 mmol L−1 NaCl was added to the medium, the seedling root length from the four types of A. thaliana plants was obviously reduced compared to that of the control (P<0.05), especially for the atsos1-1 mutant, in which the root length decreased by 83.27% (D). However, when the plants were transformed with MdeSOS1, the root lengths of WT 35S:MdeSOS1 and atsos1-1 35S:MdeSOS1 plants increased respectively by 49.98% and 103.29% compared to non-transgenic plants.
Discussion
Na+ content of the stems increased by more than about 24 times after 72 h of salt stress compared with that at 0 h and the amount of increase was significantly higher than that in roots and leaves. It is plausible that the stem of M. denudata had strong ability to intercept Na+ transport. The distribution of ions in different organs significantly affects the salt tolerance of plants (Guan et al. Citation2010). During salt stress process, the accumulation of Na+ in stems increased significantly, which effectively reduced Na+ stress on other tissues. The result was consistent with ion variation in the woody plant Salix saposhnikovii (Zhou and Zhang Citation2017). As an important inorganic cation in cells, K+ plays a critical role in regulating osmotic pressure and maintaining the integrity of the cell membrane. Salinity had little effect on the level of K+ in leaves and it may be that K+ was transported from the plant stems and roots into leaves for struggling to sustain normal physiological function of leaves, further alleviating the damage caused by Na+ accumulation. Under normal physiological conditions, plants contain a lower Na+ content and a higher K+ content, that is, a higher ratio of K+/Na+. Salt stress disrupts ion balance and reduces the ratio of K+/Na+. As stress time progresses, the ratio of K+/Na+ in all M. denudata tissues displayed obvious decrease. The regulation of the ion steady state has been explicated with some success as a means to discriminate between salt-sensitive and salt-tolerant plants (Song et al. Citation2012; Gao et al. Citation2016). In this study, M. denudata is a woody plant with a tough and strong stem and a well-developed vascular organization, that has large biomass and vigorous physiological metabolic activity. The stem part of M. denudata seemed to give full play to the interception function for Na+ as a response to salt stress. In addition, maintaining the stable state of K+ in leaves through the transport of stem vascular tissue also facilitates to protect photosynthesis tissues.
The SOS1 gene controls the transport of Na+, including its loading and retrieval into or out of the xylem (Shi et al. Citation2002). Several studies have demonstrated that the SOS1 antiporter is not only essential in maintaining ion homeostasis under salinity but also critical for the partitioning of Na+ between plant organs (Olías et al. Citation2009; Gao et al. Citation2016). Thus, we isolated the MdeSOS1 gene from M. denudata. It contains 12 transmembrane domains in hydrophobic N-terminal portion and a long hydrophilic cytoplasmic tail in its C-terminal portion, which is a typical feature of the SOS1 proteins and considered to contact with other proteins in the cell (Zhu Citation2000). In addition to Nhap domain, it also contains CAP_ED, Crp and cNMP. Nhap is a conserved functional domain spanning the transmembrane region that is primarily responsible for inorganic ion transport and metabolism. Further research revealed that Nhap has important functions in Na+ efflux in Pseudomonas aeruginosa (Utsugi et al. Citation1998). CAP_ED and Crp are both present in ion channels, and cNMP partakes cell signal transduction (Zeng et al. Citation2016). Similar domains also exist in AtSOS1 (Shi et al. Citation2000), PeSOS1 (Wu et al. Citation2007), and SlSOS1 (Olías et al. Citation2009). The presence of these domains also confers certain salt tolerance to M. denudata. Magnolia spp. is an original angiosperm and has a primitive position in phylogenetic evolution, so MdeSOS1 is located in a primitive position in the branch of the phylogenetic tree corresponding to dicots. Physcomitrella patens did not evolve a vascular bundle and belonged to a relatively low-level plant on phylogenetic tree and its SOS1 sequence became an independent branch. From the phylogenetic tree, MdeSOS1 is closely related to CnSOS1, while the Populus euphratica PeSOS1 and Bruguiera gymnorhiza BgSOS1 (also the SOS1 sequence of woody plants) have a distant relationship with MdeSOS1.
It was reported that SOS1 proteins was significantly up-regulated in the roots than in either stems or leaves (Gao et al. Citation2016), while other papers had been found that salt stress induced up-regulated expression of SOS1 genes in leaves but not in roots (Wu et al. Citation2007; Cosentino et al. Citation2010). The first case suggests that the SOS1 protein exudes superabundant Na+ from the root cell to protect it from damage in a high-salt environment, while in the second, it has been suggested a function of antiporters as the maintainer of a low cytosolic Na+ concentration in the leaf structure to protect photosynthetic tissues (Ma et al. Citation2014). In this study, the MdeSOS1 is significantly up-regulated in all tissues following the imposition of salinity stress, providing that it may play a key role in the process of salt tolerance. However, the expression in leaves and stems showed a decreasing trend in the late induction period, and these results may be related to the stability of SOS1 mRNA (Chung et al. Citation2008). The similar phenomena can also be observed in Chrysanthemum crissum (Song et al. Citation2012). Salt stress usually reduces the ability of plants to absorb water, so it often implies drought stress. Under PEG treatment, the content of Na+ in all seedling tissues showed an upward trend at 24 h of stress, which would drive the expression of MdeSOS1 gene to play a transport function. The results showed that MdeSOS1 expression was induced in the stems and leaves after PEG treatment for 24 h (). However, the gene in leaves did not appear to be up-regulated, and there may be other mechanisms to regulate ion homeostasis, which can explain K+/Na+ ratio of leaves is relatively stable during the PEG stress period (). In C. crassum and A. thaliana, low temperature does not induce the expression of CcSOS1 and AtSOS1 (Song et al. Citation2012; Shi et al. Citation2000). We also found that low temperature and cadmium chloride stress severely damaged the physiological state of seedlings, and the ion content in the tissues showed irregular variation, which corresponded to the disordered expression of the MdeSOS1. Under CdCl2 stress, the abundance of MdeSOS1 transcripts was significantly lower than that of untreated conditions. In conclusion, MdeSOS1 gene can fully respond to the induction of salt stress in various tissues and its protein was located on the plasma membrane, which means MdeSOS1 may be a salinity-inducible plasma membrane Na+⁄H+ antiporter ( and ).
Figure 5. Transcription profiling of the MdeSOS1 gene in response to abiotic stress. (A) NaCl stress; (B) PEG6000 stress; (C) Low temperature stress; (D) CdCl2 stress. The relative expression in all tissues and all time points was first compared to that of the reference gene in each species and then calculated using the expression at the initial time (0 h) in roots. *, **: differ significant from levels in the control treatment (P<0.05 and<0.01, respectively)
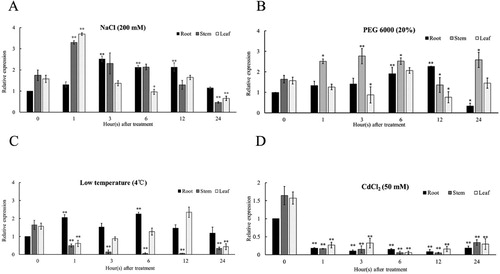
Figure 6 Variation in Na+, K+ contents and K+/Na+ ratio in tissues after PEG6000, low temperature and CdCl2 stress.(A)-(C) Na+ contents. (D)-(F) K+ contents. (G)-(I) K+/Na+ ratio. Data are presented as the mean ± SE (n=3).
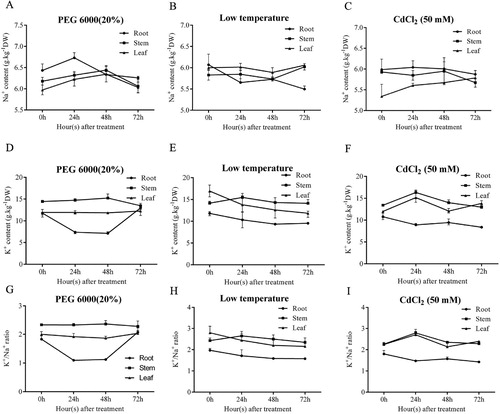
Figure 7. Step verifications of MdeSOS1-GFP construction. (A) The amplification of MdeSOS1 cDNA is shown in line 1; (B) The verification of MdeSOS1-GFP by double enzyme restriction is shown in line 2; (C) Colony PCR of MdeSOS1-GFP is shown in line 3; (D) Model of the constructed vector; (E) The subcellular localization of MdeSOS1-GFP and 35S-GFP. M represents the DNA marker. Bar=100 μm.
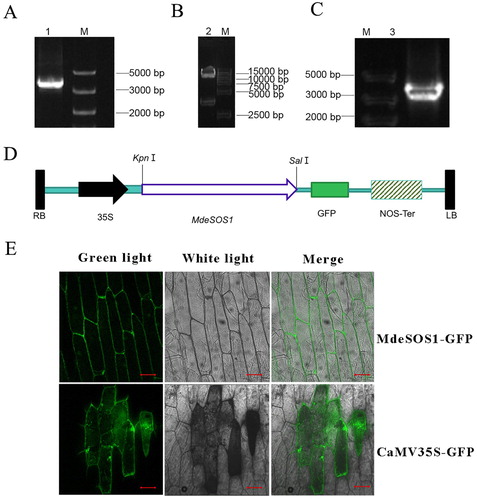
Figure 8. MdeSOS1 overexpression enhance A. thalinan salt tolerance. (A) PCR products of transgenic A. thaliana using upstream primer of 35S promoter and downstream primer of MdeSOS1; the templates for T1-1-T1-8 were from WT 35S:MdeSOS1, and those for lanes t1-1-t1-8 from atsos1-1 35S:MdeSOS1; (B) WT and WT 35S:MdeSOS1 seedlings grown on MS medium plus 100 mmol L−1 NaCl after 15 days; (C) atsos1-1 and atsos1-1 35S:MdeSOS1 seedlings grown on MS medium plus 100 mmol L−1 NaCl after 15 days; (D) Comparison of the root lengths of four Arabidopsis plants.
Overexpression of SOS1 significantly improved the salt tolerance of A. thaliana and tobacco (Shi et al. Citation2003; Yue et al. Citation2012). Compared with those in the control, transgenic plants accumulated fewer sodium ions in the shoots to improve salt tolerance (Shi et al. Citation2003). GmsSOS1 in soybean increased transgenic Arabidopsis salt tolerance by promoting seedling root growth in a saline environment. In the woody plant P. euphratica, the expression of PeSOS1 suppressed the salt-sensitive phenotypes of the EP432 bacterial strain, which lacks the activity of two Na+/H+ antiporters, EcNhaA and EcNhaB (Wu et al. Citation2007). In this study, when MdeSOS1 was overexpressed in WT and sos1-1 mutant, the root length and seed germination rate of transgenic plants outperformed those of non-transgenic plants under 100 mmol L−1 NaCl stress ( (c–e)). These results further demonstrate that MdeSOS1 can enhance the salt tolerance of Arabidopsis. The transgenic atsos1-1 35S:MdeSOS1 plants obviously recovered but did not reached the level of the WT plants. Similarly, the integration of soybean GmsSOS1 into the Arabidopsis sos1-1 mutant increased mutant salt tolerance (Nie and Yu Citation2015)and its complementary phenotypes were superior compared to that of the sos1-1 mutant complemented by rice OsSOS1 and durum wheat TdSOS1. This is because soybean is a moderately salt-tolerant crop plants while rice and wheat are relatively salt-sensitive species. In general, M. denudata is also considered as a relatively salt-sensitive species, so the phenotype of the Arabidopsis sos1-1 mutant complemented with MdeSOS1 did not reach that of the WT plants.
Conclusion
The stems of M. denudata had a strong interceptive effect on Na+ and leaves can maintain the steady state of K+. MdeSOS1 was significantly induced in all tissues under salt stress and it may be a salinity-inducible Na+⁄H+ antiporter, whose overexpression in A. thaliana WT and sos1-1 mutant also enhanced plant salt tolerance. Hence, our results provide a reference for improving the salinity tolerance of Magnolia plants by transgenic approaches and will be useful in the adaptive application of M. denudata as a rootstock in the saline soil.
Disclosure statement
No potential conflict of interest was reported by the author(s).
Additional information
Funding
Notes on contributors
Pengjie Chang
Pengjie Chang is a Postgraduate Student in Zhejiang A&F University. His research interests lie in the area of ornamental horticultural and biology of plant development. His main research area focuses on the plant adverse resistance and regeneration.
Zhen Wu
Zhen Wu is a Postgraduate Studen in Zhejiang A&F University. His research interests lie in the area of ornamental horticultural landscape architecture design.
Nannan Song
Nannan Song is a Postgraduate Studen in Zhejiang A&F University. Her research interests lie in the area of urban planning and landscape architecture design.
Sainan Bian
Sainan Bian is a Postgraduate Studen in Zhejiang A&F University. Her main research area focuses on the ornamental plants and horticulture.
Ninghang Wang
Ninghang Wang is a Postgraduate Studen in Zhejiang A&F University. Her main research area focuses on the ornamental plants and horticulture.
Lingjuan Xuan
Lingjuan Xuan is a Postgraduate Studen in Zhejiang A&F University. Her main research area focuses on the ornamental plants and horticulture.
Bin Dong
Bin Dong is a Doctor Student in Zhejiang A&F University. His main research area focuses on the ornamental plants and horticulture.
Xiaode Wang
Xiaode Wang is a Professor in Zhejiang A&F University. His main research interests are the introduction and application of landscape plants, plant landscaping and ecological landscape research.
Yamei Shen
Yamei Shen is a Professor in Zhejiang A&F University. She mainly engaged in plant landscape planning and design, indoor green decoration, garden ornamental plant industrialization and other aspects of teaching and research.
References
- Chang PJ, Shen YM, Dong B, Bian SN, Wang NH, Xuan LJ, Fan LJ, Yu Q, Wang XL, Zhang C, Wang XD. 2018. Selection of reference gene in Magnolia denudata under salt stress using qRT-PCR. J Agri Biotechnol. 26(9):1611–1620.
- Chung JS, Zhu JK, Bressan RA, Hasegawa PM, Shi HZ. 2008. Reactive oxygen species mediate Na+-induced SOS1 mRNA stability in arabidopsis. Plant J. 53(3):12.
- Cosentino C, Fischer-Schliebs E, Bertl A, Thiel G, Homann U. 2010. Na+/H+ antiporters are differentially regulated in response to NaCl stress in leaves and roots of Mesembryanthemum crystallinum. New Phytol. 186(3):669–680. doi: 10.1111/j.1469-8137.2010.03208.x
- Deinlein U, Stephan AB, Horie T, Luo W, Xu G, Schroeder JI. 2014. Plant salt-tolerance mechanisms. Trends Plant Sci. 19(6):371–379. doi: 10.1016/j.tplants.2014.02.001
- Gao JJ, Sun J, Cao PP, Ren LP, Liu C, Chen SM, Chen FD, Jiang JF. 2016. Variation in tissue Na+ content and the activity of SOS1 genes among two species and two related genera of Chrysanthemum. BMC Plant Biol. 16(1):98. doi: 10.1186/s12870-016-0781-9
- Guan ZY, Chen FD, Chen SM, Tang J, Yang F. 2010. Effects of NaCl stress on organ compartmental allocation of K+, Na+ and Cl- and growth of two Dendranthema species seedlings. Acta Ecologica Sinica. 30(12):3198–3205.
- Hewitt EJ. 1952. Composition and preparation of nutrient solution. In: Hewitt E.J., editor. Sand and water culture methods used in the study of plant nutrition. Farnham: Royal Commonwealth Agricultural Bureau; p. 187–191.
- Livak KJ, Schmittgen TD. 2001. Analysis of relative gene expression data using real-time quantitative PCR and the 2−ΔΔCt method. Methods. 25(4):402–408. doi: 10.1006/meth.2001.1262
- Ma Q, Li YX, Yuan HJ, Hu J, Wei L, Bao AK, Wang SM. 2014. ZxSOS1 is essential for long-distance transport and spatial distribution of Na+ and K+ in the xerophyte Zygophyllum xanthoxylum. Plant Soil. 374(1-2):661–676. doi: 10.1007/s11104-013-1891-x
- Nash LJ, Graves WR. 1993. Drought and flood stress effects on plant development and leaf water relations of five taxa of trees native to bottomland habitats. J Am Soc Hortic Sci. 118(6):845–850. doi: 10.21273/JASHS.118.6.845
- Nie WXX, Yu BJL. 2015. A putative soybean GmsSOS1 confers enhanced salt tolerance to transgenic Arabidopsis sos1-1 mutant. Protoplasma. 252(1):127–134. doi: 10.1007/s00709-014-0663-7
- Olías R, Eljakaoui Z, Li J, Alvarez de Morales P, Marín-Manzano MC, Pardo JM, Belver A. 2009. Plasma membrane Na+/H+ antiporter sos1 is essential for salt tolerance in tomato and affects the partitioning of Na+ between plant organs. Plant Cell Environ. 32(7):904–916. doi: 10.1111/j.1365-3040.2009.01971.x
- Qiu QS, Guo Y, Dietric MA, Schumaker KS, Zhu JK. 2002. Regulation of SOS1, a plasma membrane Na+/H+ exchanger in Arabidopsis thaliana, by SOS2 and SOS3. Proc Natl Acad Sci U S A. 99(12):8436–8441. doi: 10.1073/pnas.122224699
- Sang ZY, Ma LY, Chen FJ. 2011. Growth and physiological characteristics of Magnolia wufengensis seedlings under drought stress Acta Bot. Boreali-Occidenalia Sin. 31:109–115.
- Shi HZ, Ishitani M, Kim C, Zhu JK. 2000. The Arabidopsis thaliana salt tolerance gene SOS1 encodes a putative Na+/H+ antiporter. Proc Natl Acad Sci U S A. 97(12):6896–6901. doi: 10.1073/pnas.120170197
- Shi HZ, Lee BH, Wu SJ, Zhu JK. 2003. Overexpressing of a plasma membrane Na+/H+ antiporter gene improves salt tolerance in Arabidopsis thaliana. Nat Biotechnol. 21:81–85. doi: 10.1038/nbt766
- Shi HZ, Quintero FJ, Pardo JM, Zhu JK. 2002. The putative plasma membrane Na+/H+ antiporter SOS1 controls long-distance Na+ transport in plants. Plant Cell. 14(2):465–477. doi: 10.1105/tpc.010371
- Shi SG, Yang M, Zhang M, Wang P, Kang YX, Liu JJ. 2014. Genome-wide transcriptome analysis of genes involved in flavonoid biosynthesis between red and white strains of Magnolia sprengeri pamp. BMC Genom. 15(1):706. doi: 10.1186/1471-2164-15-706
- Song A, Lu J, Jiang J, Chen S, Guan Z, Fang W, Chen F. 2012. Isolation and characterization of Chrysanthemum crassum SOS1, encoding a putative plasma membrane Na+/H+ antiporter. Plant Biol. 14(5):706–713. doi: 10.1111/j.1438-8677.2011.00560.x
- Utsugi J, Inaba K, Kuroda T, Tsuda M, Tsuchiya T. 1998. Cloning and sequencing of a novel Na+/H+ antiporter gene from Pseudomonas aeruginosa. Biochimica et Biophysica Acta (BBA)-Gene Str Exp. 1398(3):330–334. doi: 10.1016/S0167-4781(98)00058-X
- Wang S, Ren Q, Fan G. 2012. Cloning and sequence analysis of a plasma membrane Na+/H+ antiporter gene from Cucumis sativus L. J Shanghai Jiaotong Univ (Agri Sci). 30(3):6–10.
- Wu YX, Ding N, Zhao X, ZhaZ MG, Chang ZQ, Liu JQ, Zhang L. 2007. Molecular characterization of PeSOS1, the putative Na+/H+ antiporter of populus euphratica (sci). Plant Mol Biol. 65(1-2):1. doi: 10.1007/s11103-007-9170-y
- Wu ZF, Hu JJ, Si HW, Tang JR, Sun JS, Hu YP. 1991. An observation on differentiation of Magnolia denudata dess flower buds. China J Chin Mat Med. 2:79–81+126.
- Xu KD, Huang XH, Wu MM, Wanng Y, Chang YX, Liu K, Zhang J, Zhang Y, Zhang FL, Yi LM, et al. 2014. A rapid, highly efficient and economical method of Agrobacterium-mediated in planta transient transformation in living onion epidermis. PLoS One. 9:e83556. doi: 10.1371/journal.pone.0083556
- Xu H, Jiang X, Zhan K, Cheng X, Chen X, Pardo JM, Cui D. 2008. Functional characterization of a wheat plasma membrane Na+/H+ antiporter in yeast. Arch Biochem Biophys. 473(1):0–15. doi: 10.1016/j.abb.2008.02.018
- Xu F, Rudall PJ. 2006. Comparative floral anatomy and ontogeny in Magnoliaceae. Plant Syst Evol. 258(1-2):1–15. doi: 10.1007/s00606-005-0361-1
- Yan Y, Sun S, Xu G, Liu Z. 2007. Cloning and analysis of a Na+/H+ antiporter gene in Helianthus tuberosus L. Acta Bot. Boreal-Occident.Sin. 27(7):1291–1298.
- Yu Q, Shen YM, Wang QY, Wang XL, Fan LJ, Wang YL, Zhang SZ, Liu ZG, Zhang MR. 2019. Light deficiency and waterlogging affect chlorophyll metabolism and photosynthesis in Magnolia sinostellata. Trees. 33(1):11–22. doi: 10.1007/s00468-018-1753-5
- Yue Y, Zhang M, Zhang J, Duan L, Li Z. 2012. SOS1 gene overexpression increased salt tolerance in transgenic tobacco by maintaining a higher k+/Na+ ratio. J Plant Physiol. 169(3):255–261. doi: 10.1016/j.jplph.2011.10.007
- Zeng HQ, Zhang YX, Wang S, Zhang XJ, Wang HZ, Du LQ. 2016. Calcium/calmodulin-mediated signal transduction system in plants. Chinese Bulletin of Botany. 51(5):705–723.
- Zhou P, Zhang M. 2017. Effects of salt stress on ionic distribution of shrub willow. Journal of Central South University of Forestry & Technology. 37(1):7–11 + 26.
- Zhu JK. 2000. Genetic analysis of plant salt tolerance using Arabidopsis. Plant Physiol. 124(3):941–948. doi: 10.1104/pp.124.3.941