
 ?Mathematical formulae have been encoded as MathML and are displayed in this HTML version using MathJax in order to improve their display. Uncheck the box to turn MathJax off. This feature requires Javascript. Click on a formula to zoom.
ABSTRACT
This study investigates differential responses of Aegiceras corniculatum and Kandelia candel mangrove species, using physiological capacitance (CP), photosynthetic, and growth parameters under different salt stress and re-watering conditions. Experiment was conducted at various NaCl levels. The Results indicated that CP was significantly affected in stress phase due to the limitation of salt storage capacity of the vacuole. Although A. corniculatum has a secreting effect, the solute concentration in vacuole was significantly higher than K. candel at M and H treatment, because their volume of vacuole was lower than K. candel species. In the re-watering phase, CP values of both species increased at M-L and H-M treatments respectively. Furthermore, CP was positively correlated with net photosynthesis and stomatal conductance. This finding suggests that the concentration of solute in vacuole is an important factor controlling photosynthesis and growth parameters, and CP can better represent salt concentration in the plant leaf.
1. Introduction
Soil salinity is a serious environmental problem, more than 800 million hectares of land are salt-affected throughout the world (Solangi et al. Citation2019). Soil salinity is a major issue in the agricultural ecosystems, due to the shortage of freshwater and subsequent essential to utilize saline water or low-quality water for irrigation (Semiz and Suarez Citation2015). It would be the most economical approach to improve productivity based on limited water resources. Moreover, the adaptation of salt-tolerant species is the better option to reduce salinity in the soil ecosystem (Hasanuzzaman et al. Citation2014).
Mangrove species grow in intertidal areas of tropical and subtropical zones of coastlines (García-Samaniego et al. Citation2017). Mangroves can survive in stressful conditions such as high salinity, low oxygen, tidal floods influence, and low humidity (Feller et al. Citation2010; Richards and Friess Citation2016). How mangroves survive in intertidal zones with high salinity in stress conditions and maintained their development? Mangroves have the ability to develop various mechanisms in stress conditions with their anatomic or physiological characteristics to regulate salt absorption and barring, e.g. salt secretion, ultrafiltration, and ion sequestration (Liang et al. Citation2008). Based on their special characteristics mangrove species are divided into two categories, true mangrove and associate mangrove (Parida and Jha Citation2010). Aegiceras corniculatum (A. corniculatum) species belong to true mangrove (Parida et al. Citation2004). It has salt glands in its leaves, considered as a salt secretor mangrove. Salt secretion increased at night time, usually in daytime salt is accumulated (Yuan et al. Citation2016). Salt secretion by salt glands is an important strategy, A. corniculatum species secrete the salts from their leaves, to maintain internal ion concentration at the lower level and increase salt tolerance (Parida and Jha Citation2010). Furthermore, a high concentration of salts could reduce the osmatic potential of water, which decreases the ability of plant roots to uptake water. As result, plants reduce the expansion of their growing leaves and close their stomata to reduce the amount of water loss by transpiration (Munns and Tester Citation2008). Moreover, Kandelia candel (K. candel) belongs to true mangrove and a major mangrove species for forestation in coastal areas of southeast China (Wang et al. Citation2014). K. candel known as non-secretor mangroves species, usually one-year-old species is fully covered in sea-water at high tidal conditions (Chen et al. Citation2005). K. candel can survive in field conditions up to 500 mM NaCl range and is considered as a model for studying ecological adaptation and salt tolerance (Hwang and Chen Citation1995). However, many studies focus on mangrove plants using different salt (NaCl) concentrations (Patil et al. Citation2015; García-Samaniego et al. Citation2017). Some species perform well under low salt concentrations, and some have the ability to grow up in moderate to higher concentrations (Parida et al. Citation2004; Zhu et al. Citation2011; Bompy et al. Citation2014).
Usually, salt-tolerant mechanism depends on plant cell and vacuole volume which have the ability to store salts and helps plants regulate their salts through different mechanisms, like salt secretion by A. corniculatum and salt accumulation by K. candel are important strategies against the salt stress-tolerant (Qiu et al. Citation2018). A large amount of salt in the cytoplasm is harmful to both glycophytes and halophytes to overcome the problem of plants either restrict the excess salts in the vacuole or compartmentalize the ions in different tissues to facilitate their metabolic functions (Zhao et al. Citation2020). The net photosynthesis (PN), stomatal conductance (gs), transpiration rate (Tr), and leaf water content (WC) considered as the indirect parameters for determining water status in the plant (Milliron et al. Citation2018). Water regulation due to changes in cell volume is difficult to analyze by the above-mentioned indirect indexes (Xing et al. Citation2018). Electrophysiological parameters have been gradually used for diagnosing plant water status since the variation of plant cell volume and cell sap concentration are closely correlated with electrophysiological indexes such as physiological capacitance (CP) and water potential (Ψ) (Zhang et al. Citation2015; Jócsák et al. Citation2019). As we know that the cell sap is related to CP and Ψ. Therefore, these indices can be determined with a non-destructive custom-made parallel-plate capacitor that employs a given frequency and voltage.
Leaf CP is associated with the effective thickness and area of leaves in contact with capacitor plates. The cytosol solute concentration as well as the elasticity and plasticity of leaf cells are highly responsive to the variable gripping forces (F), which are used for clamping a leaf during the measurement (Zhang et al. Citation2015). The index that is determined using a specific gripping force is an instantaneous value that can only represent an instantaneous water status (Xing et al. Citation2021). The plant cells are composed of protoplasts and cell walls. Vacuoles and cytoplasm, which are the main electrolytic inclusions in the protoplasts, are surrounded by the tonoplast and plasma membrane, respectively. The cytoplasm contains numerous organelles with specific membranes, and the vacuole contains mainly dissolved inorganic ions and organic acids (Zhang et al. Citation2015). Electrical characteristics vary between the organelles, the vacuole and the cytoplasm, which occupy most of the space in cells and can be regarded as resistors, while the plasma membrane has a capacitive characteristic. When the alternating current flow through the plant tissue, the ratio of the passing current between the extracellular and intracellular spaces is influenced by the frequency of the alternating current and tissue features. Therefore, change in leaf water status could be rapidly determined by the variation of physiological capacitance and water potential (Zhang et al. Citation2015). A significant relationship was observed between WC, Ψ and CP (Javed et al. Citation2017).
The results of the study will help to understand the relationship between CP, Ψ, and PN. Moreover, after salt stress, the technique of re-watering phase (RWP) defines dilution of saline water or decreased salt concentration that could be a supportive technique to recover the plant growth and maintained the Ψ and WC. In this study salt stress and RWP are considered as an intertidal environment for mangroves. Javed et al. (Citation2018) studied on Orychophragmus violaceous and found that the best re-watering time is when plants undergo moderate concentration levels and suggested that the RWP technique could be used to maintain the crop productivity. Until now the effects of RWP after salt stress on the secretor and non-secretor mangroves species still unclear. In the view of this scenario, the main objective of the study was: to identify the differential responses of A. corniculatum and K. candel through CP, photosynthetic and growth parameters in salt stress and RWP. Furthermore, the possible mechanism involves in both mangrove species were also investigated.
2. Material and method
The pot experiment was carried out in the greenhouse at Jiangsu University, Zhenjiang, Jiangsu, China (32.20°N, 119.45°E) from 15th May to 15th July 2019. The climate zone of the district is humid and subtropical monsoon with an average annual air temperature of 15.5°C and mean annual precipitation was 1058.8 mm y−1 (Huang et al. Citation2019). One-year-old seedling of two mangrove species A. corniculatum and K. candel were collected from Quanzhou Tongqing mangroves technology Co Ltd, Fujian Province, China. Initially, both species were washed with tap water and kept in 10-liter half-strength nutrients Hoagland solution for one week (Hoagland and Arnon Citation1950).
2.1. Experimental design
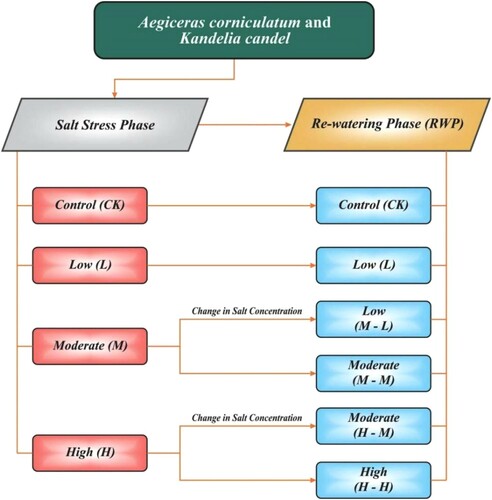
The experiment was conducted in a complete randomized block design with six treatments containing four replicates in each, totally 144 mangrove species were used. Both mangrove species were kept 30 days in the salt stress phase and determine the electrophysiological, photosynthesis and growth parameters. After that, change in salt concentration and mangrove species kept 30 days for re-watering phase (RWP) and obtained the same parameters as the stress phase. Each pot contains 10-liter distilled water with half-strength nutrients Hoagland solution. In salt stress phase, various NaCl concentrations were used as treatments such a; CK:0 mM (control), L:100 mM (low salinity), M:200 mM (moderate salinity), H:400 mM (high salinity) shown in (). In the RWP two treatments were changed in moderate to low salt (M-L:200 into 100 mM) and high to moderate salt (H-M: 400 into 200 mM) other treatments were used the same as the salt stress phase shown in ().
Figure 1. Experiment design of salt stress and RWP.
2.2. Data collection and analysis
The data were recorded at every three days interval under the following parameters: leaf width and height were measured by measuring scale for the estimation of growth rate (GR50). Physiological parameters such as net photosynthesis (PN), leaf stomatal conductance (gs), leaf intercellular CO2 concentration (Ci), and transpiration rate (Tr) were measured on weekly basis at each sampling time and every replicate measured from the top of fully plant young leave, further details of physiological parameters mentioned in Section 2.4. Although, every 15 days interval physiological capacitance (CP) and water potential (Ψ) were also measured, during the all-measurement leaf attached to the plant. After that, the same leaf was harvested for the determination of fresh and dry weight. Similar method was used in re-watering phase for determining all parameters which are discussed above in detail with the same time interval.
2.3. Electrophysiological parameter
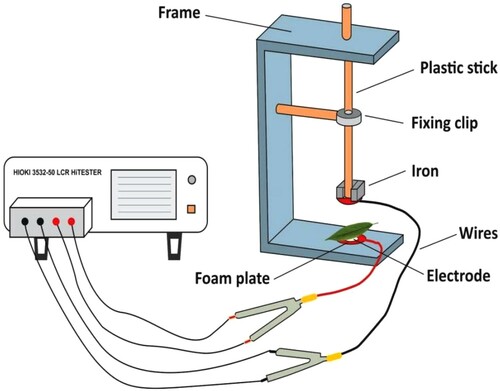
The variation of leaf physiological capacitance (CP) at increasing F was measured using an LCR tester (3532–50, HIOKI, Japan). The voltage and frequency were used 1 V and 3 kHz, respectively (Xing et al. Citation2021). Each leaf was clipped onto the custom-made parallel-plate capacitor with a diameter of 10 mm (). The relationship curve between CP and F was established using Sigma plot (ver. 12.5, Systat Software, Inc., San Jose, Cal.). The relationship between CP and F was fitted, and the model parameters were estimated. Finally, the CP at F = 0 could be calculated (Zhang et al. Citation2020; Xing et al. Citation2021).
Figure 2. Representation of the parallel-plate capacitor attached with LCR tester (3532–50, HIOKI, Japan).
2.4. Photosynthetic traits and water potential
The PN, gs, Ci, and Tr were recorded using a portable LI-6400XT photosynthesis measurement system (LI-COR, Lincoln, NE, USA). The leaf of A. corniculatum and K. candel species were enclosed within the chamber. Five repeated measurements were taken for each parameter, and four plants for each treatment were measured. A fully expanded youngest leaf from the top was used for all these measurements, the experiment was performed during full sunshine from 9.00 am to 11.30 am. (Chen et al. Citation2016). During the data recording process, the set values were used as follows: atmospheric pressure 99.9 kPa, flow rate inside the chamber, 500 (µmol s−1) and photosynthetic active radiation (PAR) 800 (µmol m−2 s−1) using its own red and blue light source. Water use efficiency (WUE) was calculated from this equation WUE = PN/Tr, where PN is the net photosynthetic and Tr is the transpiration rate.
The leaf in salt stress and re-watering phase of both species were used for the determination of Ψ. The leaf Ψ was measured with dew point micro voltmeter in a C-52-SF universal sample room (Psypro, Wescor, USA). Ψ was measured at the same position of the leaves with the above CP testing.
2.5. The growth parameter
Leaf area (cm) was determined with help of the measuring scale and leaf area estimation model according to Xing et al. (Citation2019) as follows:
whereas a, b were model parameters and, X1 was exposed to the maximum leaf width, X2 was exposed to the maximum leaf length in cm; while S was denoted the leaf area in cm2. The growth rate was calculated using a four-parameter logistic equation, the details of the equation are mentioned (Xing et al. Citation2019).
2.6. Statistical analysis
To assess the significant variations between different salt stresses and re-watering stages, all measurements were subjected to analysis of variance (ANOVA) in SPSS software (version 20.0, SPSS Inc) using Duncan’s LSD post hoc test at (p < 0.05). A correlation matrix of the study was based on Pearson’s correlation coefficients using * and ** to indicate the p < 0.05 and p < 0.01 probability levels, respectively. Graphs were prepared by using Origin Pro. 9.0 (Northampton, MA, USA).
3. Results
3.1. Physiological capacitance (CP)
Effect of salt stress and re-watering phase of CP on both species were shown in . The CP values of A. corniculatum were significantly decreased by 41.7%, 53.4%, and 75.1% in salt stress phase of low, moderate, and high salt treatments respectively, compared to the control. While, CP values of K. candel decreased at moderate by 33.3% and high by 70.2%, but in low treatment the CP values increased by 20.3% than control. Furthermore, in re-watering phase, when salt concentration decreased, the CP values of A. corniculatum species increased at moderate to low (M-L) by 23.8% and high to moderate (H-M) by 37.7%, whereas in K. candel species increased at M-L by 22.2%, and H-M by 46.7% compared to stress phase. In re-watering phase K. candel species obtained higher values in L (100 mM) treatment compared to control as shown in .
Table 1. Physiological capacitance of both species in salt stress and RWP (pF × 10−12) (clamping force F = 0).
3.2. Net photosynthesis (PN)
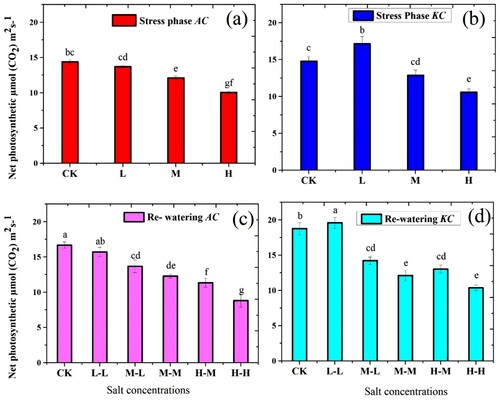
The PN of both species showed a clear significant difference in salt stress and RWP ((a,b)). In higher salt concentration both species show progressive reduction in PN values. Thus, minimum PN values of both species were observed in H treatment. During the stress phase, PN values of A. corniculatum were decreased at L by 4.7%, M by 15.7%, and H by 30.1%, while the PN values of K. candel were decreased at M level by 12.9% and H by 28.9% as compared to control. In addition, PN values of K. candel species were increased in L treatment by 16.1% than control. The PN values of both species in RWP showed a good response ((c,d)). The PN values of A. corniculatum species increased at M-L by 12.8% and H-M by 12.7%, while K. candel species increased at M-L by 10.4% and H-M by 23.1% as compared to stress phase. In both phases, the K. candel species obtained higher values of PN than A. corniculatum species.
Figure 3. Effect of salt stress and RWP of net Photosynthesis (PN) on A. corniculatum (a, c) and K. candel (b, d), the small letter indicates significant difference at (p < 0.05) using Duncan’s multiple range tests.
3.3. Stomatal conductance (gs)
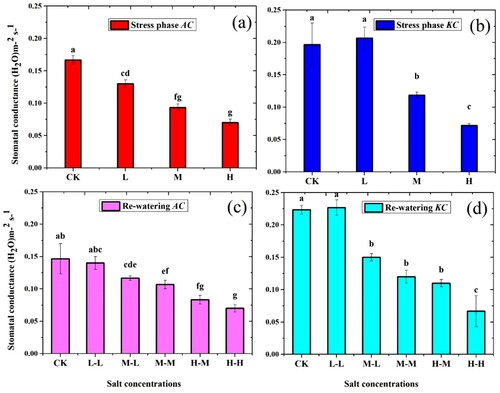
It was observed that stomatal conductance was adversely affected by salt; in both species, the gs values were significantly decreased in stress phase ((a,b)). Lowest gs values of A. corniculatum and K. candel species were noted in H treatment. The gs values of A. corniculatum decreased at L by 22%, M by 44%, and H by 58% as compared to control. While the gs values in K. candel decreased by 39% and 63% at M and H level, respectively. On other hand, gs values increased at L by 4.8% than control of K candel species. Moreover, the values of RWP in A. corniculatum species increased at M-L level by 20% and H-M by 16%, and K. candel increased under M-L by 21.1% and H-M by 34.8%, as compared to stress phase.
Figure 4. Effect of salt stress and RWP of stomatal conductance (gs) on A. corniculatum (a, c) and K. candel (b, d), the small letter indicates significant difference at (p < 0.05) using Duncan’s multiple range tests.
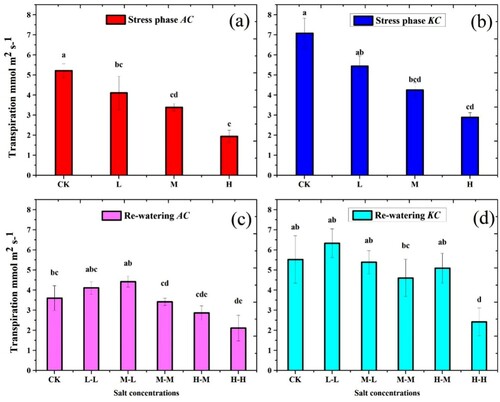
3.4. Transpiration (Tr)
Transpiration of both mangrove species was significantly decreased with increasing the salt concentrations ((a,b)). Minimum Tr values of both species were observed in the H treatment. During the stress phase, A. corniculatum species decreased at L level by 21.2%, M by 35.1% and H by 62.8%, respectively, whereas, K. candel species decreased at L level by 23.1%, M by 39.9% and H by 59.1% compared to control. Subsequently, in the RWP the Tr values of A. corniculatum species increased at M-L by 23.3% and H-M by 32.2%, while values of K. candel species at M-L by 21.1% and H-M by 43.2% as compared to stress phase.
Figure 5. Effect of salt stress and RWP of Transpiration on A. corniculatum species (a, c) and K. candel species (b, d), the small letter indicates significant difference at (p < 0.05) using Duncan’s multiple range tests.
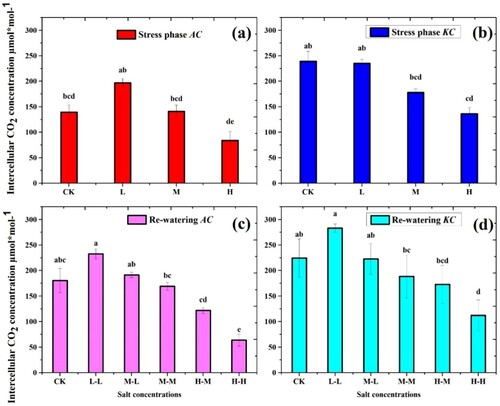
3.5. Intercellular CO2 concentration (Ci)
The results of the intercellular CO2 concentration of both species showed a significant difference in the salt stress phase ((a,b)). Ci of both species was highly decreased in H treatment. The A. corniculatum decreased by 40.1% and K. candel by 43.2% as compared to control. The reduction in Ci could be a limitation of salt storage capacity and stomatal conductance. Furthermore, in the RWP, both species showed a good response ((c,d)). The values of A. corniculatum species at M-L level increased by 26.4% and H-M by 31.3%, whereas K. candel species values increased at M-L by 20.1% and H-M by 21.3% compared to stress phase. In the comparison of both species, K. candel obtained higher values of Ci in both phases.
Figure 6. Effect of salt stress and RWP of Intercellular CO2 on A. corniculatum specie (a, c) and K. candel (b, d), the small letter indicates significant difference at (p < 0.05) using Duncan’s multiple range tests.
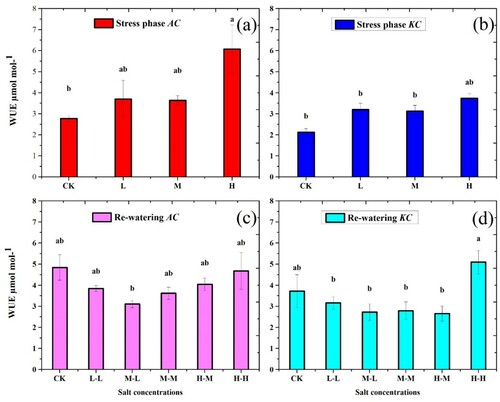
3.6. Water use efficiency (WUE)
The results of WUE indicate that both species showed non-significant (p > 0.05) changes in stress phase. The WUE values of A. corniculatum and K. candel were increased in H treatment by 54.3% and 43.1%, respectively, as compared to control, while the non-significant results were observed in the remaining treatments. Furthermore, a similar trend was observed in RWP of both species ((c,d)).
Figure 7. Effect of salt stress and RWP of water use efficiency on A. corniculatum species (a, c) and K. candel (b, d) the small letter indicates significant difference at (p < 0.05) using Duncan’s multiple range tests.
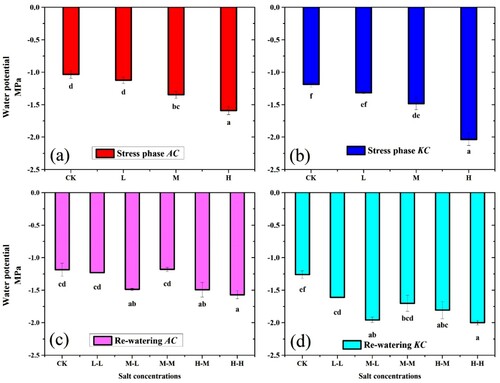
3.7. Water potential (Ψ)
Water potential of both mangrove species showed significant results in salt stress phase ((a,b)). In the stress phase minimum values were observed in H treatment. A. corniculatum species values increased at L by 8.1%, M by 23.3%, and H by 35.1%, whereas K. candel specie increased at L by 9.7%, M by 19.9%, and H by 41.6%, respectively, as compared to control. However, the increment of Ψ indicating that the solute concentration inside the cell could have a threshold value for dysfunction of cells and increased the Ψ of plant. After that in RWP, the Ψ of A. corniculatum species increased at M-L by 25.7% and H-M by 13.8%, while K. candel species increased at M-L by 9.9% and H-M by 16.8%, compared to the stress condition ((c,d)).
Figure 8. Effect of salt stress and RWP of water potential on A. corniculatum (a, c) and K. candel (b, d), the small letter indicates significant difference at (p < 0.05) using Duncan’s multiple range tests.
3.8. Water content (WC)
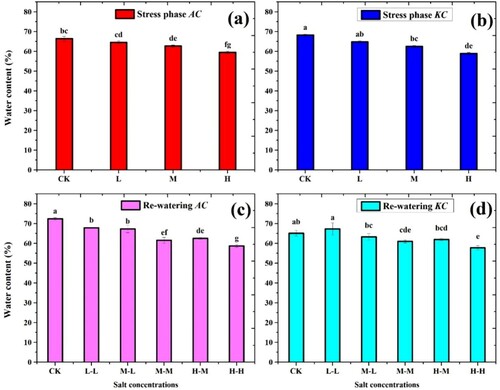
The WC of both mangrove species significantly decreased with increasing the salt concentrations ((a,b)). The WC was highly decreased in H treatment and slightly decreased in L treatment during the stress phase. The WC of A. corniculatum species decreased at L level by 2.8%, M by 5.6%, and H by 10.1% as compared to control. While the values of K. candel specie decreased at L by 4.9%, M by 8.3%, and H by 13.6% than control. During the RWP the A. corniculatum species increased at M-L level by 6.8% and H-M by 4.9% and the values of K. candel increased by M-L by 1.1% and H-M by 4.9% as compared stress phase. ((c,d)).
Figure 9. Effect of salt stress and RWP of water content (%) on A. corniculatum (a, c) and K. candel (b, d), the small letter indicates significant difference at (p < 0.05) using Duncan’s multiple range tests.
3.9. The growth rate under salt stress and re-watering phase (RWP)
The leaf length and width of mangrove species in stress phase and RWP were calculated according to the above-mentioned leaf area model equation (Section 2.5) and growth rate estimated by using the four-parameter logistic equation (). A. corniculatum species, the GR50 × DT log were decreased at L-L by 28.1%, M-L by 78.4%, M-M by 91.5%, H-M 92.4%, and H-H 95.5%, respectively, as compared to control. The results of K. candel species (), the GR50 × DTlog values decreased with increasing the salt concentration, at M-L by 55.9%, M-M by 59.5%, H-M by 63.1%, and H-H by 67.9% correspondingly compared to control. Moreover, it was also noted that the growth rate of K. candel species was increased at L-L by 42.1% than control. The variation in growth rate depends on the species and their different mechanism. In the L treatment, where K. candel species kept higher growth rate at same stage CP and PN values were also higher. These results indicating that in the low salt concentration plant cell maintained their turgor and help to increase their growth, which directly impacts on other related photosynthetic parameters.
Table 2. Estimated leaf area of A. corniculatum species using four-parameter logistic equations under different salt concentrations and subsequent RWP.
Table 3. Estimated leaf area of K. candel species using four-parameter logistic equation under different salt concentrations and subsequent RWP.
3.10. Correlation between CP, PN, gs, and Ψ in salt stress and re-watering phase
The physiological capacitance variables appear to be related to photosynthesis, stomatal conductance, and water potential; bivariate correlations were used to determine the relationships among these parameters (). The result indicating that in stress condition A. corniculatum showed positive correlations between CP and gs (r = 0.975*), while K. candel species showed a positive correlation in CP with PN and gs (0.994** and 0.982*), respectively. When the salt concentration was changed in RWP, it was observed that the values of CP, PN, gs, and Ψ were increased. The correlation analysis shows that the CP with PN (0.846*), PN with gs (0.943**), and PN with Ψ (0.919**) were highly correlated, while, the CP values of K. candel species was highly correlated with PN, gs, and Ψ (r = 0.971**, 0.988**, 0.961**), respectively.
Table 4. Correlation between CP, PN, gs, and Ψ.
4. Discussion
4.1. The differential responses of A. corniculatum and K. candel
4.1.1. Responses in salt stress phase
The current study measures the electrophysiological parameter of true mangroves A. corniculatum and K. candel species. Both species have different mechanisms of salt stress tolerances (Parida and Jha Citation2010). The CP values depend on plant cell and vacuole volume of species. The plant cell wall plays an important role in the determination of salt stress tolerance and plant growth rate (Feng et al. Citation2018). Na+ accumulated in the apoplast may directly bind to cell wall components and affect their chemical properties (Shomer et al. Citation2003). Because detecting the changes in the cell wall composition is challenging, understanding the mechanisms underlying modifications of the cell walls and salt storage capacity upon exposure to high salinity is limited (Zhao et al. Citation2020). The K. candel species had greater salt storage capacity as compare to A. corniculatum species because K. candel species cell and vacuoles volume is bigger, so it could be resisted in higher salt stress conditions. Salt storage capacity depends on the volume of vacuole; it is, therefore, if volume of vacuole is smaller it means salt storage capacity is also smaller like A. corniculatum species showed in . A. corniculatum species have smaller vacuole but have a different mechanism like salt secretion. The cell volume is positively correlated with the volume of vacuole, and the main component of vacuole and cytoplasm is water. The mechanism of vacuolar size is directly associated with plant CP. The dynamic changes in vacuole size rapidly determined from plant CP. In the other words, the water-holding capacity of cells is directly proportional to (Zhang et al. Citation2020). When salt concentration increased, the CP values significantly decreased. In the present study, it was observed that when higher salt entered into the vacuole, ion concentration was increased and CP values significantly decreased. Therefore, in the above-mentioned equation v is equal to the volume of cell and CP is physiological capacitance. The experimental results showed that, if the volume of vacuoles is bigger CP values is larger and the volume of vacuole is smaller CP value also smaller which is shown in . Under the stress phase, at the control level, the CP values of A. corniculatum specie were 36.1, which shows that vacuole volume is smaller, because volume of vacuole depends on solute concentration inside the cell ((a)). Whereas CP values of K. candel species at control level were 59.5, it shows that vacuole was bigger as compared to A. corniculatum specie and solute concentration inside was lower as shown in (b). Accordingly:
Figure 10. Vacuole volume, ion concentration and salt secretion with the variation of salt concentration. A. corniculatum species vacuole volume was smaller than K. candel species also A. corniculatum had secreting effect during the stress condition. Consequently, salt concentration was low inside the vacuoles at low salt stress level and became higher due to smaller vacuole size at high salt stress. While K. candel species vacuoles was bigger, it easily maintained their intracellular ion concentration and growth also increased at low salt stress, but when the salt concentration increased, at that time the solute concentration was also lower due to its bigger vacuole volume in this process. The salt efflux from leaf cells in both A. corniculatum and K. candel decreased the intracellular salt concentration after re-watering.
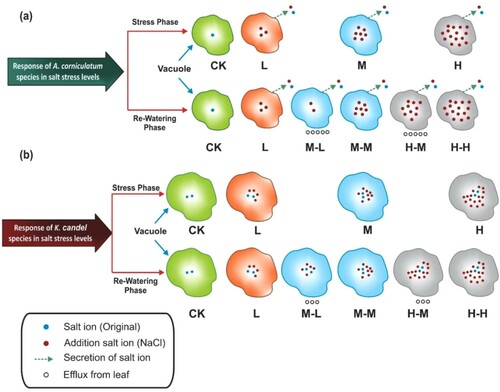
As we know that V1 = cell volume of A. corniculatum and V2 = cell volume of K. candel species, solute concentration is equal to number of salt ion/volume. In , it could be observed that, whether A. corniculatum or K. candel, the solute concentration of vacuole at L level was lowest, and at H level was highest among all treatments. It also indicated that the solute concentration of A. corniculatum specie was larger than K. candel at M and H levels. It means that salt storage capacity of K. candel was larger than A. corniculatum, although K. candel species could not secrete their salt, all salt ion was present in the vacuole. While A. corniculatum at L salt level it could resist the salt stress because their mechanism of salt secretion. The present study is consistent with the previous study reported that after capturing hundreds of three-dimensional microscopic images of secretions and shows that the similar secretion rate throughout the profile but ion concentration increased with increasing the NaCl concentration shown in (Tan et al. Citation2013).
Moreover, at L salt level, the salt secretion of A. corniculatum species and bigger volume of vacuole of K. candel species help them to maintain the same salt concentration and keep photosynthesis. As the salt concentration increased the bigger volume of vacuole in K. candel species is conduct to maintain the lower salt concentration as compared to A. corniculatum species, and it shows better salt storage capacity. K. candel species exhibited better photosynthesis and growth under high salt concentration. Our results are consistent with the previous study reported by Parida et al. (Citation2004) that A. corniculatum species could tolerate up to 250 mM range of NaCl in stress conditions. Whereas under stress phase, the CP values of K. candel species at L level increased by 20.3% than control, it shows that the low salt level was more suitable for K. candel species, and at the same Level K. candel species easily maintained their growth. Similarity was seen in previous work that K. candel gave a better performance on low salinity at 86 mM salt concentration compared to 0 NaCl (Wang et al. Citation2014). The reduction in CP values could cause by increasing the concentration of solute salt in the cytosol (Zhang et al. Citation2015). CP and Ψ are determined simultaneously; both reflect the status of leaf water in plants and their cell volumes. If a large amount of salt (NaCl) present in water, it increases Ψ in the plant roots and diffusion produce in the leaf cell due to turgor loss (Munns and Tester Citation2008). This process reduced the Ψ, cell growth and finally development of whole plant affected were observed ( and ). These findings agreed with previous work (Cristóvão et al. Citation2012). As we know that PN very sensitive parameter in stress conditions, the PN values of A. corniculatum species significantly decreased with increasing the salt concentration, PN highly declines in the H treatment by 30.1% as compared to control. Because at H treatment salt ion is present in large amounts in the vacuole so the plant cannot maintain their turgor, therefore the Ψ decreased and the PN also decreased. While the K candel species PN values at L treatment increased by 16.1% same as the CP values because where CP values were higher PN and gs values were also higher. The PN values more decreased at H level by 28.9% of K. candel species as compared to control. The reduction of PN values was due to the large amount the NaCl present in the water, it increased the osmotic potential hence plants cannot uptake water easily. The reason behind it could be when osmotic stress rapidly closures of stomata, it reduced the plant’s ability to assimilate CO2. As reported by Xu et al. (Citation2014) that the high salinity inhibited photosynthesis by the closing of gs and the reduction of CO2 assimilation, the main cause of salt stress on photosynthetic activity. The CO2 assimilation rate and gs both decreased when increasing the environmental salinity (García-Samaniego et al. Citation2017). Similarities were found in another study of mangroves that the high salt stress inhibited photosynthesis because of closing gs (Shiau et al. Citation2017).
4.1.2. Responses in re-watering phase (RWP)
The present study exposed, both mangrove species had a positive response in RWP, when salt treatments were changed into M-L and H-M treatments. In RWP, the solute concentration of both species M-L < M-M were shown in (). When salt concentration decreased, the lower solute concentrations were observed in the M-L level and CP values also increased as compared to the stress phase. In this study, it was observed that the ratio of salt ion decreased the CP values increased, it indicated that plant is under low salt. Under M-L level, the efflux from leaf of A. corniculatum was higher than that in K. candel, since K. candel had a stronger salt storage capacity, and A. corniculatum keep significantly lower salt concentration in the vacuole, A. corniculatum exhibited a higher growth rate. Under M-M level, although salt secretion happened in A. corniculatum, but the salt concentration in the vacuole was still high due to its small cell volume and the growth of A. corniculatum was significantly inhibited. Furthermore, the CP values of A. corniculatum species increased in M-L by 23.8% and H-M by 37.7%, while K. candel increased at M-L by 22.2% and H-M by 46.7% as compared to the stress phase (). Simultaneously, in RWP the Ψ of A. corniculatum were decreased as compared to stress phase. These results are consistent with previous work done by Azeem et al. (Citation2017) and Javed et al. (Citation2018) that after RWP, a positive response was observed which significantly improve plant growth, when decreased the environmental salinity. The change in Ψ due to the opening and closing of gs, which triggers an imbalance of gaseous exchange (Javed et al. Citation2018). Moreover, in RWP the PN values of A. corniculatum and K. candel species increased at H-M level by 12.7% and 23.1% than the stress phase (). These results constituted with the former study reported that K. candel species can grow up when the salt concentration reached 500 mM NaCl (Parida et al. Citation2004). Results demonstrating that K. candel had more ability to resist the salt stress because the cell and vacuole volume is greater. Furthermore, when salt concentration increased at a level of 250 mM, A. corniculatum species could not maintain their growth but at the same level K. candel species can grow up well.
4.1.3. Response of growth rate
The growth rate of A. corniculatum and K. candel in stress and RWP timely increased and decreased was calculated with the help of a four-parameter logistic equation (). The minimum GR50 × DTlog was observed at H-H treatment, A. corniculatum by 95.5%, and K. candel by 67.9% decreased than control. When solute concentration was higher, the PN values decreased. Meanwhile, PN values were directly proportional to the growth rate. The K. candel species at L-L level, the growth rate increased by 42.1% in the same treatment, the PN also increased by 16.1% and solute concentration was lower than other treatments ((b)). Besides, the growth rate of K. candel specie at M-L, M-M, and H-M levels, the non-significant difference was observed. While A. corniculatum species, growth rate decreased with increasing the salt concentration. A research study reported that carbohydrates were accumulated during the photosynthesis process and play many important roles such as ion absorption and resistance to adversity (Xing et al. Citation2019). Therefore, in stress phase carbohydrates were produced in the photosynthesis period that were used to respiration and produced energy for plant tolerance in salt stress, which decreased the growth. Moreover, during high salt concentrations, the leaf cells lose water, this loss of cell water and turgor is transient. After some hours cell recovered their original volume of water and turgor, despite the cell elongation rates reduced. Apparently, plant leaves smaller and thicker were observed due to reductions in cell elongations, hence the growth rate was reduced. The previous study reported that PN and plant growth rate had a strong relationship (Sudhir and Murthy Citation2004; Tavakkoli et al. Citation2011). In this study, in the H treatment where PN obtained a minimum value at the same treatment growth rate was also lowest. The growth rate also concerns gs, lower gs minimized the leaf thickness and decreased the growth rate (Parida and Jha Citation2010), comparable phenomena were observed in the current study. Furthermore, K. candel had better growth in L treatment as compared to other treatments, the similarity was seen in the previous study by Hwang and Chen (Citation1995). The results of WUE were not clear like other parameters, even in low or high salt concentration results were non-significant, the WUE of A. corniculatum was slightly higher at H treatment, but K. candel species was almost similar even at low or high salt concentrations.
4.1.4. Correlation between CP, PN, gs, and Ψ
In the current study, it was observed that there is no correlation between CP and Ψ in salt stress phase, but it is positively correlated in RWP, which indicates that CP can better represent water status (Zhang et al. Citation2015), while RWP can improve CP and water potential at some time. The PN, and gs values were decreased significantly in the stress phase ( and ), and these parameters had a strong relationship with CP in . Our result supports a previous study by Wang et al. (Citation2018) reported that water potential and gas exchange parameters have a positive relationship and another researcher reported that PN values significantly correlated with gs and Ψ (Xing et al. Citation2018). In RWP, when changed the salt concentration from high to moderate, the A. corniculatum and K. candel species gave a positive response. When the CP values increased at H-M treatment by 49% at the same level PN values also increased by 12.7% of A. corniculatum species, while K. candel species at H-M level increased by 46.7% at the same level PN 23.1% increased than stress phase. These findings support the previous study that after RWP okra cultivars recovered and increased their growth and CP values (Azeem et al. Citation2017).
5. Conclusion
The differential responses of A. corniculatum in stress phase indicating that the CP was significantly decreased with increasing the salt concentrations. While K. candel species at M and H treatments were slightly decreased compared to control, but at L level, the CP values were higher as compared to control. In the low salt concentration K. candel species showed a higher growth rate as compared to A. corniculatum species and low salt level was suitable for K. candel species. Furthermore, K. candel species did not secrete their salt, all salt ions present in the vacuole, so vacuole volume was bigger but solute concentration was lower than A. corniculatum species. Salt storage capacity depends on vacuole volume and vacuole volume directly linked with CP, therefore variation in cell volume could be rapidly determined from CP; A. corniculatum had a smaller vacuole volume but at L level A. corniculatum specie secrete the salt through the mechanism of salt secretion and maintained their growth. In the RWP, when the salt concentration decreased, K. candel species showed a good response especially at H-M treatment as compared to A. corniculatum. According to the growth rate, A. corniculatum and K. candel decreased by 95.5% and 67.9%, respectively, in H-H treatment compared to control. Moreover, in the current study the determination of CP, in which a leaf was placed between two parallel electrode plates, hence this method provided rapid response as compared to traditional methods. It was concluded that both species have a different mechanism of salt tolerant A. corniculatum species by salt secretion and K. candel species by bigger vacuole volume to maintained their growth. The above-mentioned conclusions were obtained only for A. corniculatum and K. candel species, both are true mangrove species but both have a different mechanism of adaptations. Other mangrove species like associate mangrove response in re-watering after salt stress conditions needs to be further investigated.
Acknowledgements
This work was supported by the project of National Key Research and Development Program of China [2016YFC0502602]; National Natural Science Foundation of China [No. U1612441]; Natural Science Foundation of Jiangsu Province [BK20180863]; National Natural Science Foundation of China [31301243]; and Priority Academic Program Development [PAPD] of Jiangsu Higher Education Institutions.
Disclosure statement
No potential conflict of interest was reported by the author(s).
Additional information
Funding
Notes on contributors
Kashif Ali Solangi
Kashif Ali Solangi, He did BE degree in Agricultural Engineering in 2014 from Sindh Agriculture University (SAU) Tandojam Pakistan. He received his ME degree in 2017 from Mehran University of Engineering and Technology, Sindh, Pakistan. He is currently perusing his PhD in Agricultural Engineering at School of Agricultural equipment Engineering Jiangsu University P.R. China. He published 01 research paper as first and 10 as a co-author.
Yanyou Wu
Yanyou Wu, professor (1998) and doctoral supervisor (2003) of Institute of geochemistry, Chinese Academy of Sciences. Doctor of Botany (Sichuan University, 1994), postdoctoral in geology (Institute of geochemistry, Chinese Academy of Sciences,1996). In 2002, he was granted special allowance by the State Council of China. He had been nominated for Guizhou Province core experts and one of high-level innovation plan (“100” level) talents. He has won Youth Science and Technology Award (1997), and Youth Innovative Talent Award (2009) of Guizhou, etc. He completed more than 10 national level projects (funds); published 13 scientific Monographs (11 independent or first responsible persons, 6 by Science Press of China), and more than 280 papers have been published (73 papers indexed by SCI); More than 80 national invention patents have been authorized as first inventor; It has won 10 awards of at provincial and ministerial level.
Qian Chen
Qian Chen, research assistant of Ecology, writes on plant electrophysiology and ecology discourse in the plant salt tolerance. Among her recent publication is “A method for rapid determining plant salt resistance (ZL 201910321783.6)”.
Waqar Ahmed Qureshi
Waqar Ahmed Qureshi, He did BE degree in Agricultural Engineering in 2014 from Sindh Agriculture University (SAU) Tandojam Pakistan. He received his ME degree in 2017 from Mehran University of Engineering and Technology, Sindh, Pakistan. He is currently perusing his PhD in Agricultural Engineering at School of Agricultural equipment Engineering Jiangsu University P.R. China. He published 06 research paper as co-author.
Deke Xing
Deke Xing, associate professor of Agricultural Engineering, writes on plant electrophysiology and ecology discourse in the water-saving irrigation. Among his recent papers are “Leaf physiological impedance and elasticity modulus in Orychophragmus violaceus seedlings subjected to repeated osmotic stress (Scientia Horticulturae 2021)” and “Leaf stiffness of two Moraceae species based on leaf tensity determined by compressing different external gripping forces under dehydration stress” (Journal of Plant Interactions 2019).
Mazhar Hussain Tunio
Mazhar Hussain Tunio, is working as lecturer in department of Soil and water Resources Engineering, Sindh Agriculture University (SAU) Tandojam Pakistan. He did BE degree in Agricultural Engineering in 2013. He received his ME degree in department of Department of Irrigation and Drainage from above University in 2016. He is currently perusing his PhD in Agricultural Engineering at School of Agricultural equipment Engineering Jiangsu University P.R. China. He published 07 research paper as first and 6 as a co-author.
Sher Ali Shaikh
Sher Ali Shaikh, is working as lecturer in department of Farm Power and Machinery, Sindh Agriculture University (SAU) Tandojam Pakistan. He did BE degree in Agricultural Engineering in 2013. He received his ME degree in department of Farm Power and Machinery from above University in 2016. He is currently perusing his PhD in Agricultural Engineering at School of Agricultural equipment Engineering Jiangsu University P.R. China. He published 02 research paper as first and 8 as a co-author.
References
- Azeem A, Wu Y, Javed Q, Xing D, Ullah I, Kumi F. 2017. Resposta do okra com base em modelagem eletrofisiológica sob stress de sal e re-watering. Biosci J. 33(5):1219–1229.
- Bompy F, Lequeue G, Imbert D, Dulormne M. 2014. Increasing fluctuations of soil salinity affect seedling growth performances and physiology in three neotropical mangrove species. Plant Soil. 380(1):399–413.
- Chen D, Wang S, Cao B, Cao D, Leng G, Li H, Yin L, Shan L, Deng X. 2016. Genotypic variation in growth and physiological response to drought stress and re-watering reveals the critical role of recovery in drought adaptation in maize seedlings. Front Plant Sci. 6:1–15.
- Chen L, Wang W, Lin P. 2005. Photosynthetic and physiological responses of Kandelia candel L. Druce seedlings to duration of tidal immersion in artificial seawater. Environ Exp Bot. 54(3):256–266.
- Cristóvão R, Botelho C, Martins R, Boaventura R. 2012. Pollution prevention and wastewater treatment in fish canning industries of Northern Portugal. Int Proc Chem Biol Environ Eng. 32(1):12–16.
- Feller IC, Lovelock CE, Berger U, McKee KL, Joye SB, Ball MC. 2010. Biocomplexity in mangrove ecosystems. Ann Rev Mar Sci. 2(1):395–417.
- Feng W, Kita D, Peaucelle A, Cartwright HN, Doan V, Duan Q, Liu MC, Maman J, Steinhorst L, Schmitz-Thom I, Yvon R. 2018. The FERONIA receptor kinase maintains cell-wall integrity during salt stress through Ca2+ signaling. Curr Biol. 28(5):666–675.
- García-Samaniego J, Dalmolin ÂC, França MGC, Mangabeira PAO. 2017. Different salt concentrations induce alterations both in photosynthetic parameters and salt gland activity in leaves of the mangrove Avicennia schaueriana. Ecotoxicol Environ Saf. 141:70–74.
- Hasanuzzaman M, Nahar K, Alam MM, Bhowmik PC, Hossain MA, Rahman MM, Prasad MNV, Ozturk M, Fujita M. 2014. Potential use of halophytes to remediate saline soils. Biomed Res Int. 8:1–12.
- Hoagland DR, Arnon DI. 1950. The water-culture method for growing plants without soil. Cal Agric Exp St Circ. 347:29–31.
- Huang S, Yan H, Zhang C, Wang G, Joe S. 2019. Modeling evapotranspiration for cucumber plants based on the Shuttleworth-Wallace model in a Venlo-type greenhouse. Agric Water Manag. 228:105861.
- Hwang YH, Chen SC. 1995. Anatomical responses in Kandelia candel (L.) Druce seedlings growing in the presence of different concentrations of NaCl. Bot Bull Acad Sin. 36:181–188. http://ejournal.sinica.edu.tw/bbas/content/1995/3/bot363-06.html.
- Javed Q, Wu Y, Azeem A, Ullah I. 2017. Evaluation of irrigation effects using diluted salted water based on electrophysiological properties of plants. J Plant Interact. 12(1):219–227.
- Javed Q, Wu Y, Xing D, Ullah I, Azeem A, Rasool G. 2018. Salt-induced effects on growth and photosynthetic traits of Orychophragmus violaceus and its restoration through re-watering. Rev Bras Bot. 41(1):29–41.
- Jócsák I, Végvári G, Vozáry E. 2019. Electrical impedance measurement on plants: a review with some insights to other fields. Theor Exp Plant Physiol. 31(3):359–375.
- Liang S, Zhou RC, Dong SS, Shi SH. 2008. Adaptation to salinity in mangroves: implication on the evolution of salt-tolerance. Chinese Sci Bull. 53(11):1708–1715.
- Milliron LK, Olivos A, Saa S, Sanden BL, Shackel KA. 2018. Dormant stem water potential responds to laboratory manipulation of hydration as well as contrasting rainfall field conditions in deciduous tree crops. Biosyst Eng. 165:2–9.
- Munns R, Tester M. 2008. Mechanisms of salinity tolerance. Annu Rev Plant Biol. 59:651–681.
- Parida AK, Das AB, Mittra B. 2004. Effects of salt on growth, ion accumulation, photosynthesis and leaf anatomy of the mangrove, Bruguiera parviflora. Trees - Struct Funct. 18(2):167–174.
- Parida AK, Das AB, Sanada Y, Mohanty P. 2004. Effects of salinity on biochemical components of the mangrove, Aegiceras corniculatum. Aquat Bot. 80(2):77–87.
- Parida AK, Jha B. 2010. Salt tolerance mechanisms in mangroves: a review. Trees - Struct Funct. 24(2):199–217.
- Patil V, Singh A, Naik N, Unnikrishnan S. 2015. Estimation of mangrove carbon stocks by applying remote sensing and GIS techniques. Wetlands. 35(4):695–707.
- Qiu DL, Lin P, Su JW. 2018. Relationship of leaf ultrastructure of mangrove Kandelia candel (L.) Druce to salt tolerance. J For Sci. 51(10):476–480.
- Richards DR, Friess DA. 2016. Rates and drivers of mangrove deforestation in Southeast Asia, 2000-2012. Proc Natl Acad Sci USA. 113(2):344–349.
- Semiz GD, Suarez DL. 2015. Tomato salt tolerance: impact of grafting and water composition on yield and ion relations. Turkish J Agric For. 39(6):876–886.
- Shiau Y, Lee S, Chen T, Tian G, Chiu C. 2017. Water salinity effects on growth and nitrogen assimilation rate of mangrove (Kandelia candel) seedlings. Aquat Bot. 137:50–55.
- Shomer I, Novacky AJ, Pike SM, Yermiyahu U, Kinraide TB. 2003. Electrical potentials of plant cell walls in response to the ionic environment. Plant Physiol. 133(1):411–422.
- Solangi KA, Siyal AA, Wu Y, Abbasi B, Solangi F, Lakhiar IA, Zhou G. 2019. An assessment of the spatial and temporal distribution of soil salinity in combination with field and satellite data: a case study in Sujawal district. Agronomy. 9(12):869.
- Sudhir P, Murthy SDS. 2004. Effects of salt stress on basic processes of photosynthesis. Photosynthetica. 42(4):481–486.
- Tan WK, Lin Q, Lim TM, Kumar P, Loh CS. 2013. Dynamic secretion changes in the salt glands of the mangrove tree species Avicennia officinalis in response to a changing saline environment. Plant Cell Environ. 36(8):1410–1422.
- Tavakkoli E, Fatehi F, Coventry S, Rengasamy P, McDonald GK. 2011. Additive effects of Na+ and Cl- ions on barley growth under salinity stress. J Exp Bot. 62(6):2189–2203.
- Wang Z, Li G, Sun H, Ma L, Guo Y, Zhao Z, Gao H, Mei L. 2018. Effects of drought stress on photosynthesis and photosynthetic electron transport chain in young apple tree leaves. Biol Open. 7(11):1–9.
- Wang HM, Xiao XR, Yang MY, Gao ZL, Zang J, Fu XM, Chen YH. 2014. Effects of salt stress on antioxidant defense system in the root of Kandelia candel. Bot Stud. 55(1):1–7.
- Xing D, Chen X, Wu Y, Xu X, Chen Q, Li L, Zhang C. 2019. Rapid prediction of the re-watering time point of Orychophragmus violaceus L. based on the online monitoring of electrophysiological indexes. Sci Hortic. 256:108642.
- Xing D, Chen L, Wu Y, Zwiazek JJ. 2021. Leaf physiological impedance and elasticity modulus in Orychophragmus violaceus seedlings subjected to repeated osmotic stress. Sci Hortic. 276:109763.
- Xing D, Xu X, Wu Y, Liu Y, Wu Y, Ni J, Azeem A. 2018. Leaf tensity: A method for rapid determination of water requirement information in Brassica napus L. J Plant Interact. 13(1):380–387.
- Xu HM, Tam NFY, Zan QJ, Bai M, Shin PKS, Vrijmoed LLP, Cheung SG, Liao WB. 2014. Effects of salinity on anatomical features and physiology of a semi-mangrove plant Myoporum bontioides. Mar Pollut Bull. 85(2):738–746.
- Yuan F, Leng B, Wang B. 2016. Progress in studying salt secretion from the salt glands in recretohalophytes: How do plants secrete salt? Front Plant Sci. 7:1–12.
- Zhang C, Hicks GR, Raikhel NV. 2015. Molecular composition of plant vacuoles: important but less understood regulations and roles of tonoplast lipids. Plants. 4(2):320–333.
- Zhang C, Wu Y, Su Y, Xing D, Dai Y, Wu Y, Fang L. 2020. A plant’s electrical parameters indicate its physiological state: a study of intracellular water metabolism. Plants. 9(10):1–16.
- Zhang M, Wu Y, Xing D, Zhao K, Yu R. 2015. Rapid measurement of drought resistance in plants based on electrophysiological properties. Trans ASABE. 58(6):1441–1446.
- Zhao C, Zhang H, Song C, Zhu JK, Shabala S. 2020. Mechanisms of plant responses and adaptation to soil salinity. Innov. 1(1):100017.
- Zhu Z, Zhang R, Liu T, Zheng H. 2011. Solute accumulation and osmotic adjustment characteristics of the mangrove Avicennia marina under NaCl-induced salinity stress. Bot Mar. 54(3):335–341.