
ABSTRACT
Aspergillus flavus is an opportunistic fungal pathogen that produces carcinogenic aflatoxin, a serious constraint for food safety and human health. In this study, to better understand the molecular mechanism/s of peanut resistance to A. flavus growth and aflatoxin accumulation, comparative proteomic analysis was performed in two contrasting peanut genotypes, variety JL 24 (susceptible) and its near-isogenic resistant transgenic derivative expressing an alfalfa defensin gene. Several resistance proteins associated with secondary metabolic pathways were strongly induced in the resistant genotypes including phenylalanine ammonia lyase, cinnamic acid-4-hydroxylase, chalcone synthase, resveratrol synthase, flavanone-3-hydroxylase, lipoxygenase, diacylglycerol-glycerol-3-phosphate-3-phosphatidyltransferase, β-ketoacyl-ACP-reductase, monoacylglycerol acyltransferase, and diacylglycerol acyltransferase, indicating their roles in resistance. Besides, several putative susceptibility-associated proteins were revealed providing knowledge on potential candidate target genes for precise breeding interventions for aflatoxin mitigation. This is the first study to demonstrate comparative proteomics analysis in Aspergillus–peanut interaction using contrasting near-isogenic lines to elucidate the underlying molecular mechanisms of resistance.
1. Introduction
Peanut (Arachis hypogaea L.) is an important grain legume and nutritious food ingredient, being the third most important source of vegetable protein and oil that plays a significant economic role in small-scale farming systems (Variath and Janila Citation2017). However, predominantly grown as a rainfed crop, it is often exposed to end-of-season dry spells during harvest, thereby aggravating Aspergillus flavus infection resulting in pre- and post-harvest aflatoxin contamination, diminishing the crop quality (Klich Citation2007). Aflatoxins not only pose a threat as a carcinogen and hepatotoxin to the health of humans and livestock (Bryden Citation2012; Sharma et al. Citation2018), but also lead to considerable economic losses due to international trade restrictions (Bandyopadhyay and Cotty Citation2013). Besides, due to the lack of sustainable resistance sources in the available peanut germplasm, there is an urgent need to deploy genetic solutions for durable resistance to the fungal infection and aflatoxin contamination in elite peanut cultivars. However, this can only be accomplished following an in-depth understanding of the mechanisms of resistance.
Qualitative or quantitative resistance to A. flavus infection may be governed by either a single or several genes (Chen et al. Citation2010; Nigam et al. Citation2009; Pandey et al. Citation2014) and numerous efforts have been made to develop aflatoxin-free peanut lines through breeding (Pandey et al. Citation2019). The identification of quantitative trait loci (QTL) reported for aflatoxin resistance in peanut showed 8–21% phenotypic variance (Pandey et al. Citation2014; Yu et al. Citation2019). Nevertheless, no remarkable success in developing durable resistance has been achieved so far through breeding due to the non-availability of highly resistant germplasm (Nigam et al. Citation2009). Limited success has been achieved through host–plant resistance strategies using transgenics that overexpressed anti-fungal peptides/proteins such as chitinases, β-1,3-glucanase, protease inhibitors, thionins, lectins and polygalacturonase inhibitor proteins (Bhatnagar-Mathur et al. Citation2015; Cary et al. Citation2011). Our previous research demonstrated that overexpression of defensins and host-induced gene silencing (HIGS) of aflatoxin biosynthetic pathway genes has a potential to provide heritable resistance, thereby offering opportunities for achieving durable quantitative resistance to fungal infection and reduction in aflatoxin contamination using a two-pronged strategic interventions (Arias et al. Citation2015; Sharma et al. Citation2018).
Technological advances in ‘omics’ have been explored to identify and characterize resistance-associated proteins and genes for aflatoxin contamination (Wang et al. Citation2013; Zhao et al. Citation2019). While transcriptomic studies related to A. parasiticus infection under drought conditions have revealed a number of genes potentially associated with drought tolerance and A. parasiticus interactions, these do not offer comprehensive insights and their role in pre-harvest infection of peanut is still not well understood (Luo et al. Citation2005; Nayak et al. Citation2017). Hence, it is pivotal to understand the Aspergillus–peanut pathosystem and underlying molecular mechanisms for better insights on the genes and pathways that play a critical role in host–pathogen interaction as well as the resulting aflatoxin production.
Proteomics is a powerful tool to gain insights on the dynamics of proteins expressed by genomes under different environmental stresses and biological processes (Graves and Haystead Citation2002; Jamshidi Goharrizi et al. Citation2019, Citation2020). Linking proteome analyses with genomic information is essential to define the function of the genes associated with any trait. Proteomics approaches have been previously used to study several molecular events underlying the development of peanut seed (Kang et al. Citation2007), gynophore (Zhao et al. Citation2015), leaf (Katam et al. Citation2010), allergens (Porterfield et al. Citation2009) and drought tolerance (Kottapalli et al. Citation2013). Efforts have also been made to investigate the seed proteins associated with aflatoxin contamination in a few resistant peanut genotypes (Wang et al. Citation2010, Citation2012; Zhao et al. Citation2019), thereby revealing some differentially expressed proteins (DEPs) associated with peanut pre-harvest aflatoxin contamination. Non-target proteomics, based on 2D gel electrophoresis combined with LC-MS/MS, has been earlier used to explain the resistance mechanism against A. flavus (Ouakhssase et al. Citation2019). Moreover, diverse mechanisms of resistance such as oxidative stress response, induction of PR proteins and activation of secondary metabolic pathways have been revealed using proteomic approaches (Balotf et al. Citation2021; Elmore et al. Citation2021). However, most of these comparative host–pathogen proteome responses were carried out using genotypically diverse backgrounds posing bottlenecks with respect to pinpointing the role of candidate genes underlying resistance (Chen et al. Citation2009).
Our previous studies have demonstrated a successful host–plant resistance strategy to create peanut germplasm with improved genetic resistance to A. flavus infection and aflatoxin contamination (Sharma et al. Citation2018). Considering that the transgenic events overexpressing MtDef genes were nearly isogenic to the wild-type parent JL 24, except for a single gene insert offered opportunities to deep dive into the molecular basis of resistance to fungal infection and aflatoxin production in Aspergillus–peanut pathosystem without any background noise (Chen et al. Citation2009). To better understand the molecular mechanisms underlying resistance/susceptibility to A. flavus infection and resulting aflatoxin contamination, we used non-target proteomics based on liquid chromatography hybrid mass spectrometry (LC-MS/MS) of two contrasting peanut lines (resistant transgenic and susceptible wild-type (WT) control lines) under pathogen inoculated and un-inoculated conditions. The results provide significant insights that enable both genotypic and time point comparisons of post-harvest A. flavus–peanut pathosystem and decipher mechanisms that confer resistance in transgenic peanut lines overexpressing the defensin transgenes (Sharma et al. Citation2018).
2. Methods
2.1. Plant material
Transgenic OE-Def lines expressing Medicago truncatula defensin gene MtDef4.2 (Def4Ec 97-1-8) developed in the background of peanut cultivar JL 24 was used as a resistant genotype for this study owing to a consistently lower aflatoxin accumulation (<4 ppb) compared to the untransformed wild-type parent (WT-JL 24) in a series of fungal bioassays as described earlier (Sharma et al. Citation2018). The T4 generation transgenic plants and WT controls were grown to maturity in a biosafe glasshouse using standard agronomic practices to obtain mature seeds for use in all the experiments. The heritability and expression of the transgenes was confirmed by PCR and RT–PCR as previously described (Sharma et al. Citation2018).
2.2. Aspergillus flavus growth conditions
Aspergillus flavus strain AF 11–4 obtained from the groundnut pathology collections at ICRISAT, India (Mehan et al. Citation1995), was used for fungal bioassays. Fungal mycelia were cultivated on potato dextrose agar (PDA) medium at 28°C until they showed sporulation. Virulent spores were collected in sterile distilled water containing 0.05% Tween 20 and diluted to a concentration of 5 × 10⁴ spores/mL using a Neubauer haemocytometer, and the colony-forming units (CFUs) determined by standard 10-fold dilutions to obtain ∼40,000 cfu/mL on A. flavus parasiticus agar (AFPA) medium.
2.3. Fungal bioassays and aflatoxin analysis
Peanut seeds were screened for infection and aflatoxin resistance and susceptible as previously described (Arias et al. Citation2015) with minor modifications. Matured seeds from the resistant OE-Def line (Def4Ec 97-1-8) and susceptible WT parent (JL 24) were surface sterilized with 0.1% (w/v) mercuric chloride for 3 min, followed by two to three times washes with sterile distilled water and soaked in sterile distilled water for 2 h. Subsequently, the seed coats were removed to eliminate the potential barrier to A. flavus growth and cotyledons were cut into two vertical halves. Embryonated half was used for generation advancement and the other cotyledon was further halved and placed in Petri dishes containing sterile agar (1.7% agar/water; w/v; 12 vertically cut cotyledons (¼) per plate), with cut surface exposed. Each piece was infected with 2 µl of A. flavus spore suspension containing 5 × 10⁴ spores/mL and incubated under aeration at 30 °C in dark. Inoculated and un-inoculated samples were collected at 24, 40, 56, and 72 h post-inoculation (hpi) for all the experiments. All samples were immediately frozen in liquid nitrogen and stored at −80 °C until use.
For aflatoxins quantitation, the tissue samples collected at 72 hpi were subjected to ELISA assays. For this, 100 mg of cotyledon sample was extracted overnight in 0.5 mL methanol (70% methanol + 0.5% KCl). Sample extracts were diluted 1:10 in PBST-BSA for quantitative ELISA using the standard protocol (Kumar et al. Citation2017).
2.4. Fungal load detection
Fungal genomic DNA was isolated using 100 mg of mycelium from A. flavus cultures using PureLink Plant Total DNA Purification kit (Invitrogen, Carlsbad, CA, USA). The purified DNA was evaluated in 0.8% (w/v) agarose gel followed by quantitative and qualitative determination using Qubit Fluorometer 2.0 and spectrophotometer (GE Healthcare, NJ, USA), respectively, and stored at −20°C until use.
Aspergillus flavus biomass in the infected samples of WT control and OE-Def lines was quantified based on quantitative PCR (qPCR). Fungal gene, FLAV-specific primers (Sardiñas et al. Citation2011) was used to amplify A. flavus ITS2 region using qPCR, according to the manufacturer’s instructions. Aspergillus flavus DNA ranging from 10 ng to 0.01 pg was used to prepare the standard curve. The logarithm of starting quantity of template for each dilution was plotted against the cycle threshold values (Ct) to obtain the standard curve. Amplification efficiencies were calculated from the slopes of the standard curves.
2.5. Gene expression studies
Total RNA was extracted from the pulverized frozen cotyledons collected at 0 and 40 hpi using the RNeasy Plant Mini kit (Qiagen, Tokyo, Japan), and quantified with Nanodrop ND 1000 Spectrophotometer (Nanodrop, Wilmington, DE, USA) followed by DNase treatment using the DNase Kit (Fermentas, Hanover, MD, USA) as per the manufacturer's instructions. A 2.0 μg aliquot of purified RNA was used for cDNA synthesis following the recommended protocol (Thermoscript RT–PCR system, Invitrogen, Carlsbad, CA, USA). Quantitative PCR was carried out with gene-specific primers (Table S1) in a Realplex Real Time PCR system (Eppendorf, UAS). The peanut ADH 3 (EG529529) and G6Pd (EG030635) genes were used as housekeeping genes for normalization of cycle threshold (Ct) values (Reddy et al. Citation2013). qRT–PCR reaction conditions were set in triplicates as: 2 min at 95°C, 40 cycles of 10 s at 95°C, 20 s at 60 °C followed by fluorescence measurement at each 0.5°C variation from 60°C to 95°C in 20 min was included to obtain the melting curve. Relative fold expression was calculated by 2-ΔΔCt method (Livak and Schmittgen Citation2001).
2.6. Protein extraction and digestion
Total proteins were extracted following an earlier reported protocol (Kottapalli et al. Citation2013). Briefly, three replicates of 0.2 g of frozen cotyledons were homogenized and suspended in 1 mL of extraction buffer containing 0.9 M sucrose, 0.1 M Tris (pH 8.8), 10 mM EDTA, 50 mM dithiothreitol (DTT), 1 mM phenyl methyl sulfonyl fluoride (PMSF), and 25 μL of protease inhibitor cocktail (Sigma-Aldrich, St Louis, MO, USA). An equal volume of Tris-saturated phenol was added and mixed thoroughly by shaking for 30 min at 4 °C followed by centrifugation (5000 g, 4°C) for 20 min. The upper phenolic phase was collected and re-extracted twice as described above. The proteins in the phenolic phase were precipitated by centrifugation (5000 g for 30 min at 4°C) by adding 5 volumes of 0.1 M ammonium acetate containing 10 mM DTT. The protein pellet was washed twice with methanol containing 10 mM DTT followed by another wash with acetone containing 10 mM DTT. The pellet was either dissolved in rehydration buffer (8 M Urea, 4% CHAPS (w/v), 40 mM Tris-base) or stored at −80°C until further use. The protein yield was quantified and normalized for equal concentrations by polyacrylamide gel electrophoresis (PAGE).
2.7. In-gel digestion
In-gel digestion was carried out and peptides were extracted based previously reported protocol (Kilambi et al. Citation2016). Briefly, 100 μg of proteins dissolved in rehydration buffer (8 M Urea, 4% CHAPS (w/v), 40 mM Tris-base) and then separated on 12% SDS–PAGE as per standard protocol (He Citation2011). After completing de-staining, each gel lane was cut into 36 slices, and 12 slices were pooled in a single fraction (total 3 fractions were obtained). The proteins in each slice were prepared for mass spectrometry by reduction and alkylation using 10 mM DTT for 30 min and 50 mM iodoacetamide for 45 min, respectively, followed by overnight trypsin digestion using sequencing grade porcine trypsin (Promega, USA) in 1:25 of enzyme: protein ratio at 37°C (Parankusam et al. Citation2017). Peptides from each fraction were separately extracted by addition of 60% (v/v) acetonitrile (ACN) containing 0.1% (v/v) formic acid and sonicated in ice for 30 min. This step was repeated thrice, and peptides obtained from each extraction step were pooled. The pooled peptides for each fraction were then concentrated using a speed vacuum concentrator (Thermo Scientific, USA), and desalted using C18 spin columns (Thermo Scientific, USA). These samples were either subjected to proteomics analysis immediately or stored at −80 °C.
2.8. Mass spectrometry and data acquisition
The trypsin digests were reconstituted in 50 µl of 0.1% formic acid followed by separation on the Acquity BEH C18 UPLC column (75 µm × 150 cm × 1.7µm; Waters, UK) connected to UPLC system for 90 min using LC-MS grade water in 0.1% formic acid (v/v; mobile phase A) and acetonitrile in 0.1% formic acid (mobile phase B). The mobile phase B was linearly ramped from 53 to 85% over 90 min. The initial flow rate was 5 μL/min of 97% mobile phase A for 3 min, while the flow rate was maintained at 200 µL/min for the remaining period. The column temperature was kept at 60°C. The UPLC separated peptides were analyzed for MS and MS/MS fragmentation on Xevo-G2-XS (Waters, Milford, MA, USA) with ESI source on a positive mode. Data were acquired in resolution mode using the following settings (Collision Energy: 1. Low Energy: Trap: 4 V, Transfer: 4 V; 2. High Energy: Trap Collision Energy Ramp: 15–40 V; Transfer Collision Energy Ramp: OFF; Cone Voltage: 40 V) (Parankusam et al. Citation2017). The scan time was set to 0.5 s in continuum mode and the set mass range was 50–2000 Da in TOF. The Leucine encephalin (Sigma-Aldrich, USA) at 200 pg/μL was used as an external calibrant and lock mass acquisition was performed every 30 s. Mass spectra of the samples were acquired by MassLynx v4.0 software (Waters, Milford, MA, USA) and further submitted for protein identification and expression.
2.9. Data analysis and bioinformatics
Proteins were identified and quantified from raw spectra by Progenesis QI for Proteomics Software V.4.0 (Nonlinear Dynamics, Newcastle, UK). Progenesis aligned the imported MS scans based on retention time and processed them to generate peak lists containing m/z and abundance for each replicate. To increase sensitivity for peak detection, parameters were set to 5 and captured proteins with charge higher than 5, fall in detection range 100–1600 m/z and between 5 and 80 min. Triplicate MS scans were grouped according to the treatment followed by normalization and comparison of abundance data before statistical evaluation. However, conflicting peptides assigned to more than one protein were excluded from quantification. Protein identifications were performed using an inbuilt ion accounting algorithm of Progenesis against the peanut proteome downloaded from UniProt (http://www.uniprot.org/). The following parameters were set for searches against target database: tryptic cleavage with a maximum of two missed cleavages; maximum mass errors of 20 ppm; minimum fragment ion per peptide equal to two, minimum fragment ion per protein equal to five, minimum peptide per protein equal to two; a minimum of two unique peptides matching the protein; carbamidomethylation of Cys was considered as fixed modifications and oxidation of Met and Gln-Pyro-Glu (N-term Gln) as variable modifications. The false discovery rate (FDR) for the statistically significant proteins was found to be 5% (Benjamini and Hochberg Citation1995). Quantitative analysis was performed based on the ratio of protein ion counts among contrasting samples or treatments. The resulting dataset was further filtered for proteins quantified based on at least two unique peptides and considered up- or down-regulated only if the fold change was 1.5 with significant P-value ANOVA (P ≤ .05). Protein subcellular localization was predicted for significant proteins using Plant-mPLoc (Chou and Shen Citation2010). The mass spectrometry proteomics data have been deposited to the ProteomeXchange consortium via jPOSTrepo (Okuda et al. Citation2017) with the database identifier PXD027315.
2.10. Functional annotation and pathway mapping
The unique and DEPs were classified into Gene Ontology (GO) categories using MapMan application (http://mapman.gabipd.org) (Lohse et al. Citation2014). GO assignments are helpful to classify the functions of the identified proteins. To understand the potential involvement of these predicted proteins in biological pathways, the proteins were mapped to the reference canonical pathways using Arachis genus as reference in KEGG automated annotation server KAAS (http://www.genome.jp/kaas-bin/kaas main). To identify the similar expression patterns of A. flavus-responsive proteins, a hierarchical clustering of 50 common A. flavus-responsive proteins that had at least 1.5-fold variation were clustered using MeV software (Version 4.8, USA) based on the Euclidean distance method.
2.11. Statistical analysis
The data were analyzed using Sigmaplot (ver.11) based on the mean and standard error (SE) values in all assays including in vitro seed colonization experiments. Statistically significant differences between treatments were determined by one-way ANOVA using Student’s t-test method. The statistical analysis was carried out with at least three biological replicates. By analyzing protein abundance values, only statistically significant results were considered (P ≤ .05), and DEPs with a ratio of at least 1.5 in absolute value observed in at least two biological replicates were used for data analyses.
3. Results
3.1. Confirmation of transgenic resistance to A. flavus infection and aflatoxin
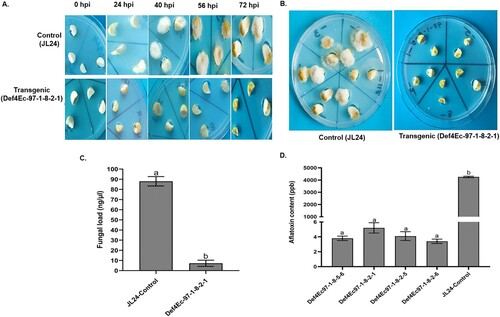
The cotyledons of T4 progenies of peanut transgenic OE-Def lines were reconfirmed for transgene heritability and evaluated for fungal resistance using in vitro seed colonization assays using A. flavus strain AF 11–4 ((A,B)). Based on visual scoring, the transgenic lines showed less than 20% mycelial coverage of kernels after 72 hpi, compared to WT controls that showed over 85% coverage. Furthermore, fungal biomass was measured as fungal load from the inoculated cotyledons of OE-Def and WT controls using qPCR analyses. On an average, 7.22 ng/µL of A. flavus-specific DNA was detected from OE-Def events, compared to 88.02 ng/µL in the WT control lines at 72 hpi, respectively (C). These results revealed that the infected host tissues of the WT control lines showed significantly higher fungal development than OE-Def lines. No fungal growth was detected in the un-inoculated cotyledon samples. ELISA revealed significantly lower aflatoxin levels in the inoculated OE-Def cotyledons (P ≤ .05) than the WT controls (D). Transgenic OE-Def lines accumulated <5 ppb aflatoxin compared to >4000 ppb detected in the WT controls following 72 h of fungal infection, indicating very high levels of resistance to aflatoxin contamination.
Figure 1. Effect of Aspergillus flavus infection in peanut control and transgenic (OE-Def) lines at 72 h post-infection. (A) Comparison of fungal colonization on cotyledons of MtDef4-Ec 97 and WT controls at different time points. (B) OE-Def lines show very little fungal growth on events generated with extracellularly targeted Def4 genes at 72 hpi; (C) fungal load of A. flavus on cotyledons of OE-Def and WT control lines after 72 hpi, and (D) aflatoxin content (ppb) in T4 cotyledons of OE-Def peanut lines following A. flavus infection at 72 hpi. Error bar represents standard error of at least three biological replicates. Different letters indicate significant differences at P ≤ .05.
3.2. Impacts of A. flavus infection on the proteomes
To understand the proteome changes in OE-Def and WT control lines, a label-free quantitative proteomics analysis was performed at 0, 24, 40, 56, and 72 h after A. flavus inoculation using UPLC-ESI-MS/MS. A time point comparison within a genotype revealed expression of 2975, 1989, 2085, 1993, and 2014 proteins in WT control cotyledons when compared with 3508, 2108, 2118, 2045, and 2040 proteins in OE-Def lines. However, comparison between WT control and OE-Def lines revealed the expression of 3020, 2983, 2446, 2410, and 2880 proteins over a 72 h period (Tables S2 and S3).
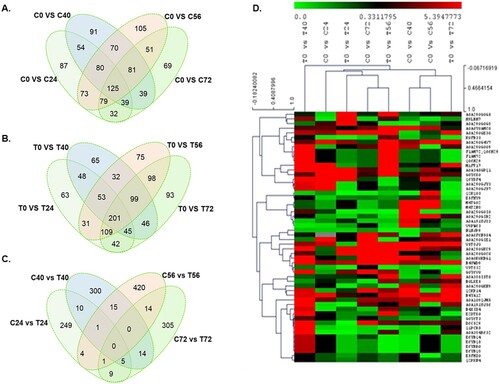
Comparative quantitative protein expression analysis was performed to identify the A. flavus-responsive proteins using the proteins having at least two unique peptides with 1.5-fold change at P ≤ .05 between the uninfected and infected groups in both control and transgenic lines. Expression analysis indicated differential regulation of 2327 proteins across various time points, of which 1269 and 1058 proteins were down- and up-regulated in WT controls, respectively (A). Similarly, in the transgenic lines, 2612 proteins were differentially regulated upon infection, of which 1422 proteins were down-regulated, and 1190 proteins were up-regulated (B). Further, we identified 569/592, 579/589, 664/698, and 515/733 DEPs in control/transgenic cotyledons and over 879, 871, 907, and 900 DEPs between the WT control and transgenic samples (C) under A. flavus infection at 24, 40, 56, and 72 hpi, respectively, indicative of the proteome changes in response to pathogen at different time points (D). In addition, 125 proteins in control and 201 proteins in the transgenic lines, and 290/310, 279/292, 209/243, and 167/385 unique proteins were revealed between WT control and transgenic lines consistent in their presence across the tested time points.
Figure 2. Overview of significantly changed proteins in response to A. flavus infection in peanut cotyledons at 0, 24, 40, 56, and 72 h post-infection. (A–C) Venn diagram showing significantly changed proteins unique to or shared between treatments after A. flavus infection in (A) WT controls, (B) transgenic events, and (C) between WT controls and transgenic events. (C) Heat map and hierarchical clustering of significantly changed proteins common in both control and transgenic samples across different time points.
3.3. Functional classification of identified proteins based on GO annotation
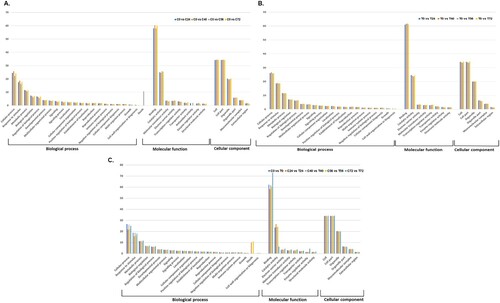
GO annotation was performed to functionally classify the identified proteins providing details of the hierarchical relationships of cellular components, biological processes, and molecular functions (). The detailed information, including protein IDs, KEGG, and subcellular localizations of all identified proteins, is listed in Tables S2 and S3. Analysis of putative functions revealed 21 GO terms related to biological processes, eight GO terms for molecular functions and six GO terms for cellular components. In terms of the cellular components, the most represented categories were cell, cell parts, and organelles. In the molecular function category, proteins with binding and catalytic activity were highly represented. Regarding biological process, most proteins were involved in cellular processes, response to stimulus, and metabolic processes. Broad functional distribution analysis showed that the DEPs in the contrasting lines shared the same categories in biological, molecular, and cellular process with the differences in the proportional distribution of the proteins ().
Figure 3. Protein annotation and classification. All proteins identified at different time points were classified by GO terms based on their cellular component, molecular function, and biological process in (A) WT controls, and (B) transgenic events, and (C) between controls and transgenic events.
3.4. Enrichment analysis of DEPs in OE-Def and WT lines under A. flavus infection
The DEPs from OE-Def and WT control lines were mapped individually, and in comparison, to each other and to different functional categories in the MapMan tool to reveal the A. flavus-affected pathways. All DEPs were associated with 35 pathways ((A–C)), significantly enriched are ones associated with stress (8–19%), signaling (5–10%), protein (9–11%), lipid metabolism (5–10%), and photosynthesis (5%). Functional protein association network built using STRING indicated 633 mapped nodes in WT controls, while 656 nodes were mapped in OE-Def samples. According to the interaction network, 28 KEGG pathways significantly enriched in WT controls while 34 pathways enriched in OE-Def lines under A. flavus infection. K-means clustering indicated five protein co-interacting clusters in control lines while six clusters were prominent in transgenic lines which mainly belongs to fatty acid metabolism, nitrogen and carbohydrate metabolism, flavonoid synthesis, receptor-like protein kinase, and disease resistance NBS-LRR proteins ((D,E)). A few A. flavus-responsive proteins that could not be identified by the UniProt database were matched with their corresponding homologous proteins using UniProt blast.
Figure 4. Overview of the A. flavus-responsive proteins in OE-Def transgenic and control lines. (A–C) Functional classification of differentially expressed proteins in (A) control, (B) transgenics, and (C) comparison of transgenic and control samples based on map man bin codes. (D–F) Protein interaction network of the significant proteins that were differentially regulated by A. flavus infection in (D) control samples, (E) transgenic lines. (F) Comparison of transgenic and controls. The protein integration map was predicted using STRING with high confidence (0.7) based on the proteins mapped to Medicago truncatula proteome. Red dotted circles show clusters on interest.
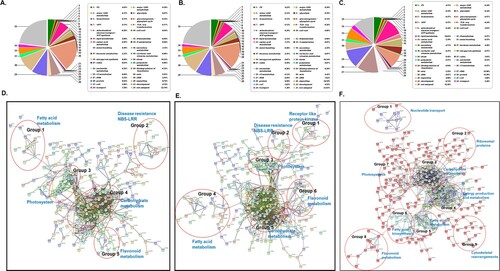
Nine protein clusters were identified while comparing the proteins from WT control and transgenic samples (F). In Group 1, the proteins were mainly involved in energy production and conversion, lipid transport and metabolism, nucleotide transport and metabolism, posttranslational modification, protein turnover, and chaperones. Group 2 included ribosomal proteins with different functions involved in translation, ribosomal structure, and biogenesis. Group 3 included proteins mainly involved in carbohydrate transport, energy production, and conversion. Group 4 had proteins belonging to energy production and metabolism, Groups 5 and 6 contain linked proteins belongs to fatty acid biosynthesis and metabolism. While the proteins in Group 7 represent photosystems, Groups 8 and 9 have proteins involved in flavonoid synthesis and cytoskeletal rearrangements, respectively. The STRING analysis suggested a strong interaction between the proteins involved in photosynthesis-related proteins, ribosomal family proteins, energy metabolism, lipid metabolism, cytoskeletal proteins, and proteins involved in secondary metabolite synthesis. These results provided clear indications that proteins belong to vital metabolic pathways and the induced metabolic pathways had strong interactions in OE-Def lines under A. flavus infection.
3.5. Comparative proteomic changes between OE-Def and WT controls
Changes in proteomes between the OE-Def transgenic and WT control samples were captured across different time points viz. 24, 40, 56, and 72 hpi, with 290/310, 279/292, 209/243, and 167/385 unique proteins were revealed following A. flavus infection (Tables S2 and S3). OE-Def samples consistently exhibited a higher number of unique proteins at all time points compared to WT controls. The difference in the number of proteins observed between lines at early stages of infection provided information about the proteins that are potentially involved in early compatible and incompatible responses to pathogen infection. Proteins involved in signaling, phosphorylation, and early resistance mechanisms, such as citrate synthase, glutamine synthase, phytol kinase, and acyl carrier protein in resistant OE-Def plants and putative CBL-interacting protein kinase, serine threonine protein kinase, resistant proteins PRG and PNTR were observed in WT control plants at 24 hpi (Tables S2 and S3). Likewise, a comparison between these two contrasting lines was made at 72 hpi to examine protein changes at late A. flavus infection stage. Furthermore, transcription factors (NAC, putative R2R3 MYB 8, MYB22, auxin signaling F-box3) and secondary metabolic pathway genes such as diacylglycerol acyltransferase, fatty acid hydroxylase, Ω-6 fatty acid desaturase, and fatty acid hydroxylase were also observed in resistant OE-Def lines at 72 hpi (Tables S2 and S3). Interestingly, as the A. flavus infection progressed, a clear reduction in the expression of unique proteins in the WT control lines was observed in contrast to their incrementally higher number in OE-Def transgenic samples. Moreover, distinct differences were observed in the protein expression between the WT control and transgenic samples at late stages of infection, positively contributing to the establishment of the disease resistance phenotype in the OE-Def transgenics. While the pathway analysis of DEPs in contrasting lines at 72 hpi supported this assumption, proteins representing 65 metabolic pathways were altered in WT control, whereas 83 metabolic pathways responded to infection in transgenic at 72 hpi.
3.6. Validation of protein expression
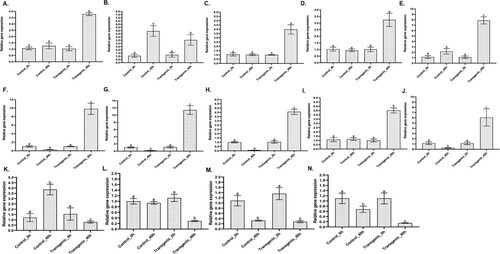
The expression patterns of 14 selected genes previously reported to have roles in either disease resistance or susceptibility were validated experimentally using Quantitative RT–PCR to investigate whether changes captured in the expression of proteins were regulated at the transcriptional level (). These include genes involved in biotic stress responses, proteolysis, flavonoid and fatty caid biosynthesis, and signal transduction pathways categorized into different subcategories, which were either directly or indirectly linked to plant resistance or susceptibility. The results revealed substantial agreement at the two levels, for all 14 genes differentially expressed upon pathogen infection in resistant transgenic lines and exhibited specific differential expression profile between the contrasting genotypes (). The expression of lipoxygenase (3.00 FC), CDP-diacylglycerol-glycerol-3-phosphate 3-phosphatidyl transferase (3.90 FC), diacylglycerol acyltransferase (3.44 FC), sphingolipid delta(4)-desaturase (3.62 FC), fatty alcohol oxidase-1 (35.56 FC), triacylglycerol lipase 3 (71.48 FC), cysteine proteinase inhibitor (55.83 FC), ubiquitin-conjugating enzyme-1 (3.85 FC) and chitinase (23.38 FC) were significantly (P ≤ .05) increased in OE-Def lines compared to WT control lines following A. flavus infection. However, expression of annexin 5 (4.22 FC), syntaxin 52 (3.25 FC), and MLO-like protein 1 (4.70 FC) were significantly (P ≤ .05) higher in WT controls. Whereas expression of kunitz trypsin inhibitor 4 (1.15 FC) and glycosyltransferase (1.39 FC) was higher in WT control compared to OE-Def lines inoculated with pathogen but was not significant.
Figure 5. Relative transcript expression of differentially expressed proteins from OE-Def transgenic and control lines, following A. flavus inoculation at 40 hpi based on qRT–PCR in comparison to reference gene ADH3 and G6Pd. (A) Lipoxygenase (Q9M5D3), (B) Glycosyltransferase (A0A0K0KBH5), (C) CDP-diacylglycerol-glycerol-3-phosphate 3-phosphatidyl transferase (H9L792), (D) Diacylglycerol acyltransferase (Q2KP14), (E) Sphingolipid delta(4)-desaturase (A0A384R632), (F) Fatty alcohol oxidase-1 (A0A345G), (G) Triacylglycerol lipase 3 (F1AM72), (H) Cysteine proteinase inhibitor (Q647G6), (I) Ubiquitin-conjugating enzyme-1 (Q45W77), (J) Chitinase (D3U314), (K) annexin 5 (A0A0F7GFK8), (L) Syntaxin 52 (Q06H39), (M) Kunitz trypsin inhibitor 4 (B4UWB2), and (N) MLO-like protein 1 (A0A290G010). Different letters on the error bars indicate significant differences using Student’s t-test.
3.7. Identification of resistance-associated proteins in A. flavus–peanut pathosystem
To identify the resistance-associated proteins, contrasting proteomes were compared individually and between during A. flavus infection progression (Tables S2 and S3). At least 872 A. flavus-responsive proteins common in both the transgenic and control samples were identified following differential expression patterns. The A. flavus-responsive DEPs were found to be mainly involved in processes such as stress response, cell wall biosynthesis, hypersensitive response, synthesis of secondary metabolic pathways including phenylpropanoids and flavonoids, lipid metabolism, and plant–pathogen interactions (, and ).
Figure 6. Overview of the Aspergillus flavus–peanut interaction pathway showing disease resistance proteins, phytohormones, and transcription factor involved in the biosynthesis of secondary metabolite pathways in OE-Def transgenic lines inoculated with A. flavus. The detailed information of these proteins is listed in and and Supplementary Tables S2 and S3. Information on protein related to cell wall (), phytohormones (Tables S2 and S3), transcription factor (Tables S2 and S3), NBS-LRR, nucleotide-binding-site-leucine-rich repeat (), RLPK, receptor-like protein kinase (Tables S2 and S3), MAPK, mitogen-activated protein kinase (Tables S2 and S3), PR protein, pathogen-related protein ( and Table S2), secondary metabolic pathway genes, LOX, lipoxygenase, MGAT, monoacylglycerol acyltransferase, DGAT, diacylglycerol acyltransferase, PAL, phenylalanine ammonia-lyase, C4H, cinnamic acid 4-hydroxylase, COMT, caffeic acid methyl transferase, CHS, chalcone synthase, CHI, chalcone-flavonone isomerase, DFR, dihydroflavonol reductase, RS, resveratrol synthase, and F3H, flavanone-3- hydroxylase are presented in . While the up-regulated and down-regulated proteins at 24, 40, 56, and 72 hpi are marked as green and red squares, the white squares represent the absence of protein.
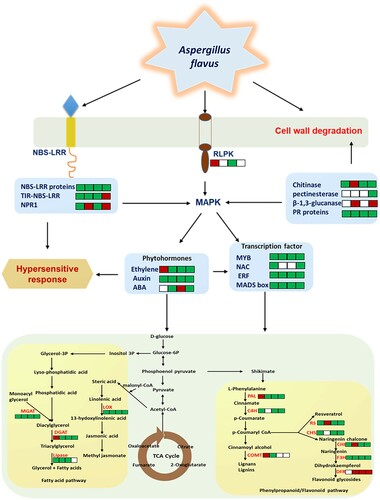
Table 1. Cell wall and hypersensitivity-related proteins showing >2-fold increase in OE-Def transgenic peanut samples compared to WT control during Aspergillus flavus infection.
Table 2. List of up-regulated proteins (>2-FC) involved in secondary metabolic pathways in OE-Def transgenic peanut samples compared to WT controls during Aspergillus flavus infection.
Proteins related to the upregulation of cell wall biosynthesis were identified in transgenic samples at different time points (). Cell wall enzymes such as chitinase (108.30-fold change (FC)) and pectinesterase (10.51-FC) were higher in OE-Def lines, while β-1,3-glucanase (14.37 FC) was present in abundance in WT controls. Further, disease resistance genes (R genes), such as NBS-LRR proteins (2.0–89.00 FC), TIR-NBS-LRR (2.5-20.00 FC), PR protein 4A (7.26 FC), and NPR1 protein (75.00 FC) were significantly higher in OE-Def transgenic lines than the WT control lines.
Proteins encoding secondary metabolite biosynthesis were detected in both OE-Def and WT control samples (). These proteins belonged to different chemical groups where some of the important and high-fold change proteins included phenylpropanoids viz., phenylalanine ammonia-lyase 2-like (EC:4.3.1.24) (60.57 FC), caffeic acid methyl transferase (7.83 FC), cinnamic acid 4-hydroxylase (9.80 FC); flavonoids: chalcone synthase (47.64 FC), chalcone-flavonone isomerase (10.13 FC), resveratrol synthase (100.00 FC), flavanone-3-hydroxylase (12.83 FC), 2-methyl- 6-phytylbenzoquinone methyltransferase (32.75 FC), and resveratrol 3'-dimethyl allyl transferase (368.87 FC) that were up-regulated in OE-Def transgenic lines. Similarly, the fatty acid pathway proteins such as acyl carrier protein (397.56 FC), lipoxygenase (131.89 FC), diacylglycerol-glycerol-3-phosphate 3-phosphatidyltransferase (153.72 FC), β-ketoacyl-ACP-reductase (14.19 FC), β-ketoacyl-ACP synthase-II (158.71 FC), 1-acyl-sn-glycerol-3-phosphate acyltransferase (128.79 FC), monoacylglycerol acyltransferase (33.47 FC), diacylglycerol acyltransferase (14.80 FC), triacylglycerol lipase (31.17 FC), long-chain fatty alcohol oxidase 1 (14.14 FC), acyl-[acyl-carrier-protein] hydrolase (112.00 FC), and lipase (37.27 FC) were higher in OE-Def lines.
3.8. Identification of susceptibility-associated proteins
The study allowed the identification of abundantly expressing putative susceptibility-associated proteins (SAPs) in WT control samples compared to OE-Def lines as the infection progressed (Table S3). A majority of SAP were present in the early stage of infection (24 hpi) during compatible peanut–A. flavus interactions (). Higher expression of several proteins involved in plant–pathogen interactions included annexin (4.20 FC), syntaxin (9.72 FC), kunitz trypsin inhibitor 4 (64.72 FC), mildew resistance locus O (MLO)-like protein (7.68 FC), heat shock protein HSP70 (4.67 FC), cationic peroxidase 1 (149.91 FC), R genes, NBS-LRR proteins (89.14 FC), TIR-NBS-LRR (8.95 FC), flavonoid pathway proteins such as, stilbene synthase 2 (99.78 FC), dihydroflavonol-4-reductase (28.20 FC), resveratrol 3'-dimethylallyltransferase (28.82 FC), and anthocyanidin synthase (5.22 FC), fatty acid pathway proteins, β-ketoacyl-ACP-reductase 1–2 (13.42), β-ketoacyl-ACP synthase III-1 (3.00 FC), and ω-6 fatty acid desaturase (7.37 FC), and MYB transcription factors, MYB4 (5.09 FC) and MYB9 (15 FC) ().
Table 3. Putative SAPs identified in WT controls during Aspergillus flavus infection.
4. Discussion
Plants have developed several defense mechanisms to restrict the growth of pathogens. Changes in proteome composition and protein activity are major key elements of plant–pathogen interactions (Elmore et al. Citation2021; Jamshidi Goharrizi et al. Citation2019, Citation2020). Proteome profiling during pathogen infection can identify specific proteins and associated biological pathways that contribute to disease resistance and susceptibilities. Developing elite cultivars by understanding the molecular mechanisms of Aspergillus–peanut interaction is the most effective strategy to mitigate aflatoxin contamination in peanuts. However, poor genetic background and lack of sustainable resistance to A. flavus infection and aflatoxin production in the available germplasm has been a major bottleneck for breeding of elite cultivars in peanut (Fountain et al. Citation2015). In this study, OE-Def transgenic lines developed in our previous study (Sharma et al. Citation2018) were reconfirmed for their significantly enhanced capacity to resist A. flavus infection and significantly reduced aflatoxin accumulation compared to their wild-type counterparts. Comparative proteomic analysis in the resistant and susceptible lines revealed 872 differentially expressed proteins (DEPs) involved in diverse metabolic processes during progressive A. flavus infection. The highest number of DEPs in OE-Def lines was observed to be induced at 56 and 72 hpi clearly indicating differential regulation of pathogenicity in OE-Def transgenic lines during mid–late stages of infection. While there have been no studies on how defensin genes regulate these downstream resistance genes, our study revealed DEPs involved in hypersensitive responses, which possibly is an inducible defense reaction mediated by the Def- transgene and further activates the downstream regulatory genes and resistance-associated proteins that contribute to the observed quantitative durable resistance (Kaur et al. Citation2011; Kushalappa et al. Citation2016). This study revealed over 106 pathways to be influenced during A. flavus infection in transgenic OE-Def events that included secondary metabolite synthesis, carbohydrate, fatty acid, plant hormone, signal transduction, and amino acid metabolisms. Recent transcriptomic studies also reported induction of lipid pathways, flavonoid pathways, and carbohydrate metabolic pathways including glycolysis, glycogen metabolism, and sugar metabolism, in resistant peanut cultivars compared to susceptible ones during A. flavus infection (Soni et al. Citation2020, Citation2021). Nonetheless, our study offers advantages not only in terms of confirming the presence of the associated proteins and providing a direct measure of their relative quantities, but since the resistant genotype (OE-Def line) used in our study was nearly isogenic to WT controls except for single gene insert, it provided an opportunity to better understand the molecular basis of infection and aflatoxin resistance in Aspergillus–peanut pathosystem, without any genetic background noise. The hierarchies of proteins following the perception of pathogen triggered disease resistance (R) proteins, plant hormones and transcription factors, and secondary metabolic pathways associated with differentially expressed proteins as discussed below.
4.1. Differentially expressed proteins related to hypersensitive responses to A. flavus
Plants recognize the pathogen-produced elicitors through their receptors localized in cell membrane or in cytosol (Jones and Dangl Citation2006). We observed the upregulation of several families of receptor-like kinases such as receptor-like protein kinase 1, receptor protein kinases, and serine–threonine protein kinases in resistant OE-Def samples. An earlier report in maize also identified serine–threonine protein kinases as resistance-associated proteins during A. flavus infection and have been shown to play a role in both broad-spectrum, elicitor-initiated defense responses and as dominant resistance (R) genes in race-specific pathogen defense (Jones and Dangl Citation2006). As the first level of defense, plants produce pathogenesis-related (PR) proteins such as β-1,3-glucanase and chitinase to breakdown the cell wall components of pathogen and act as a signaling molecules to trigger resistance (Funnell et al. Citation2004). In the present study, higher production of chitinases, pectinesterases, β-1,3-glucanases and PR4A was detected upon A. flavus infection indicating their role in one of the crucial processes in plant defense. These enzymes occur frequently in many isoforms and are involved in synthesis of defense substances or a direct antimicrobial activity (Balasubramanian et al. Citation2012; Gupta et al. Citation2013). The observed results concur with earlier reports where stronger induction of PR10 was observed in resistant maize compared to the susceptible genotype against A. flavus infection (Chen et al. Citation2010, Citation2006, Lanubile et al. Citation2017).
An upregulation of NBS-LRR and TIR-NBS-LRR proteins were observed in the resistant OE-Def lines. Specialized pathogens suppress elicitor-initiated defense responses, penetrate into the cells, and produce race-specific effectors encoded by avirulence (AVR) genes (Oliver and Solomon Citation2010) that are recognized by receptors with NBS-LRR domains to activate effector-triggered immunity (ETI). While these ETI result in hypersensitive response to contain the pathogen, there have been very few reports on the involvement of peanut NBS-LRR proteins against A. flavus infection (Li et al. Citation2013; Nayak et al. Citation2017; Song et al. Citation2017). However, it is still a possibility that these receptors trigger downstream regulatory, and resistance-associated proteins to activate secondary metabolic pathway genes.
4.2. Differentially expressed proteins related to signal transduction
Following the perception of pathogen-produced elicitors, plants synthesize a complex blend of phytohormones which activate downstream genes that regulate distinct sets of resistance genes (Pieterse et al. Citation2012). In the present study, the resistant OE-Def lines showed an overproduction of several plant hormone-induced proteins including auxin-induced protein, auxin-induced putative aldo/keto reductase, auxin-induced putative tetratricopeptide-containing protein, ethylene-responsive proteins such as, ethylene-responsive element binding factor-2, aminocyclopropanecarboxylate oxidase, S-adenosylmethionine synthase, and ABA-responsive proteins such as abscisic acid 8-hydroxylase 1 and ABA response element binding protein-1. Ethephon-generated ethylene has been earlier shown to inhibit aflatoxin biosynthesis in vitro in A. flavus, that was partially due to its effects on ROS production in peanuts (Huang et al. Citation2009) and ethylene-responsive factor (ZmERF1)-induced defensin proteins to resist A. flavus in maize (Fountain et al. Citation2015). Further, treatment of ethylene in combination with CO2 was shown to prevent aflatoxin production in peanut against A. parasiticus (Roze et al. Citation2007). Likewise, homolog of abscisic acid-insensitive gene, ABR1, has been identified as a repressor of the ABA signaling pathway which confers resistance against pre-harvest aflatoxin contamination (Clevenger et al. Citation2016). Studies on direct involvement of auxins and ABA in plant defense response are very limited and restricted only to model plants. However, these phytohormones either activate a variety of transcription factors that regulate plant defense responses involving up- or down-regulation of downstream resistance genes (Alves et al. Citation2014) or cross-talk between them to regulate defense response in plants (Asghar et al. Citation2019).
4.3. Differentially expressed regulatory proteins and TFs
Transcription factors (TFs) are excellent candidates in stress resistance breeding by directly regulating downstream resistance genes (Alves et al. Citation2014; Kou and Wang Citation2012; Lanubile et al. Citation2017; Yoon et al. Citation2020; Yuan et al. Citation2019). A total of 20 high-fold change TF-related proteins were detected in resistant OE-Def transgenic and WT control lines, including genes encoding MYB binding proteins in OE-Def transgenic lines. While the ones up-regulated in OE-Def lines included MYB1, MYB3, MYB12, MYB13, MYB20, MYB21, MYB23, MYB24, and MYB30. These findings are not unusual as increased levels of MYB and NAC proteins are known to regulate secondary defense response genes following infection by several microorganisms (Yoon et al. Citation2020; Yuan et al. Citation2019). Among these, MYB12 has been reported to be involved in specific regulation of flavonoid biosynthesis by regulating chalcone synthase (CHS) and flavanol synthase (FLS) accounting for flavanol glycoside accumulation in Arabidopsis (Mehrtens et al. Citation2005; Stracke et al. Citation2010). In addition, proteins encoding for ethylene-responsive TF, AP2-like ethylene-responsive transcription factor ANT-like protein, MADS box TF, MADS box protein M8, and NAC TF were significantly induced in OE-Def transgenic lines. While TFs, NAC, and ethylene-responsive factors are known to play a vital role in complex signaling networks during plant stress responses, their specific roles in biotic stress resistance remain largely unexplored. Previous studies demonstrate that NAC proteins are activated via an ethylene signaling pathway (Kim et al. Citation2014; Yogendra et al. Citation2017) and individually or together with TF may possibly act as a transcriptional activators or repressors to regulate downstream resistance genes.
4.4. Differentially expressed proteins involved in secondary metabolite production
In the current study, 67 proteins belonging to the secondary metabolism were differentially induced in OE-Def-resistant transgenic line compared to the susceptible WT control. These resistance proteins are known to produce secondary metabolites such as phytoanticipins and phytoalexins which may be antimicrobial and suppress the progression of pathogen infection (Kushalappa et al. Citation2016; Nawrot et al. Citation2014). Most of the proteins identified in the resistant transgenic lines belonged to the phenylpropanoid pathway, flavonoids, and fatty acids, suggesting their major role in aflatoxin resistance.
4.4.1. Phenylpropanoid biosynthesis
Secondary metabolic pathways including those for phenylpropanoids and flavonoids, well-known antioxidants with role in plant defense were observed to be differentially induced during the A. flavus infection. An increased expression of proteins viz. phenylalanine ammonia-lyase 2-like, caffeic acid methyl transferase, cinnamic acid 4-hydroxylase, chalcone synthase, chalcone-flavonone isomerase, resveratrol synthase, flavanone-3-hydroxylase, and 2-methyl-6-phytylbenzoquinone methyltransferase were captured in OE-Def transgenic samples under A. flavus infection. Phenylalanine ammonia lyase (PAL), a precursor of lignin and phytoalexins, has also been previously shown to increase in a resistant peanut genotype upon A. flavus infection (Xuanqiang et al. Citation2001). Similarly, Resveratrol, another key protein up-regulated in OE-Def transgenic lines in our study, is a well-known phytoalexin that enhance the host–plant resistance against biotic and abiotic stresses (Chang et al. Citation2011). The inhibitory effect of resveratrol on aflatoxin synthesis and mycelial growth has previously been reported in peanut (Wang et al. Citation2013, Citation2015). Furthermore, our results are consistent with the previous transcriptomic data, where the upregulation of resveratrol and flavonoids in resistant peanut lines were reported to affect the fungal growth and aflatoxin production (Nayak et al. Citation2017; Wang et al. Citation2015).
4.4.2. Fatty acid biosynthesis
In the present study, over 46 proteins involved in fatty acid biosynthesis, elongation, and degradation were found to be responsive to A. flavus infection in OE-Def transgenic lines. We observed higher abundance of acyl carrier protein, lipoxygenase, diacylglycerol-glycerol-3-phosphate-3-phosphatidyltransferase, β-ketoacyl-ACP-reductase, β-ketoacyl-ACP synthase-II, monoacylglycerol acyltransferase, diacylglycerol acyltransferase, triacylglycerol lipase, long-chain fatty alcohol oxidase-1 and acyl-[acyl-carrier-protein] hydrolase in transgenic samples during A. flavus infection. These results are in line with the previous reports where lipoxygenase mediated hydroperoxy fatty acids production acted as the substrate for oxylipin synthesis (Dave and Graham Citation2012), antimicrobial for a wide range of pathogens including A. flavus (Jayashree and Subramanyam Citation2000). Lipoxygenase-3 (LOX3) and few other 9-oxylipins have been reported to be crucial for resistance to A. flavus and suppression of aflatoxin biosynthesis in maize and soybean (Gao and Kolomiets Citation2009). Fatty acids mainly involve in the synthesis of signaling molecules, such as jasmonate, again an antimicrobial compound which plays a key role in resistance to Aspergillus infection and act as the physical barrier for pathogen entry in peanut (Van der Ent et al. Citation2009).
4.5. Susceptibility-associated proteins involved in A. flavus infection and aflatoxin contamination
While the knowledge of genes regulating plant disease resistance has dramatically increased in recent years, the characterization of disease susceptibility genes has been limited. A gain or loss of resistance is defined as host susceptibility (Chisholm et al. Citation2006). A gap between the nature of resistance and that of susceptibility is likely due to differences in their genetic tractability (Lorang et al. Citation2007). Specialized pathogens like A. flavus often possess multiple virulence factors called effectors which incrementally contribute to the disease phenotype. The early stage of compatible interaction of peanut–A. flavus are likely to involve protein phosphorylation, ion fluxes, reactive oxygen species (ROS), and other signaling transduction (Shen et al. Citation2017). However, as the disease progresses, the pathogen keep the infection going by producing more mycelia and virulent spores, resulting in a susceptible phenotype. In our study, we observed high expression of several proteins such as syntaxin-52, annexin-5, kunitz trypsin inhibitor-4, MLO-like protein-1, and R genes in the WT controls at early stages of infection. Syntaxins, family of membrane integrated Q-SNARE proteins have been reported to be key susceptibility factors for a number of plant diseases. Silencing of Syntaxin SYP121 and SYP122 have shown to improve disease resistance in Arabidopsis thaliana against the virulent powdery mildew fungus Erysiphe cichoracearum and bacterial pathogen Pseudomonas DC300 in an salicylic acid (SA)-independent manner (Zhang et al. Citation2007). In potato, RNAi silencing of StSYR1 and StSNAP33 genes increased the constitutive accumulation of SA and PR1 transcripts, enhancing resistance against Phytophthora infestans (Eschen-Lippold et al. Citation2012). Likewise, silencing of MdSYP121 gene increased tolerance to Botryosphaeria dothidea infection in apple (He et al. Citation2018). Similarly, RNAi silencing of AtANN8 encoding for Ca2+ regulated phospholipid-binding and membrane-binding annexins proteins in A. thaliana led to enhanced expression of Resistance to Powdery Mildew 8.1 (RPW8.1) and provided defense against powdery mildew (Zhao et al. Citation2021). RNAi silencing of Kunitz trypsin inhibitor (AtKTI1) in A. thaliana led to enhanced resistance to the virulent pathogen Erwinia carotovora subsp. carotovora, while overexpression of AtKTI1 resulted in higher susceptibility towards this pathogen (Li et al. Citation2008).
MLO, another susceptibility gene that contains seven transmembrane helices, was observed to be abundant in the susceptible WT line. The loss-of-function mutations of MLO genes in barley (Jørgensen Citation1992), tomato (Bai et al. Citation2008), wheat (Wang et al. Citation2014), rose (Fang et al. Citation2021), and grapes (Pessina et al. Citation2016) have shown to confer resistance to powdery mildew pathogen. It is intriguing to note higher expression of NBS-LRR genes during infection in the WT control lines, considering that this family of genes have been reported as resistance-associated genes across several crops. A previous report in Arabidopsis revealed an NBS-LRR gene underlying the locus LOV1 induced susceptibility to Cochliobolus victoriae infection (Lorang et al. Citation2007). In addition, induction of several MYB transcription factors viz. MYB4, MYB9, and MYB12 were also up-regulated in WT control lines. An earlier report in tobacco and switchgrass pointed to MYB4 as a transcriptional repressor that reduced the activities of phenylalanine ammonia lyase (PAL) and caffeoyl CoA 3-O-methyltransferase (CCoAOMT) in lignin biosynthetic pathway (Shen et al. Citation2012). We hypothesize that a higher fold increase in MYB4 in the WT control might have affected the phenylpropanoid pathway genes, increasing its susceptibility to A. flavus infection.
Besides these, the role of several other fatty acid and flavonoid pathway proteins/genes observed to be induced during early infection in WT controls is not very clear in the literature and needs further investigation. Nevertheless, this knowledge could potentially provide opportunities for transcriptional inactivation of these candidate susceptibility-associated proteins (SAPs) to aid the development of durable disease resistance using targeted breeding interventions such as genome editing.
5. Conclusions
The comparative proteomics approaches employed in Aspergillus–peanut pathosystem provides insights into the molecular events underlying an enhanced resistance to A. flavus in transgenic line compared to its near-isogenic susceptible WT parent. We identified hierarchies of genes including PR proteins, phytohormones, and transcription factors which regulate the downstream secondary metabolic pathway genes known to directly suppress pathogen development in its host. The identified proteins can be used as biomarkers in plant breeding for the selection of suitable aflatoxin-free crops. In addition, these data sets reveal underlying genetic mechanisms and discovery of several defense and susceptibility-associated proteins, that provide novel targets for precision breeding in peanuts for resistance to Aspergillus and the resulting aflatoxin contamination.
Acknowledgements
Authors thank Pradeep Reddy, B. Brahmananda Reddy, and N. Kedarinath for assistance with various experiments.
Disclosure statement
No potential conflict of interest was reported by the authors.
Additional information
Funding
Notes on contributors
Pooja Bhatnagar-Mathur
Pooja Bhatnagar-Mathur worked as a Principal Scientist in Cell, Molecular Biology and Trait Engineering at the International Crops Research Institute for the Semi-Arid Tropics (ICRISAT) in India. Currently, she is a Principal Scientist working as a Precision Genetics Lead at The International Maize and Wheat Improvement Center (CIMMYT) in Mexico.
Kalenahalli Yogendra
Kalenahalli Yogendra is a Scientist at International Crops Research Institute for the Semi-Arid Tropics (ICRISAT), India working on candidate gene discovery and their validations in grain legumes using integration of proteomics and metabolomics during host-pathogen interactions.
Santisree Parankusam
Santisree Parankusam worked as an Inspire fellow of the Department of Biotechnology, Government of India at the International Crops Research Institute for the Semi-Arid Tropics (ICRISAT), India.
Hemlatha Sanivarapu
Hemlatha Sanivarapu is a technical officer at the International Crops Research Institute for the Semi-Arid Tropics (ICRISAT), India.
Kalyani Prasad
Kalyani Prasad is a Consultant at the International Crops Research Institute for the Semi-Arid Tropics, India working on trait development for Aflatoxin resistance.
Shiva Bhargavi Lingampali
Shiva Bhargavi Lingampali is a Ph.D. student at the International Crops Research Institute for the Semi-Arid Tropics, India.
Kiran Kumar Sharma
Kiran Kumar Sharma is the Director of the CGIAR Research Program on Grain Legumes and Dryland Cereals (CRP-GLDC) and formerly the Principal Scientist for Cell and Molecular Biology at the International Crops Research Institute for the Semi-Arid Tropics (ICRISAT), India.
References
- Alves MS, Dadalto SP, Gonçalves AB, De Souza GB, Barros VA, Fietto LG. 2014. Transcription factor functional protein-protein interactions in plant defense responses. Proteomes. 2:85–106.
- Arias RS, Dang PM, Sobolev VS. 2015. RNAi-mediated control of aflatoxins in peanut: method to analyze mycotoxin production and transgene expression in the peanut/Aspergillus pathosystem. J Vis Exp. 106:53398.
- Asghar MA, Li Y, Jiang H, Sun X, Ahmad B, Imran S, Yu L, Liu C, Yang W, Du J. 2019. Crosstalk between abscisic acid and auxin under osmotic stress. Agron J. 111:2157–2162.
- Bai Y, Pavan S, Zheng Z, Zappel NF, Reinstädler A, Lotti C, De Giovanni C, Ricciardi L, Lindhout P, Visser R. 2008. Naturally occurring broad-spectrum powdery mildew resistance in a central American tomato accession is caused by loss of Mlo function. Mol Plant Microbe Interact. 21:30–39.
- Balasubramanian V, Vashisht D, Cletus J, Sakthivel N. 2012. Plant β-1, 3-glucanases: their biological functions and transgenic expression against phytopathogenic fungi. Biotechnol Lett. 34:1983–1990.
- Balotf S, Wilson R, Tegg RS, Nichols DS, Wilson CR. 2021. Quantitative proteomics provides an insight into germination-related proteins in the obligate biotrophic plant pathogen Spongospora subterranea. Environ Microbiol Rep. 13:521–532.
- Bandyopadhyay R, Cotty PJ. 2013. Biological controls for aflatoxin reduction. In: L. Unnevehr, D. Grace, editor. Aflatoxins: finding solutions for improved food safety, 2020 volume 20. Washington, DC: International Food Policy Research Institute; p. 43–44.
- Benjamini Y, Hochberg Y. 1995. Controlling the false discovery rate: a practical and powerful approach to multiple testing. J R Stat Soc Series B Stat Methodol. 57:289–300.
- Bhatnagar-Mathur P, Sunkara S, Bhatnagar-Panwar M, Waliyar F, Sharma KK. 2015. Biotechnological advances for combating Aspergillus flavus and aflatoxin contamination in crops. Plant Sci. 234:119–132.
- Bryden WL. 2012. Mycotoxin contamination of the feed supply chain: implications for animal productivity and feed security. Anim Feed Sci Technol. 173:134–158.
- Cary JW, Rajasekaran K, Brown RL, Luo M, Chen Z-Y, Bhatnagar D. 2011. Developing resistance to aflatoxin in maize and cottonseed. Toxins (Basel). 3:678–696.
- Chang X, Heene E, Qiao F, Nick P. 2011. The phytoalexin resveratrol regulates the initiation of hypersensitive cell death in vitis cell. PLoS One. 6:e26405.
- Chen Z, Brown R, Guo B, Menkir A, Cleveland T. 2009. Identifying aflatoxin resistance-related proteins/genes through proteomics and RNAi gene silencing. Peanut Sci. 36:35–41.
- Chen Z, Brown R, Rajasekaran K, Damann K, Cleveland T. 2006. Evidence for involvement of a pathogenesis-related protein in maize resistance to Aspergillus flavus infection/aflatoxin production. Phytopathology. 96:87–95.
- Chen Z-Y, Brown RL, Damann KE, Cleveland TE. 2010. PR10 expression in maize and its effect on host resistance against Aspergillus flavus infection and aflatoxin production. Mol Plant Pathol. 11:69–81.
- Chisholm ST, Coaker G, Day B, Staskawicz BJ. 2006. Host-microbe interactions: shaping the evolution of the plant immune response. Cell. 124:803–814.
- Chou K-C, Shen H-B. 2010. Plant-mPLoc: a top-down strategy to augment the power for predicting plant protein subcellular localization. PloS One. 5:e11335.
- Clevenger J, Marasigan K, Liakos V, Sobolev V, Vellidis G, Holbrook C, Ozias-Akins P. 2016. RNA sequencing of contaminated seeds reveals the state of the seed permissive for pre-harvest aflatoxin contamination and points to a potential susceptibility factor. Toxins (Basel). 8:317.
- Dave A, Graham IA. 2012. Oxylipin signaling: a distinct role for the jasmonic acid precursor cis-(+)-12-oxo-phytodienoic acid (cis-OPDA). Front Plant Sci. 3:42.
- Elmore JM, Griffin BD, Walley JW. 2021. Advances in functional proteomics to study plant-pathogen interactions. Curr Opin Plant Biol. 63:102061.
- Eschen-Lippold L, Landgraf R, Smolka U, Schulze S, Heilmann M, Heilmann I, Hause G, Rosahl S. 2012. Activation of defense against Phytophthora infestans in potato by down-regulation of syntaxin gene expression. New Phytol. 193:985–996.
- Fang P, Arens P, Liu X, Zhang X, Lakwani D, Foucher F, Clotault J, Geike J, Kaufmann H, Debener T. 2021. Analysis of allelic variants of RhMLO genes in rose and functional studies on susceptibility to powdery mildew related to clade V homologs. Theor Appl Genet. 134:2495–2515.
- Fountain JC, Khera P, Yang L, Nayak SN, Scully BT, Lee RD, Chen Z-Y, Kemerait RC, Varshney RK, Guo B. 2015. Resistance to Aspergillus flavus in maize and peanut: molecular biology, breeding, environmental stress, and future perspectives. Crop J. 3:229–237.
- Funnell DL, Lawrence CB, Pedersen JF, Schardl CL. 2004. Expression of the tobacco β-1, 3-glucanase gene, PR-2d, following induction of SAR with Peronospora tabacina. Physiol Mol Plant Pathol. 65:285–296.
- Gao X, Kolomiets MV. 2009. Host-derived lipids and oxylipins are crucial signals in modulating mycotoxin production by fungi. Toxin Rev. 28:79–88.
- Graves PR, Haystead TA. 2002. Molecular biologist's guide to proteomics. Microbiol Mol Biol Rev. 66:39–63.
- Gupta P, Ravi I, Sharma V. 2013. Induction of β-1,3-glucanase and chitinase activity in the defense response of Eruca sativa plants against the fungal pathogen Alternaria brassicicola. J Plant Interact. 8:155–161.
- He F. 2011. Laemmli-sds-page. Bio Protoc. Bio-101:e80.
- He X, Huo Y, Liu X, Zhou Q, Feng S, Shen X, Li B, Wu S, Chen X. 2018. Activation of disease resistance against Botryosphaeria dothidea by downregulating the expression of MdSYP121 in apple. Hortic Res. 5:1–16.
- Huang J-Q, Jiang H-F, Zhou Y-Q, Lei Y, Wang S-Y, Liao B-S. 2009. Ethylene inhibited aflatoxin biosynthesis is due to oxidative stress alleviation and related to glutathione redox state changes in Aspergillus flavus. Int J Food Microbiol. 130:17–21.
- Jamshidi Goharrizi K, Baghizadeh A, Kalantar M, Fatehi F. 2019. Assessment of changes in some biochemical traits and proteomic profile of UCB-1 pistachio rootstock leaf under salinity stress. J Plant Growth Regul. 39:608–630.
- Jamshidi Goharrizi K, Fatehi F, Nazari M, Salehi F, Maleki M. 2020. Assessment of changes in the content of sulforaphane and expression levels of CYP79F1 and myrosinase genes and proteomic profile of Lepidium draba plant under water-deficit stress induced by polyethylene glycol. Acta Physiol Plant. 42:1–18.
- Jayashree T, Subramanyam C. 2000. Oxidative stress as a prerequisite for aflatoxin production by Aspergillus parasiticus. Free Radic Biol Med. 29:981–985.
- Jones JD, Dangl JL. 2006. The plant immune system. Nature. 444:323–329.
- Jørgensen IH. 1992. Discovery, characterization and exploitation of Mlo powdery mildew resistance in barley. Euphytica. 63:141–152.
- Kang I-H, Srivastava P, Ozias-Akins P, Gallo M. 2007. Temporal and spatial expression of the major allergens in developing and germinating peanut seed. Plant Physiol. 144:836–845.
- Katam R, Basha SM, Suravajhala P, Pechan T. 2010. Analysis of peanut leaf proteome. J Proteome Res. 9:2236–2254.
- Kaur J, Sagaram US, Shah D. 2011. Can plant defensins be used to engineer durable commercially useful fungal resistance in crop plants? Fungal Biol Rev. 25:128–135.
- Kilambi HV, Manda K, Sanivarapu H, Maurya VK, Sharma R, Sreelakshmi Y. 2016. Shotgun proteomics of tomato fruits: evaluation, optimization and validation of sample preparation methods and mass spectrometric parameters. Front Plant Sci. 7:969.
- Kim HJ, Hong SH, Kim YW, Lee IH, Jun JH, Phee B-K, Rupak T, Jeong H, Lee Y, Hong BS. 2014. Gene regulatory cascade of senescence-associated NAC transcription factors activated by ETHYLENE-INSENSITIVE2-mediated leaf senescence signalling in Arabidopsis. J Exp Bot. 65:4023–4036.
- Klich MA. 2007. Aspergillus flavus: the major producer of aflatoxin. Mol Plant Pathol. 8:713–722.
- Kottapalli KR, Zabet-Moghaddam M, Rowland D, Faircloth W, Mirzaei M, Haynes PA, Payton P. 2013. Shotgun label-free quantitative proteomics of water-deficit-stressed midmature peanut (Arachis hypogaea L.) seed. J Proteome Res. 12:5048–5057.
- Kou Y, Wang S. 2012. Toward an understanding of the molecular basis of quantitative disease resistance in rice. J Biotechnol. 159:283–290.
- Kumar S, Sinha A, Shekhar M, Singh V. 2017. Detection of Aflatoxin B1 through indirect ELISA from fresh grains obtained from three maize growing zones of India. J Appl Nat Sci. 9:796–798.
- Kushalappa AC, Yogendra KN, Karre S. 2016. Plant innate immune response: qualitative and quantitative resistance. Crit Rev Plant Sci. 35:38–55.
- Lanubile A, Maschietto V, Battilani P, Marocco A. 2017. Infection with toxigenic and atoxigenic strains of Aspergillus flavus induces different transcriptional signatures in maize kernels. J Plant Interact. 12:21–30.
- Li C-j, Liu Y, Zheng Y-x, Yan C-x, Zhang T-t, Shan S-h. 2013. Cloning and characterization of an NBS-LRR resistance gene from peanuts (Arachis hypogaea L.). Physiol Mol Plant Pathol.84:70–75.
- Li J, Brader G, Palva ET. 2008. Kunitz trypsin inhibitor: an antagonist of cell death triggered by phytopathogens and fumonisin b1 in Arabidopsis. Mol Plant. 1:482–495.
- Livak KJ, Schmittgen TD. 2001. Analysis of relative gene expression data using real-time quantitative PCR and the 2− ΔΔCT method. Methods. 25:402–408.
- Lohse M, Nagel A, Herter T, May P, Schroda M, Zrenner R, Tohge T, Fernie AR, Stitt M, Usadel B. 2014. Mercator: a fast and simple web server for genome scale functional annotation of plant sequence data. Plant Cell Environ. 37:1250–1258.
- Lorang JM, Sweat TA, Wolpert TJ. 2007. Plant disease susceptibility conferred by a “resistance” gene. Proc Natl Acad Sci USA. 104:14861–14866.
- Luo M, Liang X, Dang P, Holbrook C, Bausher M, Lee R, Guo B. 2005. Microarray-based screening of differentially expressed genes in peanut in response to Aspergillus parasiticus infection and drought stress. Plant Sci. 169:695–703.
- Mehan V, Ramakrishna N, Rao RN, McDonald D. 1995. Preharvest aflatoxin contamination of groundnuts subjected to terminal drought stress in postrainy season. Mycotoxin Res. 11:103–109.
- Mehrtens F, Kranz H, Bednarek P, Weisshaar B. 2005. The Arabidopsis transcription factor MYB12 is a flavonol-specific regulator of phenylpropanoid biosynthesis. Plant Physiol. 138:1083–1096.
- Nawrot R, Barylski J, Nowicki G, Broniarczyk J, Buchwald W, Goździcka-Józefiak A. 2014. Plant antimicrobial peptides. Folia Microbiol. 59:181–196.
- Nayak SN, Agarwal G, Pandey MK, Sudini HK, Jayale AS, Purohit S, Desai A, Wan L, Guo B, Liao B. 2017. Aspergillus flavus infection triggered immune responses and host-pathogen cross-talks in groundnut during in-vitro seed colonization. Sci Rep. 7:1–14.
- Nigam S, Waliyar F, Aruna R, Reddy S, Kumar PL, Craufurd PQ, Diallo A, Ntare B, Upadhyaya HD. 2009. Breeding peanut for resistance to aflatoxin contamination at ICRISAT. Peanut Sci. 36:42–49.
- Okuda S, Watanabe Y, Moriya Y, Kawano S, Yamamoto T, Matsumoto M, Takami T, Kobayashi D, Araki N, Yoshizawa AC. 2017. jPOSTrepo: an international standard data repository for proteomes. Nucleic Acids Res. 45:D1107–D1111.
- Oliver RP, Solomon PS. 2010. New developments in pathogenicity and virulence of necrotrophs. Curr Opin Plant Biol. 13:415–419.
- Ouakhssase A, Chahid A, Choubbane H, Aitmazirt A, Addi EA. 2019. Optimization and validation of a liquid chromatography/tandem mass spectrometry (LC-MS/MS) method for the determination of aflatoxins in maize. Heliyon. 5:e01565.
- Pandey MK, Kumar R, Pandey AK, Soni P, Gangurde SS, Sudini HK, Fountain JC, Liao B, Desmae H, Okori P. 2019. Mitigating aflatoxin contamination in groundnut through a combination of genetic resistance and post-harvest management practices. Toxins (Basel). 11:315.
- Pandey MK, Upadhyaya HD, Rathore A, Vadez V, Sheshshayee M, Sriswathi M, Govil M, Kumar A, Gowda M, Sharma S. 2014. Genomewide association studies for 50 agronomic traits in peanut using the ‘reference set’ comprising 300 genotypes from 48 countries of the semi-arid tropics of the world. PLoS One. 9:e105228.
- Parankusam S, Bhatnagar-Mathur P, Sharma KK. 2017. Heat responsive proteome changes reveal molecular mechanisms underlying heat tolerance in chickpea. Environ Exp Bot. 141:132–144.
- Pessina S, Lenzi L, Perazzolli M, Campa M, Dalla Costa L, Urso S, Valè G, Salamini F, Velasco R, Malnoy M. 2016. Knockdown of MLO genes reduces susceptibility to powdery mildew in grapevine. Hortic Res. 3:1–9.
- Pieterse CM, Van der Does D, Zamioudis C, Leon-Reyes A, Van Wees SC. 2012. Hormonal modulation of plant immunity. Annu Rev Cell Dev Biol. 28:489–521.
- Porterfield H, Murray K, Schlichting D, Chen X, Hansen K, Duncan M, Dreskin S. 2009. Effector activity of peanut allergens: a critical role for Ara h 2, Ara h 6, and their variants. Clin Exp Allergy. 39:1099–1108.
- Reddy DS, Bhatnagar-Mathur P, Cindhuri KS, Sharma KK. 2013. Evaluation and validation of reference genes for normalization of quantitative real-time PCR based gene expression studies in peanut. PloS One. 8:e78555.
- Roze LV, Beaudry RM, Arthur AE, Calvo AM, Linz JE. 2007. Aspergillus volatiles regulate aflatoxin synthesis and asexual sporulation in Aspergillus parasiticus. Appl Environ Microbiol. 73:7268–7276.
- Sardiñas N, Vázquez C, Gil-Serna J, González-Jaén MT, Patiño B. 2011. Specific detection and quantification of Aspergillus flavus and Aspergillus parasiticus in wheat flour by SYBR® Green quantitative PCR. Int J Food Microbiol. 145:121–125.
- Sharma KK, Pothana A, Prasad K, Shah D, Kaur J, Bhatnagar D, Chen ZY, Raruang Y, Cary JW, Rajasekaran K. 2018. Peanuts that keep aflatoxin at bay: a threshold that matters. Plant Biotechnol J. 16:1024–1033.
- Shen H, He X, Poovaiah CR, Wuddineh WA, Ma J, Mann DG, Wang H, Jackson L, Tang Y, Neal Stewart Jr C. 2012. Functional characterization of the switchgrass (Panicum virgatum) R2R3-MYB transcription factor PvMYB4 for improvement of lignocellulosic feedstocks. New Phytol. 193:121–136.
- Shen Y, Liu N, Li C, Wang X, Xu X, Chen W, Xing G, Zheng W. 2017. The early response during the interaction of fungal phytopathogen and host plant. Open Biol. 7:170057.
- Song H, Wang P, Li C, Han S, Zhao C, Xia H, Bi Y, Guo B, Zhang X, Wang X. 2017. Comparative analysis of NBS-LRR genes and their response to Aspergillus flavus in Arachis. PloS One. 12:e0171181.
- Soni P, Nayak SN, Kumar R, Pandey MK, Singh N, Sudini HK, Bajaj P, Fountain JC, Singam P, Hong Y. 2020. Transcriptome analysis identified coordinated control of key pathways regulating cellular physiology and metabolism upon Aspergillus flavus infection resulting in reduced aflatoxin production in groundnut. J Fungi. 6:370.
- Soni P, Pandey AK, Nayak SN, Pandey MK, Tolani P, Pandey S, Sudini HK, Bajaj P, Fountain JC, Singam P, et al. 2021. Global transcriptome profiling identified transcription factors, biological process, and associated pathways for pre-harvest aflatoxin contamination in groundnut. J Fungi. 7:413.
- Stracke R, Favory JJ, Gruber H, Bartelniewoehner L, Bartels S, Binkert M, Funk M, Weisshaar B, Ulm R. 2010. The Arabidopsis bZIP transcription factor HY5 regulates expression of the PFG1/MYB12 gene in response to light and ultraviolet-B radiation. Plant Cell Environ. 33:88–103.
- Van der Ent S, Van Wees SC, Pieterse CM. 2009. Jasmonate signaling in plant interactions with resistance-inducing beneficial microbes. Phytochemistry. 70:1581–1588.
- Variath MT, Janila P. 2017. Economic and academic importance of peanut. In: Varshney R, Pandey M, Puppala N, editors. The peanut genome. Compendium of plant genomes. Cham: Springer. p. 7–26.
- Wang H, Lei Y, Yan L, Cheng K, Dai X, Wan L, Guo W, Cheng L, Liao B. 2015. Deep sequencing analysis of transcriptomes in Aspergillus flavus in response to resveratrol. BMC Microbiol. 15:1–14.
- Wang T, Chen X-P, Li H-F, Liu H-Y, Hong Y-B, Yang Q-L, Chi X-Y, Yang Z, Yu S-L, Li L. 2013. Transcriptome identification of the resistance-associated genes (RAGs) to Aspergillus flavus infection in pre-harvested peanut (Arachis hypogaea). Funct Plant Biol. 40:292–303.
- Wang T, Zhang E, Chen X, Li L, Liang X. 2010. Identification of seed proteins associated with resistance to pre-harvested aflatoxin contamination in peanut (Arachis hypogaea L). BMC Plant Biol. 10:1–11.
- Wang Y, Cheng X, Shan Q, Zhang Y, Liu J, Gao C, Qiu J-L. 2014. Simultaneous editing of three homoeoalleles in hexaploid bread wheat confers heritable resistance to powdery mildew. Nat Biotechnol. 32:947–951.
- Wang Z, Yan S, Liu C, Chen F, Wang T. 2012. Proteomic analysis reveals an aflatoxin-triggered immune response in cotyledons of Arachis hypogaea infected with Aspergillus flavus. J Proteome Res. 11:2739–2753.
- Xuanqiang L, Guiyuan Z, Ruichi P. 2001. Changes of some biochemical substances in peanut seeds under infection of Aspergillus flavus and their role in resistance to seed invasion. Chin J Oil Crop Sci. 23:26–30.
- Yogendra KN, Sarkar K, Kage U, Kushalappa AC. 2017. Potato NAC43 and MYB8 mediated transcriptional regulation of secondary cell wall biosynthesis to contain Phytophthora infestans infection. Plant Mol Biol Rep. 35:519–533.
- Yoon Y, Seo DH, Shin H, Kim HJ, Kim CM, Jang G. 2020. The role of stress-responsive transcription factors in modulating abiotic stress tolerance in plants. Agronomy. 10:788.
- Yu X, Li Z, Zhao M, Lau SCS, Tan HR, Teh WJ, Yang H, Zheng C, Zhang Y. 2019. Quantification of aflatoxin B1 in vegetable oils using low temperature clean-up followed by immuno-magnetic solid phase extraction. Food Chem. 275:390–396.
- Yuan X, Wang H, Cai J, Li D, Song F. 2019. NAC transcription factors in plant immunity. Phytopathol Res. 1:1–13.
- Zhang Z, Feechan A, Pedersen C, Newman MA, Jl Q, Olesen KL, Thordal-Christensen H. 2007. A SNARE-protein has opposing functions in penetration resistance and defence signalling pathways. Plant J. 49:302–312.
- Zhao C, Zhao S, Hou L, Xia H, Wang J, Li C, Li A, Li T, Zhang X, Wang X. 2015. Proteomics analysis reveals differentially activated pathways that operate in peanut gynophores at different developmental stages. BMC Plant Biol. 15:1–12.
- Zhao X, Li C, Yan C, Wang J, Yuan C, Zhang H, Shan S. 2019. Transcriptome and proteome analyses of resistant preharvest peanut seed coat in response to Aspergillus flavus infection. Electron J Biotechnol. 39:82–90.
- Zhao ZX, Xu YJ, Lei Y, Li Q, Zhao JQ, Li Y, Fan J, Xiao S, Wang WM. 2021. ANNEXIN 8 negatively regulates RPW8. 1-mediated cell death and disease resistance in arabidopsis. J Integr Plant Biol. 63:378–392.