
ABSTRACT
Elevated CO2 (eCO2) increase plant biomass and might lead to nutritional losses. The results showed that eCO2 under Fe-deficiency stimulates root dry weight from 0.37–0.80 g plant−1 and shoot dry weight from 0.82–2.10 g plant−1, without compromising root/shoot ratio. Besides, eCO2 improved the chlorophyl content of Fe-deficient plants. However, downregulation of photosynthesis, reduction in stomatal conductance and transpiration rate, and an increase in water-use efficiency was observed due to eCO2. Moreover, under Fe-deficiency, eCO2 decreased K and Mg in roots, and Mg in leaves, whereas increased P and Zn in roots and leaves. In Fe-sufficient plants, eCO2 increased K, P, Mn, Zn and Fe in leaves and did not change the concentration in roots. The Fe-deficiency-induced responses in roots, including the increase in FCR activity, and the expression of Fe-uptake genes were stimulated by eCO2, but were not sufficient to increase Fe concentration in Fe-deficient plants.
KEYWORDS:
1. Introduction
The global atmospheric carbon dioxide concentration increased by 48% since the beginning of the industrial era from 280 ppm to the current level of about 420 ppm, (http://www.esrl.noaa.gov/gmd/ccgg/trends/) and is predicted to reach 700‒1000 ppm by the end of this century (IPCC Citation2014). This steady increase in atmospheric CO2 is responsible for global climate change affecting crops worldwide (Bencke-Malato et al. Citation2019). Therefore, one of the great questions for agriculture in the upcoming future is to improve biomass production and plant product quality, and atmospheric CO2 concentration and regulation of mineral concentrations are major actors in this scenario (Briat et al. Citation2015). Soybean is a consistent source of nutrients as consumption of soybean-based products is on the rise due to its high content of proteins, fatty acids, natural antioxidants, vitamins, and minerals (Zheng et al. Citation2020). Previous findings have demonstrated that elevated CO2 (eCO2) promotes photosynthetic CO2 assimilation rate in C3 plants, increasing biomass and yield (Haase et al. Citation2008; Leakey et al. Citation2009; Bishop et al. Citation2015a; Kimball Citation2016; Bencke-Malato et al. Citation2019). For example, Kimball (Citation2016) showed that biomass and seed yield increased in C3 species under FACE conditions. Yields of C3 grain crops increased by an average of 19%. In another study, eCO2 stimulated above-ground biomass by 22% and seed yield by 9% among 18 soybean genotypes grown under field conditions (Bishop et al. Citation2015b). Plants exposed to eCO2 changed their root size and activity to increase nutrient uptake and translocation for a given nutrient (Pérez-López et al. Citation2014 Guo et al. Citation2015). The results from Guo et al. (Citation2015) in rice suggest that eCO2 might support the translocation of calcium (Ca), magnesium (Mg), iron (Fe), zinc (Zn), and manganese (Mn) from soil to stem and panicle. A great deal of attention has been dedicated to the effects of eCO2 on the nutrient quality of crop plants and expanding this knowledge to Fe status is of particular interest. Fe is a crucial element of biomass production and plant quality due to its essential role in the structure and function of the photosynthetic electron transfer chain and chlorophyl synthesis (Briat et al. Citation2015). Besides, Fe intake for a significant proportion of the worldwide population is delivered by plant consumption (Smith et al. Citation2017). Even though the Fe concentration in soils regularly surpasses plant requirements, its bioavailability is often limited, predominantly in calcareous soils representing 30% of cultivated soils (Jin et al. Citation2009). Furthermore, Fe is also the most commonly deficient micronutrient in the human diet, impacting roughly an estimated 2 billion people (Briat et al. Citation2015; Smith et al. Citation2017). Recent studies revealed that C3 plants, legumes, and maize have lower Fe concentrations ranging from 4–10% when grown at eCO2 (550 ppm) under field conditions (Myers et al. Citation2014). Similar findings were obtained by Loladze (Citation2014) in C3 plants, reflecting foliar and edible tissues, FACE, and non-FACE studies. Consequently, Fe metabolism in higher plants is likely to be affected by the atmospheric CO2 concentration, and it is crucial to address the impact of eCO2 on plant Fe nutrition. Jin et al. (Citation2009) reported a relative increase in tomato biomass and the root/shoot ratio at eCO2 under Fe-limited and Fe-sufficient conditions. Under eCO2, the Fe-deficiency-induced responses in roots, including ferric chelate reductase (FCR) activity, proton secretion, subapical root hair development, and the expression of FER, FRO1, and IRT genes, were higher than in plants grown at aCO2. Also, eCO2 has a positive effect on biomass when Fe is limited in barley (Haase et al. Citation2008). Thus, understanding the Fe-uptake mechanisms and Fe-metabolism under eCO2 conditions is crucial for selecting nutrient-rich and more tolerant genotypes to Fe-deficiency (Morrissey and Guerinot Citation2009). Moreover, little is known about the interaction of eCO2 and Fe-deficiency in soybean plants, and the underlying mechanisms responsible for such changes. In plants, the Fe-uptake mechanism is divided into two different approaches: strategy I occur in nongraminaceous plants, and Fe3 + is reduced via a membrane-bound reductase to make it accessible for uptake by a Fe2 + transporter, and strategy II occurs in grasses which secrete phytosiderophores that readily bind Fe3 + , and these complexes are then transported back into the roots (Jin et al. Citation2009 Morrissey and Guerinot Citation2009). In the present study, soybean plants were grown in a hydroponic culture system to report the effects of the interaction of eCO2 and Fe-deficiency in the morphological, physiological, and molecular responses under controlled conditions. It was previously demonstrated in tomato (Jin et al. Citation2009) and barley (Haase et al. Citation2008) that eCO2 has a positive impact on plant biomass when Fe is limited. Here, we aimed to understand if eCO2 may have a positive effect on soybean growth under Fe-deficiency without impairing mineral accumulation, since Fe homeostasis and eCO2 could be linked to the interplay occurring among nutrient uptake and translocation.
2. Material and methods
2.1. Plant culture
Soybean (Glycine max cv ‘Winsconsin Black’) seeds were surface sterilized with 75% (v/v) ethanol, rinsed four times with ultra-pure water, and germinated at 25 °C in the dark for 5 days. Then, plants were transplanted to black plastic pots (5 L) filled with an aerated, full-strength nutrient solution with the following composition: 1.2 mM KNO3, 0.8 mM Ca(NO3)2, 0.3 mM MgSO4.7H2O, 0.2 mM NH4H2PO4, 25 μM CaCl2, 25 μM H3BO3, 0.5 μM MnSO4, 2 μM ZnSO4.H2O, 0.5 μM CuSO4.H2O, 0.5 μM MoO3, 0.1 μM NiSO4, and 20 μM Fe(III)-EDDHA. The solution was buffered with the addition of 1mM MES (pH 5.5) and changed every 3 days. Plants were grown in the controlled environment at 75% humidity with a daily cycle of 16 h at 25 °C (day) and 8 h at 20 °C (night). The daytime light intensity was 325 μmol s−1 m−2 of the photosynthetic photon flux density at the plant level. After 7 days of pre-treatment in the full-strength nutrient solution, plants were transferred to a nutrient solution with Fe(III)-EDDHA at 0.5 μM (Fe-deficiency) or 20 μM (Fe-sufficiency) for 12 days. The plants were grown at 400 ± 10 ppm (aCO2) or 800 ± 10 ppm (eCO2). The CO2 concentration was continuously monitored and maintained by an automated CO2 control system, which measured and adjusted the CO2 concentration from soybean planting to the end of the experiment.
2.2. Physiological parameters
At the end of the experiment, the chlorophyl content was evaluated using the first expanded trifoliate leaf with a chlorophyl meter (SPAD-502; Minolta). Then, plants were measured for length and separated into shoots and roots, and the material was dried at 70 °C until constant weight and stored for ICP-OES analysis. Each analysis was performed from 5 plants and mean values calculated.
2.3. Determination of FCR activity
Root FCR activity was measured as described by Vasconcelos et al. (Citation2006). The assays were performed by the spectrophotometric determination of Fe2 + chelated to BPDS (bathophenanthroline disulfonic acid). Plant roots were submerged in the assay solution containing: 1.5 mM KNO3, 1 mM Ca(NO3)2, 3.75 mM NH4H2PO4, 0.25 mM MgSO4, 25 μM CaCl2, 25 μM H3BO3, 2 μM MnSO4, 2 μM ZnSO4, 0.5 μM CuSO4, 0.5 μM H2MoO4, 0.1 μM NiSO4, 100 μM Fe(III)-EDTA, 100 μM BPDS, and buffered with 1 mM MES at pH5.5. The assays were conducted under dark conditions at room temperature for 60 min. Absorbance values were obtained spectrophotometrically at 535 nm, and the solution with no roots was used as blank. Rates of reduction were determined using the molar extinction coefficient of 22.14 mM−1cm−1. The assays were performed from 5 samples and mean values calculated.
2.4. Mineral analysis by ICP-OES
About 200 mg of the roots and leaves dried samples were mixed with 5 mL of 65% HNO3 (v/v) and 1 mL of H2O2 30% (v/v) in a Teflon reaction vessel and heated in a Speedwave TMMWS- 3+ (Berghof, Germany) microwave system. The digestion procedure was described in detail by Santos et al. (Citation2015), and the resulting solutions were diluted to 50 ml with ultra-pure water for further analysis. Determination of mineral concentrations was performed using the ICP-OES Optima7000 DV (Perkin Elmer, USA) with a radial configuration from five independent digestions of each plant organ from all the treatments. The assays were performed from 5 samples and mean values calculated.
2.5. Leaf gas exchange parameters
Gas exchange parameters were performed in the last fully expanded leaves, ten days after the Fe-treatment, using a portable photosynthesis system (LI-6400XT; LICOR, Inc.). The CO2 in the leaf chamber was set to match the CO2 treatment with a PPFD of 500 μmol photon m−2 s−1 at 25 °C. A/Ci curves were also measured, and data were analyzed using the PS-FIT software (http://www.life.illinois.edu/bernacchi/links.html). This software uses the leaf model of photosynthesis (Farquhar et al. Citation1980) to calculate the maximum rates of electron transport (Jmax) and maximum velocity of carboxylation by Rubisco (Vc,max). Moreover, the transpiration rate (Tr), stomatal conductance (gs), and water use efficiency (WUE = A/Tr) were determined. The assays were performed from 3 plants and mean values calculated.
2.6. Gene expression analysis
For gene expression analysis, root samples were frozen in liquid nitrogen and stored at ‒80 °C. About 100 mg of tissue was grounded in liquid nitrogen, and total RNA was extracted using a Qiagen RNeasy Plant Mini Kit (Qiagen, USA). Therefore, single-stranded cDNA was synthesized with the first-strand cDNA synthesis kit (Fermentas, USA) in a Thermal cycler (VWR, Doppio, Belgium), according to the manufacturer’s instructions. The mRNA levels were detected by the SYBR Green Supermix (Bio-Rad) with the following pairs of gene-specific primers: FER fw, 5’- GAACAAACGTGGTGGAAAA G-3’; rev, 5’- AACTGCACGTCACCATTCTT-3’; FRO2 fw, 5’-TGCTTGGACTCACACCA GAG-3’; rev, 5’-AGAGGTAGAAACCGGGGAGA-3’; Ferritin fw, 5’-CCCCTTATGCCTCTTTCCTC -3’; rev, 5’-GCTTTTCAGCGTGCTCTCTT-3’; IRT1 fw, 5’-GATTGCACCTGTGACA CAAA-3’; rev, 5’-CAGCAAAGGCCTTAACCATA-3’; DTM1 fw, 5’-GCCGCAAGAAACAGCTTATG-3’; rev, 5’-AGCTTCTTCCACGAGA ATCG-3’. The respective housekeeping genes were used as reference genes: Actin fw, 5’- ATCTTGACTGAGCGTGGTTATTCC-3’; rev, 5’- GCTGGTCCTGGCTGTCTCC-3’; and ELF1B fw, 5’-GTTGAAAAGCCAGGGGACA-3’; rev, 5’-TCTTACCCCTTGAGCGTGG-3’. FER and DMT1 gene sequences were searched in the NCBI database, and primers were designed using the Primer-Blast tool from NCBI with an expected PCR product of 100–200 bp. FRO2, ferritin, and IRT1 primer pairs were described by Santos et al. (Citation2015), and Actin and ELF1B by Wan et al. (Citation2017). qPCR reactions were performed on a Chromo4 thermocycler (Bio-Rad, Hercules, CA, USA) with the following reaction conditions: 10 min at 95 °C and 40 cycles with 15 s at 95 °C, 15s at 58 °C, and 15 s at 68 °C. The 2-ΔΔCT method (Livak and Schmittgen Citation2001) was used for the relative quantification of gene expression analysis. All the assays were performed with three biological and two technical replicates.
2.7. Organic acids and sugar analysis
The extraction protocol was described in detail by López-Millán et al. (Citation2009). About 100 mg of plant material was grounded using liquid nitrogen and suspended in 5 mM H2SO4, vortexed for 30 s, and then boiled for 30 min. The samples were centrifuged at 2320 x g for 10 min, the supernatant filtered through a 0.45 mm PTFE filter, and the volume adjusted to 2 ml and stored at ‒80 °C until further analysis. The HPLC system consisted of an ion exchange aminex HPX-87H Column (300×7.8 mm) (Bio-Rad, USA) maintained at an oven temperature of 40 °C and two detectors in series (Refractive Index and UV 210 nm; K-2301 and K-2501, Knauer, Germany). The mobile phase was 5 mM H2SO4 at a flow rate of 0.6 mL/min. The assays were performed from 5 samples, and mean values were calculated.
2.8. Statistical analysis
The data for each dependent variable was subjected to the two-way ANOVA at P < 0.05 in all cases. All statistical analyses were performed with SPSS software (SPSS version 26.0).
3. Results
3.1. Effects of eCO2 and fe-deficiency on chlorophyl synthesis, plant growth, and fe-uptake
After 12 days of plant growth at aCO2 and under Fe-deficiency (0.5 µM Fe-EDTA), the soybean leaves were chlorotic () with an average SPAD reading of 12.7 (a). However, leaves of plants grown in the same growth conditions but at eCO2 had SPAD readings of 19.9 (a), indicating that eCO2 conditions (P < 0.05; ) significantly improved the chlorophyl synthesis of plants grown in Fe-deficient conditions. In Fe-sufficient plants (20 µM Fe-EDTA) the chlorophyl content was also higher under eCO2 in comparison to aCO2 conditions (P < 0.05; a). The effects of CO2 and Fe-supply were statistically significant on SPAD readings (P < 0.001), with a significant CO2 x Fe interaction (P < 0.05, ). Moreover, in Fe-sufficient plants, the height was higher compared to Fe-deficient plants, and this effect was exacerbated in response to eCO2 (b). In hydroponic growth, root dry weight was increased at eCO2 by 66.4% in Fe-sufficient (P < 0.01) and by 119.7% in Fe-deficient (P < 0.001) plants, as demonstrated in a. Shoot dry weight (b) was also increased under eCO2 by 40.1% in Fe-sufficient (P < 0.001) and by 157.6% in Fe-deficient plants (P < 0.001). Furthermore, the root/shoot ratio (c) was not affected in Fe-deficient plants (P > 0.05) but increased in Fe-sufficient plants (P < 0.05) by 20.1% under eCO2 conditions. The effects of CO2 levels and Fe-supply were statistically significant on FCR activity (P < 0.001), with a significant CO2 x Fe interaction (P < 0.001, ). Therefore, FCR activity was induced in plants grown in Fe-deficiency, and this induction was higher when combined with aCO2 (). Contrastingly, FCR activity was higher under eCO2 conditions in Fe-sufficient conditions.
Figure 1. Soybean plants grown in nutrient solution at aCO2 (400 ppm) and eCO2 (800 ppm). After 7 days of pre-treatment in the complete nutrient solution, plants were transferred to Fe-sufficient (20 μM Fe-EDDHA) and Fe-deficient (0.5 μM Fe-EDDHA) conditions for 12 days.
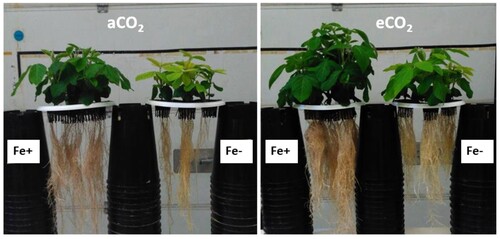
Figure 2. SPAD readings (a) and height (b) of soybean plants grown in the nutrient solution, depending on Fe-supply (0.5 and 20 μM Fe-EDDHA) and atmospheric CO2 concentration (400 and 800 ppm). Data are mean ± SEM (n = 5). *, Significant differences (P < 0.05) between aCO2 and eCO2 treatments.
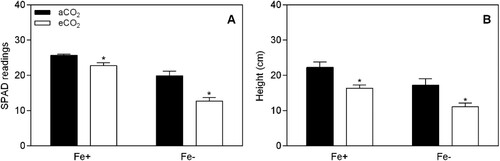
Figure 3. Root (a), shoot biomass (b) and root/shoot ratio (c) of soybean plants grown in the nutrient solution, depending on Fe-supply (0.5 and 20 μM Fe-EDDHA) and atmospheric CO2 concentration (400 and 800 ppm). Data are mean ± SEM (n = 5). *, Significant differences (P < 0.05) between aCO2 and eCO2 treatments.
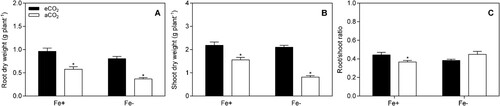
Figure 4. Effect of eCO2 on FCR activity in soybean plants grown in Fe-sufficient (20 μM Fe-EDDHA) and Fe-deficient (0.5 μM Fe-EDDHA) conditions. Data are mean ± SEM (n = 5). *, Significant differences (P < 0.05) between aCO2 and eCO2 treatments.
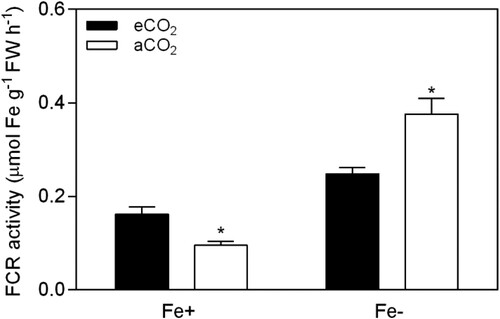
Table 1. Two-factorial ANOVA table for the effect of eCO2 and Fe-supply on leaf chlorophyl content (SPAD values), plant height (cm), plant biomass (root and shoot dry weight, g plant−1), root/shoot ratio, FCR activity (μmol Fe g−1 FW h–1), A (µmol m−2 s−1), gs (mol m−2s−1), Tr (mol m−2 s−1), WUE (µmol mol−1), Vc,max (µmol m−2 s−1), and Jmax (µmol m−2 s−1).
3.2. Effects of eCO2 and fe-deficiency on the photosynthetic parameters
Leaf photosynthetic assimilation rate (A) decreased in Fe-deficient conditions (P < 0.05; ) when compared to Fe-sufficient conditions. However, in Fe-sufficient and Fe-deficient plants the response of A was not affected by exposure to eCO2 (P > 0.05), with no significant CO2 x Fe interaction (P > 0.05, ). Also, eCO2 reduced stomatal conductance (gs) from 0.37–0.13 mol H2O m−2 s−1 in Fe-sufficient (P < 0.05) and from 0.30–0.12 mol H2O m−2 s−1 in Fe-deficient (P < 0.05) plants. The transpiration rate (Tr) also decreased by eCO2, in both Fe-supplies. The water-use efficiency (WUE) increased significantly from 2.23–4.76 mmol mol−1 (P < 0.01) in Fe-sufficient plants, and from 2.17–3.97 mmol mol−1 (P < 0.01) in Fe-limited plants due to exposure to eCO2. The A/Ci response curves showed a reduction in the Vc,max and in Jmax under eCO2 in Fe-sufficient and Fe-deficient plants (P < 0.05, ). However, the response of Vc,max and Jmax were not affected by Fe-supply (P > 0.05) but a significant CO2 x Fe interaction was found (P < 0.05, ).
Table 2. Effect of eCO2 on photosynthetic parameters of soybean plants grown in Fe-sufficient (20 μM Fe-EDDHA) and Fe-deficient (0.5 μM Fe-EDDHA) conditions.
3.3. Effects of eCO2 and fe-deficiency on the sugar and organic acid concentrations
In hydroponic culture, elevation of atmospheric CO2 did not affect sucrose concentration (P > 0.05) in roots and leaves of Fe-sufficient and Fe-deficient plants (). Moreover, eCO2 increased glucose concentration in roots of Fe-deficient plants (P < 0.05) and in leaves of Fe-sufficient plants (P < 0.05). Besides, fructose concentration increased in Fe-deficient and Fe-sufficient plants (P < 0.05) in both tissues analyzed due to CO2 enrichment. The effect of Fe-supply was not statistically significant on the carbohydrate responses (P > 0.05), as well as the CO2 x Fe interaction (P > 0.05, ). The citric acid concentration increased by the exposure to eCO2 from 13.64–17.40, and from 8.07–12.55 µmol g FW−1 in roots of Fe-sufficient and Fe-deficient plants, respectively. In leaves, citric acid was not affected under eCO2 (P > 0.05, ). At the end of the growth period, eCO2 increased malic acid concentration in roots from 25.57–41.33 in Fe-sufficient and from 11.85–22.13 µmol g FW−1 in Fe-deficient plants. By comparison, leaves of soybean plants grown in the same nutrient conditions, eCO2 only increased malic acid in Fe-sufficient plants from 40.11–60.54 µmol g FW−1. Moreover, the effect of Fe-supply was significant on citric and malic acid concentrations (P < 0.05, ).
Table 3. Effect of eCO2 on sugars and organics acids content (μmol gFW−1) of soybean plants grown in Fe-sufficient (20 μM Fe-EDDHA) and Fe-deficient (0.5 μM Fe-EDDHA) conditions.
Table 4. Analysis of variance for the effect of eCO2 and Fe-supply on sugar (μmol g FW−1), organic acid (μmol g FW−1), and mineral concentrations (μg g−1) in roots and leaves of soybean plants
3.4. Effects of eCO2 and fe-deficiency on the mineral concentrations
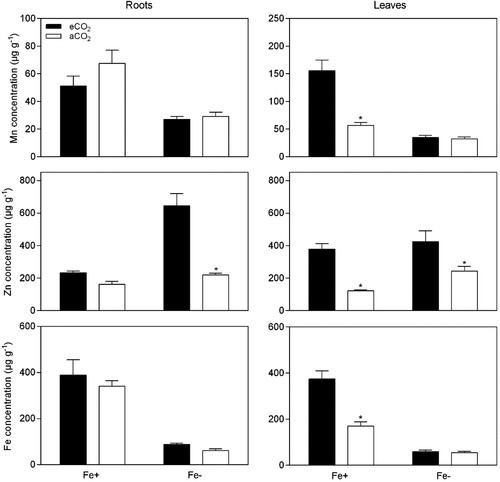
The mineral-based responses under different Fe-supplies in soybean plants were also influenced by eCO2, as demonstrated in and . Elevation of atmospheric CO2 concentration did not affect Ca concentration in root and leaf tissues, but it was significantly reduced in Fe-deficient plants (P < 0.05, ). eCO2 increased K concentration (P < 0.05) from 24.6–41.4 μg g−1 in leaves of Fe-sufficient plants, and decreased K concentration (P < 0.05) from 75.7–52.3 μg g−1 in roots of Fe-deficiency plants. The concentration of P was generally higher under eCO2 conditions (P < 0.05), except in roots of Fe-sufficient plants. Furthermore, eCO2 did not affect Mg concentration (P > 0.05) in Fe-sufficient plants, but a significant decrease was achieved in Fe-deficient plants (P < 0.05). Regarding to micronutrients, Mn concentration was not changed by CO2 treatment in Fe-deficient and Fe-sufficient plants (P > 0.05), apart from the increase in Mn concentration occurring in leaves of Fe-sufficient plants (P < 0.05) from 56.7–155.8 μg g−1. CO2 enrichment led to a significant increase in Zn concentration, except in roots of Fe-sufficient plants (P > 0.05). The concentration of Fe was significantly higher in Fe-sufficient plants as expected and was not changed by the CO2 treatment, excluding the leaves of Fe-sufficient plants.
Figure 5. Effect of eCO2 on the macronutrient concentrations from soybean plants grown in Fe-sufficient (20 μM Fe-EDDHA,) and Fe-deficient (0.5 μM Fe-EDDHA) conditions. Data are mean ± SEM (n = 5). *, Significant differences (P < 0.05) between aCO2 and eCO2 treatments.
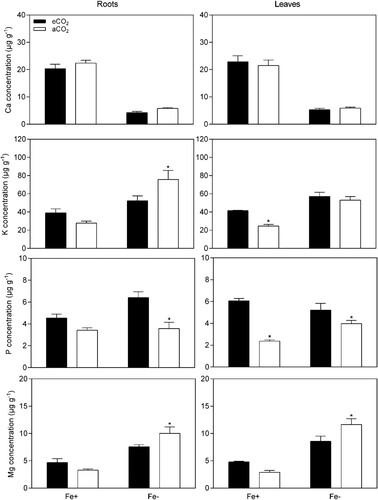
Figure 6. Effect of eCO2 on the micronutrient concentrations from soybean plants grown in Fe-sufficient (20 μM Fe-EDDHA) and Fe-deficient (0.5 μM Fe-EDDHA) conditions. Data are mean ± SEM (n = 5). *, Significant differences (P < 0.05) between aCO2 and eCO2 treatments.
3.5. Effects of eCO2 and fe-deficiency on the expression of genes involved in fe-uptake mechanisms
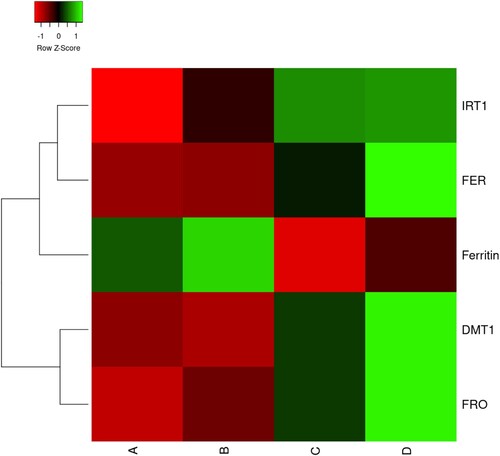
The effects of eCO2 and Fe-deficiency on genes related to the Fe-uptake mechanisms – DMT1, FER, FRO2, IRT1, and ferritin – were analyzed in soybean roots using qPCR. Overall, higher gene expression levels were associated with Fe-deficiency responses as demonstrated in . In the case of the FRO2 gene, the expression differed between treatments, with higher expression levels observed in Fe-deficiency plants, and this change was higher under eCO2 conditions. Similar findings were obtained in DMT1 and FER gene expression levels. Moreover, IRT1 gene expression was higher in Fe-deficient plants, but eCO2 did not affect the expression levels. Contrastingly, the ferritin gene expression was detected only in Fe-sufficient plants, and this change was higher under eCO2 conditions.
Figure 7. Heatmap of the expression profiles of DMT1, FRO2, ferritin, FER and IRT1 genes in roots of soybeans plants grown at Fe-sufficient and aCO2 (A), Fe-sufficient and eCO2 (B), Fe-deficient and aCO2 (C), Fe-deficient and eCO2 (D) from three independent replicates.
4. Discussion
The beneficial effects of eCO2 on stimulating plant growth and biomass accumulation of several crops have been widely studied (Ainsworth et al. Citation2002; Long et al. Citation2004; Ziska and Bunce Citation2007; Bunce Citation2008; Vasconcelos et al. Citation2014 Bunce Citation2015; Santos et al. Citation2015; Bishop et al. Citation2015b; Bunce Citation2016; Kimball Citation2016). However, there is a lack of information about the influence of eCO2 on the changing demands for Fe-supply and is crucial to consider how eCO2 affects and might alleviate the Fe-deficiency responses. In this sudy, we treated soybean plants with limited (0.5 μM) and sufficient (20 μM) Fe-supply under eCO2 conditions. Supplying soybean plants with 0.5 µM Fe is sufficiently low to induce FCR activity. Furthermore, soybean plants revealed clear Fe chlorosis symptoms in young leaves at aCO2 but not at eCO2 conditions, which affected biomass accumulation and growth (). An increase from 0.5–20 μM Fe in hydroponic solution alleviated the chlorosis symptoms in soybean plants. As reported for other species (Wu et al. Citation2004; Bourgault et al. Citation2016; Bunce Citation2016; Bourgault et al. Citation2017), soybean growth increased at eCO2 conditions, as well as the requirement for nutrients and water, to sustain such CO2-based stimulation. Consequently, more nutrients will need to be applied, or plants will have to become more effective at obtaining those nutrients from the soil (Jin et al. Citation2009). In this study, eCO2 led to an increase in biomass, even at reduced Fe-supply, similar to plants grown at Fe-sufficient conditions (). Therefore, in Fe-sufficient plants, root and shoot dry weight increased by 66.4% and 40.1%, respectively, whereas in Fe-deficient plants increased by 119.7% and 157.4% due to eCO2 conditions (). Similar findings were reported in tomato (Jin et al. Citation2009) and barley (Haase et al. Citation2008) grown at eCO2 with or without Fe-supply. The root/shoot ratio increased in Fe-sufficient plants due to eCO2 and was not affected in Fe-deficient plants, suggesting that the biomass accumulation changed with Fe-supply. The reason proposed might be that under eCO2 and Fe-supply, upregulation of the root over the shoot growth was observed appearing in a higher root/shoot ratio. Also, eCO2 alleviated the Fe-deficiency chlorosis symptoms, as demonstrated by the increase in chlorophyl concentration (). The driving force for increased soybean growth at eCO2 is a higher A (Ainsworth et al. Citation2002). We noticed that the A was not changed due to CO2 enrichment and could not predict the magnitude of biomass increase. However, the photosynthetic capacity was affected by Fe-supply (P < 0.001, ), with a concomitant decrease in Fe-deficient plants of about 20% (). Therefore, under eCO2 photosynthetic acclimation was observed and attributed to a decrease in Vc,max, and Jmax. Nevertheless, despite acclimation of photosynthetic capacity, biomass production is greater in plants exposed to eCO2. It is generally accepted that Fe-deficiency decreased photosynthesis in higher plants (Pestana et al. Citation2001 Jiang et al. Citation2007), since the Fe-status is a crucial parameter that affects metabolic changes, photosynthesis, and consequently plant growth at eCO2 (Briat et al. Citation2015). eCO2 reduces the transpiration-driven mass flow due to the stomatal closure (Leakey et al. Citation2009; Prior et al. Citation2010). In our study, eCO2 decreased the gs by 60−64.9% and Tr by 44.7−52.9% compared to aCO2 conditions (). The decrease in gs at eCO2 was associated with higher WUE and consistent with previous studies (Prior et al. Citation2010; Zheng et al. Citation2020). Our results suggested that soybean plants may have increased drought tolerance under eCO2 conditions. The decrease in the Tr might be a modification to maximize the carbon fixation under eCO2 conditions (Jauregui et al. Citation2015). The carbohydrate accumulation, mainly glucose and fructose, which are assimilates from photosynthesis, exhibited significant variation with eCO2 in leaf and root tissues resulting in differential carbon allocation, as demonstrated in . Therefore, eCO2 increased carbohydrate accumulation independently of Fe-supply, while an increase of photosynthesis capacity was not confirmed. A possible reason for this phenomenon, at eCO2, is that plants exceed what they are capable of using or distributing to sinks, increasing the carbohydrates levels, and leading to feedback inhibition of photosynthesis (Thompson et al. Citation2017).
Furthermore, the results showed a differential variation of sugars in plant tissues, but this variation was independent of Fe-supply (P > 0.05, ). Therefore, variation in nutrient uptake mechanisms should be less or partially influenced by sugars under Fe-deficiency. However, there are new insights on sugar sensing and signaling pathways of how plants are influenced by the higher sugars content produced under eCO2 conditions (Thompson et al. Citation2017). Sugars are recognized to crosstalk with hormones (e.g. auxin, nitric oxide and ethylene) and act on gene regulation and therefore modify nutrient uptake and transport, among other functions (Thompson et al. Citation2017). Hindt and Guerinot (Citation2012) proposed a model of the Fe-deficiency response, where auxin, ethylene, and nitric oxide were involved as positive regulators of the Fe acquisition genes FIT, FRO2, and IRT1. A recent study of Lin et al. (Citation2016) proposed sucrose as the upstream signaling molecule of auxins, causing an increase in auxin and a subsequent increase in nitric oxide, ultimately causing FIT-mediated transcriptional regulation of FRO2 and IRT1 genes and inducing Fe-uptake. In this study, soybean plants allocate greater amounts of sugars (mainly glucose and frutose) to root and leaf tissues during exposure to eCO2 conditions, which might cause an imbalance in carbon and nitrogen metabolism. Therefore, Fe-deficiency signals with sugar variation induced by eCO2 conditions might act in concert and affect Fe-uptake mechnisms. Besides, if these genes are regulated by the increase of sugars, then it stands to reason that an increase in sugar content in roots mediated by exposure to eCO2 might also induce Fe-deficiency induced responses. The levels of organic acids increased at eCO2 in roots, and remained almost unchanged in leaves. The increased levels of carbohydrates and organic acids in plants exposed to eCO2 indicates a higher energy condition capable of maintaining the greater carbon allocation (Jauregui et al. Citation2015). Moreover, Pavlovic et al. (Citation2013) demonstrated that increased concentration of citrate and malate in the root tissues of cucumber was also important in alleviating Fe deficient responses. Since eCO2 and sugars increase plant root growth, it was expected greater uptake of nutrients, thus alleviating nutrient deficiencies, however, there are other mechanisms that are affected by eCO2 that lead to nutrient deficiencies (Thompson et al. Citation2017). The influence of eCO2 and Fe-deficiency, on plant mineral concentrations, were also addressed. The roots and leaves were differentially affected by eCO2 and Fe-supply, as described in and . Overall, eCO2 increased K, P, Mn, Zn, and Fe concentrations in leaves of Fe-sufficient plants, and P and Zn in Fe-deficient plants but did not affect the other minerals. In roots of Fe-sufficient plants, the mineral concentrations were not affected by eCO2, whereas in Fe-deficient plants, eCO2 increased P and Zn, and Ca, Mn, and Fe remained unchanged. Consequently, our results suggested that eCO2 can induce the accumulation of minerals particularly in soybean leaves and at Fe-sufficient conditions probably indicating that the mineral uptake and upward transport by soybean roots was not restricted. As also reported by others (Haase et al. Citation2008; Jin et al. Citation2009; Guo et al. Citation2015) CO2 enrichment could considerably increase the mineral uptake by the roots promoting the transport from soil to leaves. Also, it is recognized that increase in biomass at eCO2 changes the demands for nutrients (Seneweera Citation2011). In this study, with a consistent supply of nutrients under flooded conditions, the bioavailability was relatively higher to maintain that nutrient supply under eCO2. Thus, the increase in the root/shoot ratio, mainly in Fe-sufficient plants, under eCO2 can promote nutrient uptake and possibly lead to higher nutrient concentrations under eCO2 conditions. Also, we found a decrease in K (roots) and Mg (roots and leaves) in Fe-deficient plants. This reduction could be attributed to the unbalanced mineral translocation from the roots to the leaves or by differential mineral uptake.
The adaptation of soybean plants to Fe-deficiency under eCO2 conditions was also demonstrated by evaluating the expression of genes involved in Fe-uptake and the activity of root FCR. It was reported in tomato and Arabidopsis, that the FER gene is upregulated by Fe-deficiency and encodes a root-specific bHLH transcription factor regulating the expression of some Fe-responsive genes, such as the ferric chelate reductase FRO2 and the transporter IRT1 (Connolly et al. Citation2003 Jin et al. Citation2009; Paolacci et al. Citation2014). In the present study, we found typical Fe-deficiency responses in soybean plants grown with different Fe-supplies at eCO2 under controlled conditions. In agreement with previous findings (Jin et al. Citation2009), we found that FCR activity increased in response to Fe-deficiency. Moreover, DMT1, FER, FRO2, and IRT1 gene expression levels were also upregulated by Fe-deficiency, and this phenomenon usually increased by exposure to eCO2 (). Graziano and Lamattina (Citation2007) argued that these are crucial Fe-deficiency responses, but they are not sufficient to significantly increase Fe concentration in Fe-deficient plants (). Furthermore, expression of the ferritin protein gene increased in Fe-sufficient plants, particularly at eCO2 conditions. Iron homeostasis is strongly dependent on ferritin expression levels produced in response to Fe as previously demonstrated (Wei and Theil Citation2000; Arnaud et al. Citation2006; Briat et al. Citation2010). Fe homeostasis has to be precisely controlled, to prevent starvation that impairs the metabolism, and to avoid excess that may lead to cell death (Arnaud et al. Citation2006). Therefore, at eCO2 conditions Fe-sufficient plants have more Fe content in their roots (), and this could be a strategy (i.e. increasing ferritin expression) that plants use to control the Fe excess.
5. Conclusion
We have demonstrated that changes in CO2 concentration and Fe-supply can induce a set of morphological, physiological, and molecular responses in soybean plants. CO2 enrichment has a decisive influence on the adaptation to Fe-deficiency in soybean plants. According to our results, biomass accumulation was significantly increased by eCO2 irrespective of Fe-supply. Therefore, our results suggest that eCO2 alleviated symptoms of Fe-deficiency and might support biomass increase in plants grown in calcareous soils, at least during plant's earlier developmental stages, which is usually the most sensitive to Fe-deficiency. However, it would be interesting to replicate the responses under eCO2 of soybean plants grown on alkaline and calcareous soils which can induce Fe-deficiency chlorosis. Improved acquisition of several minerals under sufficient Fe-supply may suggest that eCO2 can support the unbalanced translocation of minerals to the leaves. eCO2 also mitigates the Fe-deficiency-induced chlorosis and enhances Fe-acquisition mechanisms but they are not sufficient to increase the Fe-status of plants grown in Fe-deficient conditions. It will be meaningful to understand if these observed effects will be sustained under a longer-term exposure and what will be the reported influence of eCO2 on nutritional value of soybean grains.
Disclosure statement
No potential conflict of interest was reported by the author(s).
Data availability statement
The data that support the findings of this study are available from the corresponding author, José C. Soares, upon reasonable request.
Additional information
Funding
Notes on contributors
Manuela Pintado
Manuela Pintado is an Associate Professor at Escola Superior de Biotecnologia, Universidade Católica Portuguesa, and director of the CBQF. She works in the areas of by–products and waste valorization, production and characterization of bioactive compounds, functional foods and natural antimicrobials.
Marta W. Vasconcelos
Marta W. Vasconcelos is Assistant Professor at Escola Superior de Biotecnologia, Universidade Católica Portuguesa. She focuses mainly on plant nutrition and genetics, but also on biotic and abiotic stress in agronomic and forestry species.
References
- Ainsworth EA, Davey PA, Bernacchi CJ, Dermody OC, Heaton EA, Moore DJ, Morgan PB, Naidu SL, Yoo Ra HS, Zhu XG. 2002. A meta-analysis of elevated [CO2] effects on soybean (Glycine max) physiology, growth and yield. Glb Chg Bio. 8:695–709.
- Arnaud N, Murgia I, Boucherez J, Briat JF, Cellier F, Gaymard F. 2006. An iron-induced nitric oxide burst precedes ubiquitin-dependent protein degradation for Arabidopsis AtFer1 ferritin gene expression. J Biol Chem. 281:23579–23588.
- Bencke-Malato M, De Souza AP, Ribeiro-Alves M, Schmitz JF, Buckeridge MS, Alves-Ferreira M. 2019. Short-term responses of soybean roots to individual and combinatorial effects of elevated [CO2] and water deficit. Plant Sci. 280:283–296.
- Bishop KA, Betzelberger AM, Long SP, Ainsworth EA. 2015a. Is there potential to adapt soybean (Glycine max merr.) to future [CO(2)]? An analysis of the yield response of 18 genotypes in free-air CO(2) enrichment. Plant, Cell & Environ. 38:1765–1774.
- Bishop KA, Betzelberger AM, Long SP, Ainsworth EA. 2015b. Is there potential to adapt soybean (Glycine max merr.) to future [CO2]? An analysis of the yield response of 18 genotypes in free-air CO2 enrichment. Plant Cell Environ. 38:1765–1774.
- Bourgault M, Brand J, Tausz M, Fitzgerald GJ. 2016. Yield, growth and grain nitrogen response to elevated CO2 of five field pea (pisum sativum L.) cultivars in a low rainfall environment. Field Crops Res. 196:1–9.
- Bourgault M, Brand J, Tausz-Posch S, Armstrong RD, O’leary GL, Fitzgerald GJ, Tausz M. 2017. Yield, growth and grain nitrogen response to elevated CO2 in six lentil (lens culinaris) cultivars grown under free Air CO2 enrichment (FACE) in a semi-arid environment. Eur J Agron. 87:50–58.
- Briat J-F, Dubos C, Gaymard F. 2015. Iron nutrition, biomass production, and plant product quality. Trends Plant Sci. 20:33–40.
- Briat J-F, Ravet K, Arnaud N, Duc C, Boucherez J, Touraine B, Cellier F, Gaymard F. 2010. New insights into ferritin synthesis and function highlight a link between iron homeostasis and oxidative stress in plants. Ann Bot. 105:811–822.
- Bunce JA. 2008. Contrasting responses of seed yield to elevated carbon dioxide under field conditions within phaseolus vulgaris. Agr Ecosyst Environ. 128:219–224.
- Bunce JA. 2015. Elevated Carbon Dioxide effects on reproductive phenology and seed yield among soybean cultivars. Crop Sci. 55:339–343.
- Bunce JA. 2016. Responses of soybeans and wheat to elevated CO2 in free-air and open top chamber systems. Field Crops Res. 186:78–85.
- Connolly EL, Campbell NH, Grotz N, Prichard CL, Guerinot ML. 2003. Overexpression of the FRO2 ferric chelate reductase confers tolerance to growth on low iron and uncovers posttranscriptional control. Plant Physiol. 133:1102–1110.
- Farquhar GD, Von Caemmerer S, Berry JA. 1980. A biochemical model of photosynthetic CO2 assimilation in leaves of C3 species. Planta. 149:78–90.
- Graziano M, Lamattina L. 2007. Nitric oxide accumulation is required for molecular and physiological responses to iron deficiency in tomato roots. Plant J. 52:949–960.
- Guo J, Zhang M-Q, Wang X-W, Zhang W-J. 2015. A possible mechanism of mineral responses to elevated atmospheric CO2 in rice grains. J Integr Agric. 14:50–57.
- Haase S, Rothe A, Kania A, Wasaki J, Römheld V, Engels C, Kandeler E, Neumann G. 2008. Responses to Iron Limitation in Hordeum vulgare L. as affected by the atmospheric CO2 concentration. J Environ Qual. 37:1254–1262.
- Hindt MN, Guerinot ML. 2012. Getting a sense for signals: regulation of the plant iron deficiency response. Biochim Biophys Acta Mol Cell Res. 1823:1521–1530.
- HTTP://WWW.ESRL.NOAA.GOV/GMD/CCGG/TRENDS/. [Accessed October, 11 2020].
- HTTP://WWW.LIFE.ILLINOIS.EDU/BERNACCHI/LINKS.HTML.
- IPCC 2014. IPCC, 2014: Climate Change 2014: Synthesis Report. Contribution of Working Groups I, II and III to the Fifth Assessment Report of the Intergovernmental Panel on Climate Change.
- Jauregui I, Aparicio-Tejo PM, Avila C, Rueda-López M, Aranjuelo I. 2015. Root and shoot performance of Arabidopsis thaliana exposed to elevated CO2: A physiologic, metabolic and transcriptomic response. J Plant Physiol. 189:65–76.
- Jiang CD, Gao HY, Zou Q, Shi L. 2007. Effects of iron deficiency on photosynthesis and photosystem II function in soybean leaf. Zhi Wu Sheng Li Yu Fen Zi Sheng Wu Xue Xue Bao. 33:53–60.
- Jin CW, Du ST, Chen WW, LI GX, Zhang YS, Zheng SJ. 2009. Elevated Carbon Dioxide improves plant iron nutrition through enhancing the iron-deficiency-induced responses under iron-limited conditions in tomato. Plant Physiol. 150:272–280.
- Kimball BA. 2016. Crop responses to elevated CO2 and interactions with H2O, N, and temperature. Curr Opin Plant Biol. 31:36–43.
- Leakey AD, Ainsworth EA, Bernacchi CJ, Rogers A, Long SP, Ort DR. 2009. Elevated CO2 effects on plant carbon, nitrogen, and water relations: six important lessons from FACE. J Exp Bot. 60:2859–2876.
- Lin XY, Ye YQ, Fan SK, Jin CW, Zheng SJ. 2016. Increased sucrose accumulation regulates Iron-Deficiency responses by promoting auxin signaling in Arabidopsis plants. Plant Physiol. 170:907–920.
- Livak KJ, Schmittgen TD. 2001. Analysis of relative gene expression data using real-time quantitative PCR and the 2(-Delta Delta C(T)) method. Methods. 25:402–408.
- Loladze I. 2014. Hidden shift of the ionome of plants exposed to elevated CO₂ depletes minerals at the base of human nutrition. ELIFE. 3:e02245–e02245.
- Long SP, Ainsworth EA, Rogers A, Ort DR. 2004. Rising atmospheric carbon dioxide: plants FACE the future. Annu Rev Plant Biol. 55:591–628.
- López-Millán A, Morales F, Gogorcena Y, Abadía A, Abadía J. 2009. Metabolic responses in iron deficient tomato plants. J Plant Physiol. 166: 375–384.
- Morrissey J, Guerinot ML. 2009. Iron uptake and transport in plants: the good, the bad, and the ionome. Chem Rev. 109:4553–4567.
- Myers SS, Zanobetti A, Kloog I, Huybers P, Leakey ADB, Bloom AJ, Carlisle E, Dietterich LH, Fitzgerald G, Hasegawa T, et al. 2014. Increasing CO2 threatens human nutrition. Nature. 510:139–142.
- Paolacci AR, Celletti S, Catarcione G, Hawkesford MJ, Astolfi S, Ciaffi M. 2014. Iron deprivation results in a rapid but not sustained increase of the expression of genes involved in iron metabolism and sulfate uptake in tomato (solanum lycopersicum L.) seedlings. J Integr Plant Biol. 56:88–100.
- Pavlovic J, Samardzic J, Maksimović V, Timotijevic G, Stevic N, Laursen KH, Hansen TH, Husted S, Schjoerring JK, Liang Y, Nikolic M. 2013. Silicon alleviates iron deficiency in cucumber by promoting mobilization of iron in the root apoplast. New Phytol. 198:1096–1107.
- Pérez-López U, Miranda-Apodaca J, Mena-Petite A, Muñoz-Rueda A. 2014. Responses of nutrient dynamics in barley seedlings to the interaction of salinity and carbon dioxide enrichment. Environ Exp Bot. 99:86–99.
- Pestana M, David M, De Varennes A, Abadía J, Faria EA. 2001. Responses of “newhall” orange trees to iron deficiency in hydroponics: effects on leaf chlorophyll, photosynthetic efficiency, and root ferric chelate reductase activity. J Plant Nutr. 24:1609–1620.
- Prior SA, Runion GB, Rogers HH, Arriaga FJ. 2010. Elevated atmospheric carbon dioxide effects on soybean and sorghum gas exchange in conventional and no-tillage systems. J Environ Qual. 39:596–608.
- Santos CS, Roriz M, Carvalho SMP, Vasconcelos MW. 2015. Iron partitioning at an early growth stage impacts iron deficiency responses in soybean plants (Glycine max L.). Front Plant Sci. 6:325.
- Seneweera S. 2011. Effects of elevated CO2 on plant growth and nutrient partitioning of rice (oryza sativa L.) at rapid tillering and physiological maturity. J Plant Interact. 6:35–42.
- Smith M, Golden C, Myers S. 2017. Potential rise in iron deficiency due to future anthropogenic carbon dioxide emissions. GeoHealth. 1:248–257.
- Thompson M, Gamage D, Hirotsu N, Martin A, Seneweera S. 2017. Effects of elevated carbon dioxide on photosynthesis and carbon partitioning: A perspective on root sugar sensing and hormonal crosstalk. Front Physiol. 8:578.
- Vasconcelos M, Clemente T, Grusak M. 2014. Evaluation of constitutive iron reductase (AtFRO2) expression on mineral accumulation and distribution in soybean (Glycine max. L). Front Plant Sci. 5:112.
- Vasconcelos M, Eckert H, Arahana V, Graef G, Grusak MA, Clemente T. 2006. Molecular and phenotypic characterization of transgenic soybean expressing the Arabidopsis ferric chelate reductase gene, FRO2. Planta. 224:1116–1128.
- Wan Q, Chen S, Shan Z, Yang Z, Chen L, Zhang C, Yuan S, Hao Q, Zhang X, Qiu D, et al. 2017. Stability evaluation of reference genes for gene expression analysis by RT-qPCR in soybean under different conditions. PloS one. 12:e0189405–e0189405.
- Wei J, Theil EC. 2000. Identification and characterization of the iron regulatory element in the ferritin gene of a plant (soybean). J Biol Chem. 275:17488–17493.
- Wu D-X, Wang G-X, Bai Y-F, Liao J-X. 2004. Effects of elevated CO2 concentration on growth, water use, yield and grain quality of wheat under two soil water levels. Agric Ecosyst Environ. 104:493–507.
- Zheng G, Chen J, Li W. 2020. Impacts of CO2 elevation on the physiology and seed quality of soybean. Plant Diversity. 42:44–51.
- Ziska LH, Bunce JA. 2007. Predicting the impact of changing CO2 on crop yields: some thoughts on food. New Phytol. 175:607–618.