
ABSTRACT
This study sought to identify the mechanism underlying the response to chitosan at the posttranslational level. Khao Dawk Mali 105 seeds were soaked in 40 mg l−1 of chitosan, and leaves of 2- and 4-week-old seedlings were sprayed with chitosan before starting osmotic stress conditions. Chitosan induced resistance to osmotic stress by enhancing shoot fresh and dry weights and maintained increased photosynthetic pigments. Leaf phosphoproteomes were examined using gel-free LC-MS/MS. Of the 60 phosphoproteins showed a significant difference in protein expressions under osmotically-stressed plants treated with chitosan. More than 40% of the phosphoproteins involved in signaling pathways, including OsCML12 calmodulin-related calcium sensor protein, ubiquitin carboxyl-terminal hydrolase 15, U-box domain-containing protein 45, HEAT repeat family protein, BRCA1 C terminus domain-containing protein, pectinesterase, protein kinase domain-containing protein, and receptor-like protein kinase. Chitosan enhanced rice seedling growth and drought resistance via multiple complex networks, including metabolism, transport, transcription, and signaling under osmotic stress.
1. Background
Drought is a major abiotic stress that affects plant growth and, depending on the developmental timing, can significantly reduce crop production (Kanya et al. Citation2019). Notably, the ongoing changes in the global climate may potentially increase osmotic deficits (Lamaoui et al. Citation2018). Rice (Oryza sativa L.), the most important crop worldwide, is the main staple food source of more than half of the global population (Wu et al. Citation2004). Areas in Asia dedicated to rice production (approximately 130 million ha) are under constant threat from abiotic stresses, especially drought. These areas, consisting of irrigated and rainfed lowlands, account for more than 85% of total rice production globally (Ali et al. Citation2006). Therefore, improved drought resistance against temperature fluctuations is crucial to the production of high-quality rice. The development of conventional breeding of drought-tolerant rice cultivars is a feasible strategy to avoid drought stress-induced yield losses. However, the lack of genetic data and manipulation methods remains problematic. Exogenous compounds, such as putrescine, spermine, spermidine (Ndayiragije and Lutts Citation2006), and glucose (Cha-um et al. Citation2007), have the potential to acclimatize plants under osmotic stress. In addition, chitosan can purportedly stimulate plant growth and tolerance to abiotic stress. It has been also reported that large-scale chitosan commercialization originates from the chemical alkaline hydrolysis of shrimp chitin, with a cost of nearly USD 10/g (Sigma Chemical Con., St. Louis, MO 63118, USA) (Batista et al. Citation2020). In agriculture, chitosan is applied under field conditions in plants, including turmeric (Curcuma longa L.), oregano (Origanum vulgare ssp. hirtum), and sage (Salvia officinalis L.) (Stasińska-Jakubas and Hawrylak-Nowak Citation2022). Moreover, under drought stress, chitosan is reported to stimulate the growth of several plant species, including wild apples (Malus sieversii (Lebed.) Roem.) native to the mountains of Central Asia (Yang et al. Citation2009), coffee (Coffea canephora var. robusta) (Dzung et al. Citation2011), wheat (Triticum aestivum L.) (Zeng et al. Citation2012), and the common bean (Phaseolus vulgaris L.) (Abu-Muriefah Citation2017). During osmotic stress, soaking the seeds and foliar spraying of rice with chitosan was reported to significantly increase shoot growth (Pongprayoon et al. Citation2013) and the yield (Boonlertnirun et al. Citation2007). However, the effects of chitosan on plants reportedly vary according to the chitosan structure and concentration, as well as the plant species, developmental stage, and genotype (Pichyangkura and Chadchawan Citation2015).
Therefore, the mechanism underlying the ability of chitosan to regulate the growth and stress response of plants should be elucidated. Numerous studies have reported that chitosan can enhance the defense responses of plants by activation of hydrogen peroxide (H2O2) through an octadecanoid pathway and nitric oxide (NO) in the chloroplast, MAP kinase activation, oxidative burst, and hypersensitive responses (Rakwal et al. Citation2002), as well as activation of defense-related genes via chromatin alterations (Hadwiger et al. Citation2015). Chitosan can also act as a trigger of plant defense mechanisms against pathogen attacks by inducing the activation of transcription factors (TFs) related to defense-responsive genes and hormone signaling (Povero et al. Citation2011), and has been reported to elicit signal transduction via the generation of H2O2 as a second messenger in abiotic stress responses, leading to increased drought resistance in rice seedlings (Pongprayoon et al. Citation2013). Gel-based proteomics and coexpression network analysis have shown that chitosan induced changes in several related proteins localized in the chloroplasts (Chamnanmanoontham et al. Citation2015). Consequently, to clarify the crucial role of chitosan, particularly modulation of proteins involved in signal transduction pathways, a quantitative phosphoproteomics method was employed to identify phosphorylated proteins in rice leaves. Phosphorylation of proteins is central to several metabolic, hormonal, developmental, and stress responses and is extensively employed in signal transduction, frequently involving cascades of protein kinases and phosphatases (Mayya and Han Citation2009). Protein phosphorylation seems to be regulated by the coordinated actions of protein kinases and phosphatases, which account for about one-third of all proteins in eukaryote cells (Qeli et al. Citation2010). In eukaryotic cells, the most common sites of protein phosphorylation are serine, threonine, and tyrosine residues (Pearlman et al. Citation2011). Large-scale phosphoproteomics analysis has been conducted to assess the responses of crops to drought stress. For example, in maize (Zea mays L.), highly significant changes were identified in 138 phosphopeptides involved in epigenetic control, gene expression, cell cycle-dependent processes, and phytohormone-mediated responses (Bonhomme et al. Citation2012). In addition, phosphoproteins related to drought tolerance and osmotic regulation have been identified in different cultivars of wheat (Triticum spp.) (Lv et al. Citation2014; Zhang et al. Citation2014). Therefore, an investigation of phosphorylated proteins in rice plants would be not only relevant for a more in-depth understanding of the molecular mechanisms of signal transduction pathways involved in defense responses, but also crucial to reveal the coexpression gene interaction networks involved in responses to chitosan.
Therefore, the present study aimed to investigate the growth induction events in rice potentially triggered by chitosan in response to osmotic stress with the use of a gel-free quantitative phosphoproteomics approach by liquid chromatography-electrospray ionization tandem mass spectrometry (ESI-LC-MS/MS). This assumption reflects significant phosphoprotein changes at the posttranslational level in response to chitosan under osmotic stress. The novel findings of this study provide new insights into the understanding of the regulatory mechanisms underlying the action of chitosan-induced resistance to osmotic stress in rice.
2. Materials and methods
2.1. Plant material, growth conditions, chitosan and osmotic stress treatments
The rice cultivar Khao Dawk Mali 105 (KDML105; Oryza sativa L. ssp. indica cv. KDML105), a drought-sensitive cultivar (Pamuta et al. Citation2020), was provided by the Agriculture Department Ministry of Agriculture and Cooperation, Thailand. Rice germination and growth conditions were similar to those described previously (Pongprayoon et al. Citation2013; Chintakovid et al. Citation2017). Briefly, rice seeds were soaked in distilled water for 48 h, then germinated on sterilized sand flooded with distilled water under natural light. After 2 weeks of germination, a modified WP medium (Vajrabhaya and Vajrabhaya Citation1991) was added, and seedlings were grown in the greenhouse under natural light (37 ± 2°C, 74 ± 5% relative humidity, and 93 ± 5 µmol m−2 s−1 photosynthetic photon flux). The nutrient solution was refreshed every 7 days. After 4 weeks, the rice seedlings were divided into two groups. Plants in one group continued to grow in freshly prepared nutrient solutions as a standard condition. In contrast, plants in the other group were transferred to a nutrient solution containing 10% (w/v) polyethylene glycol 6000 (PEG6000) to simulate osmotic stress conditions for 7 days.
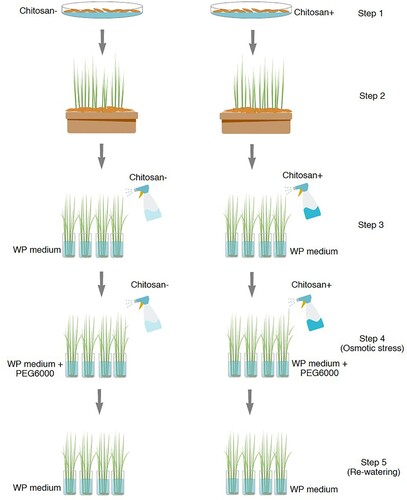
For chitosan treatment (), rice seeds were first soaked in a 40 mg l−1 solution of oligomeric chitosan with an 80% degree of deacetylation solution, prepared as described (and called O80) in Limpanavech et al. Citation2008, whereas for the control groups, rice seeds were soaked with distilled water for 48 h (, step 1). The seeds were then germinated on sand supplemented with WP nutrient solution for 2 weeks before transferring to WP nutrient solution (, step 2). Seedlings (2- and 4-week-old) were sprayed twice with a solution of chitosan at the same concentration containing 0.01% (v/v) Triton X-100 until thoroughly soaked. A control treatment was performed by spraying as above except with 0.01% (v/v) Triton X-100 but no chitosan (, step 3). After 2 days of the last chitosan treatment, 10% (w/v) PEG6000 was added to the nutrient solution as a surrogate model of osmotic stress conditions (, step 4). Then, the rice seedlings were transferred to a freshly prepared nutrient solution without PEG6000 as osmotic stress-free (‘re-watering’) conditions (, step 5). Four replicates for each treatment were arranged in a completely randomized design. Leaf samples were collected during 7 days of osmotic stress and consequently re-watered from four independent replicates to determine growth and photosynthetic pigments. Leaf tissues were harvested during 3 days of osmotic stress from three independent replicates for phosphoproteome, phenylalanine, and amino acid analyses in each treatment.
Figure 1. Scheme of the methodology for chitosan treatment.
2.2. Photosynthetic pigments analysis
Six randomly selected plants from each replicate were used to determine the fresh weight (FW), dry weight (DW), and photosynthetic pigments. The Chl a, Chl b, and carotenoid contents were measured following the methods of Shabala et al. (Citation1998) and Lichtenthaler (Citation1987). Briefly, 100–200 mg of fresh leaves were homogenized with 5 ml of 80% (v/v) acetone, then wrapped in aluminum foil and placed in a refrigerator for 48 h. The Chl a and Chl b were quantified at wavelengths of 662 and 644 nm, whereas carotenoids were determined at 470 nm on a microplate spectrophotometer (Multiscan GO; Thermo Fisher Scientific). We used 80% (v/v) acetone solution as a blank control. Statistical analysis of the data was performed using analysis of variance (ANOVA) and the mean comparison was performed with Tukey’s test, establishing statistical significance at P-values of p < 0.05. The bars in all figures represent the standard deviation of the mean.
2.3. Phosphoproteomics analysis
Leaf samples from ten seedlings were pooled from each replicate treated with or without chitosan application. Phosphoproteins were extracted from 0.5 g of leaf samples after being ground in liquid nitrogen and precipitated with acetone, according to Aroonluk et al. (Citation2020). The protein concentrations were determined as described by Lowry et al. (Citation1951).
Phosphoproteomic analysis was performed according to the phosphoproteome workflow procedure described by Nakagami et al. (Citation2012). One hundred micrograms of the protein were used for phosphoproteins enrichment using the Pierce® Phosphoprotein Enrichment Kit according to the manufacturer’s instructions and desalted by the HiTrap® Desalting Columns (Merck KGaA, Darmstadt, Germany). The phosphoproteins were reduced with 10 mM dithiothreitol (DTT), alkylated with 30 mM iodoacetamide (IAA) in 10 mM ammonium bicarbonate, and then digested with sequencing-grade trypsin (Promega Corporation, Madison, WI, USA) for 16 h at 37°C. Tryptic peptides were then concentrated by a SpeedVac™ Vacuum Concentrator (Thermo Fisher Scientific) and dissolved in 0.1% formic acid (FA) for MS analysis.
Phosphopeptide samples were assessed by liquid chromatography (LC) using an Ultimate 3000 LC System (Dionex Corporation, Sunnyvale, CA, USA) coupled to an ESI ion trap mass spectrometer (HCT Ultra PTM Discovery System; Bruker Daltonik GmbH, Bremen, Germany) and equipped with a monolithic nanocolumn (100-µm i.d. × 5 cm; Thermo Fisher Scientific) at an electrospray flow rate of 20 µl/min and a mobile phase flow rate of 0.3 µl/min. The mobile phase consisted of a nonlinear gradient of solvent A (0.1% (v/v) FA in H2O) and solvent B (20% (v/v) H2O, 80% (v/v) acetonitrile, 0.1% (v/v) FA) changing from 9:1 (v/v) A:B to 3:7 (v/v) A:B from 0 to 13 min, then 1:9 (v/v) A:B from 13 to 15 min and 9:1 (v/v) A:B from 15 to 20 min. Electrospray ionization was carried out at 1.6 kV using the CaptiveSpray. Nitrogen was used as a drying gas (flow rate about 50 l/h). Collision-induced-dissociation product ion mass spectra were obtained using nitrogen gas as the collision gas. Mass spectra (MS) and MS/MS spectra were obtained in the positive-ion mode at 2 Hz over the range (m/z) 150-2200. The collision energy was adjusted to 10 eV as a function of the m/z value.
2.4. Protein quantitation and identification
The Decyder MS 2.0 analysis software (GE Health-care, Chicago, IL, USA) was used to measure the relative protein abundance based on peptide MS signal intensities of the individual LC-MS analyzed data. An average abundance ratio of more than two-fold was determined as an over-expressed protein with a significant standard t-test and one-way ANOVA p < 0.05. All MS/MS spectra from the Decyder MS analysis were performed by applying the global variable mode of carbamidomethyl, variable mode of oxidation (M), phospho (ST) and phospho (Y), peptide charge state (1+, 2 + and 3+), and m/z tolerance 0.1 u. These spectra were searched against NCBI protein databases (https://www.ncbi.nlm.nih.gov/) with an Oryza sativa L. proteome (downloaded March 4th, 2019) to identify matching peptides by using the Mascot software search engine (Matrix Science, London, UK). Identified proteins were filtered with a one-way ANOVA p < 0.05. In this experiment, 200 fg of BSA was used as an internal standard to normalize protein intensities from each set of data.
The identified proteins were used for GO analysis to identify the biological processes according to the Protein ANalysis THrough Evolutionary Relationships (PANTHER; http://www.pantherdb.org/) classification system (Thomas et al. Citation2003) and the Rice Genome Annotation Project (Ouyang et al. Citation2007). The levels of significantly expressed proteins in the hierarchical clustering were determined with MultiExperiment Viewer software (MEV) (Saeed et al. Citation2003) and analyzed using the t-test (p < 0.05) and the Pearson correlation coefficient. Coexpression network analysis was conducted to identify significantly upregulated proteins following chitosan treatment under osmotic stress relative to the control plants without chitosan application using a guide gene approach by Rice Functionally Related gene Expression Network Database (RiceFREND; https://ricefrend.dna.affrc.go.jp/) with the multiple gene approach with a hierarchy of 1 and mutual rank of 5 (Sato et al. Citation2013).
2.5. Measurement of phenylalanine content
The phenylalanine content of rice leaves was extracted using ice-cold methanol: osmotic as described by Uawisetwathana et al. (Citation2015) with some modifications. Briefly, plant sample powder (100 mg) was mixed with 2 ml of cold extraction solvent, shaken at 2,400 rpm for 5 min using a multi-tube vortexer (MTV-100; Hangzhou Allsheng, Inc., Hangzhou, Zhejiang, China) and then sonicated using an ultrasonic cleaner (CP2600D; Crest Ultrasonics, Penang, Malaysia) at 4°C for 15 min. The supernatant was subsequently separated from debris by centrifugation at 4°C and 3,500 rpm for 5 min (Allegra X-22R Centrifuge; Beckman Colter, Inc., Brea, CA, USA) and then vacuum dried at 40°C for 3 h to remove the solvents. The dried crude samples were redissolved in 150 µl of osmotic and filtered through a 0.22-μm cellulose acetate membrane (Costar® Spin-X® centrifuge tube filter; Corning Incorporated, Corning, NY, USA) at 4°C and 3,500 rpm for 5 min. Then, 100 µl of the flow-through samples were derivatized and quantified by gas chromatography (GC)-MS. Pretreatment and derivatization of phenylalanine were performed using a Phenomenex EZ: faast™ kit (Phenomenex, Inc., Torrance, CA, USA) with 0.2 mM norvaline in 10% n-propanol (100 µl) added to the crude extract (100 µl) as an internal standard. The mixture was aspirated through the sorbent tip and then washed with 200 µl of absolute n-propanol. Phenylalanine adsorbed onto the sorbent particles was dispensed using 200 µl of 3-picoline in NaOH as an eluting solution into a flat vial. Then, 25 µl of 20% (v/v) propyl chloroformate in 60% (v/v) chloroform and 20% (v/v) iso-octane were added to the vial and mixed for 10 s. The reaction was neutralized by the addition of 50 µl of iso-octane. After vortexing for 10 s, phase separation was allowed to proceed for about 1 min. Then, 50 μl of the upper layer were collected and dried under a stream of N2 gas for 5 min. The derivatized form of phenylalanine was dissolved in 50 µl of iso-octane: chloroform (80:20, v/v) and then transferred to a GC vial.
A gas chromatograph (7890B; Agilent Technologies, Inc., Santa Clara, CA, USA) coupled with an EI source (Agilent Technologies, Inc.) and a triple quadrupole mass spectrometer (7000D; Agilent Technologies, Inc.) was employed to separate and quantify the targeted ions of phytohormones. Two microliters of the derivatized samples were injected at 250°C with a split mode of 1:5 into a polysiloxane (phenyl 50% and dimethyl 50%) or ZB-AAA column (10 m x 0.25 mm; Phenomenex, Ez: faast kit). The separation was performed under a flow of helium gas at 1.1 ml/min and an initial temperature of 110°C, which was increased to 170°C at 20°C /min and then further increased to 320°C at 30°C /min. Electron ionization in the positive mode (EI+) was performed at 70 eV and a vaporizer temperature of 240°C. Qualitative and quantitative analyses of the ions were performed in the selected ion monitoring mode. Statistical analysis of the data was performed using ANOVA and the mean comparison was performed with Tukey’s test, accepting significance at the p < 0.05 level.
2.6. Analysis of free physiological amino acids by GC-TQ/MS
Free physiological amino acids were analyzed according to the method described by Jimenez-Martín et al. (Citation2012) with some modifications. To extract free amino acids, 100 mg of ground leaf tissues were homogenized with 4 ml of 25% acetonitrile in 0.1 M HCl for 2 min and incubated at room temperature for 20 min. The homogenate was centrifuged at 10,000 rpm for 10 min. Aliquots of the supernatant (50 µl) were transferred to GC glass vials containing 50 µl of norleucine (200 nmol/ml) as internal standards. The samples were dried at 60°C for 2 h, then mixed with 50 µl of dichloromethane and incubated at room temperature for 30 min. Afterward, the dried samples were mixed with 50 µl of a derivatizing agent (N-tert-butyldimethylsilyl-N-methyltrifluoroacetamide with 1% tert-butyldimethylchlorosilane) and 50 µl of acetonitrile. Then, 2 µl of each sample were incubated at 100°C for 4 h prior to triple quadrupole GC/MS with a gas chromatograph (7890B; Agilent Technologies, Inc.) equipped with a mass spectrometer (7000D; Agilent Technologies, Inc.) and a PAL autosampler system (CTC Analytics AG, Zwingen, Switzerland). Aliquots of the derivatized amino acids (2 µl) were injected using the pulsed split mode at a 1:5 split ratio and 280°C into a HP-5MS column (30, 0.25 mm i.d.; J&W GC column; Agilent Technologies, Inc.). Helium was used as the carrier gas at a constant flow rate of 1.4 ml/min. The temperature of the GC oven was increased from 130°C to 190°C at 6°C /min, to 230°C at 30°C /min for 5 min, and then to 325°C for 6 min. The transfer line, ion source (EI), and quadrupole temperatures were set at 325°C, 240°C, and 180°C, respectively. The mass spectrometer was operated in selected ion monitoring mode. Statistical analysis of the data was performed using a t-test, accepting significance at the p < 0.05 level.
3. Results
3.1. Osmotic stress response of the KDML105 in terms of shoot growth and photosynthetic pigment contents
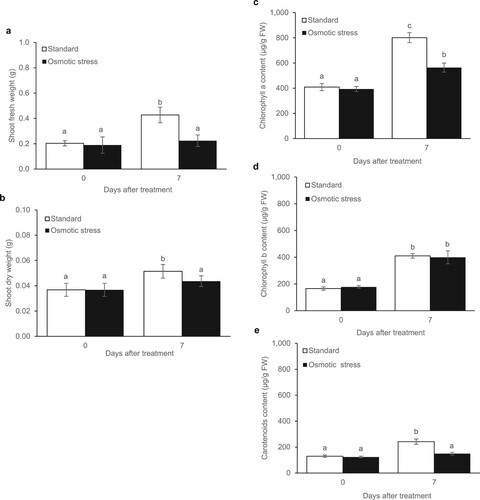
Under standard conditions without PEG6000-treated KDML105 rice cultivar showed a significantly, 2.0 and 1.4 times higher shoot fresh weight (SFW) and shoot dry weight (SDW), respectively, after plant culturing for 7 days. In contrast, PEG6000 affected shoot growth (SFW and SDW) during osmotic stress conditions in the KDML105 rice cultivar. In particular, the KDML105 rice plants under osmotic stress for 7 days exhibited reduced SFW and SDW by approximately 47.6% and 15.2%, respectively, compared to non-PEG6000-treated plants (a and b). In addition, the photosynthetic pigment levels in rice under standard conditions for 7 days showed an increase in chlorophyll a (Chl a), chlorophyll b (Chl b), and carotenoids by 2.0, 2.5, 1.9 times, respectively. At the same time, the effect of osmotic stress treatment caused a numerical reduction in Chl and carotenoids. After 7 days of osmotic stress, a significant decrease could be observed in the Chl a (29.6%) and carotenoid (38.3%) content in KDML105 rice leaves, while the level of Chl b content did not change compared to the control plants (c–e).
Figure 2. Growth parameters and photosynthetic pigments of KDML105 rice cultivar under standard and osmotic stress conditions (10% PEG6000) for 7 days in the shoot fresh weight (a), shoot dry weight (b), Chl a (c), Chl b (d), and carotenoids (e). Data are represented as mean ± SD, derived from 4 independent repeats. Different lowercase letters indicate significant differences, p < 0.05, ANOVA followed by Tukey’s test.
3.2. Chitosan improved growth enhancement and maintained photosynthetic pigments during osmotic stress and re-watering conditions
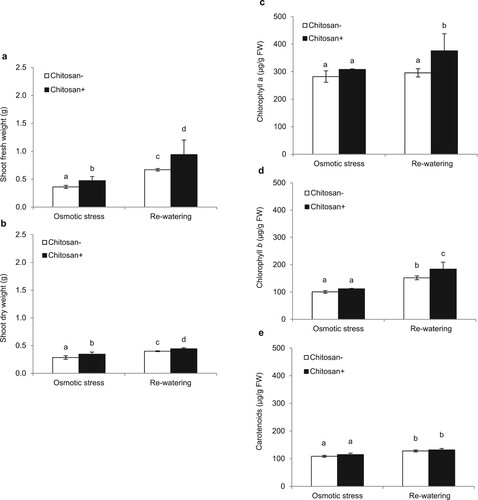
Chitosan at 40 mg l−1 by seed soaking and foliar spraying could enhance the shoot growth and the level of photosynthetic contents after 7 days of osmotic stress and nonosmotic stress (re-watering) conditions. The chitosan-treated KDML105 rice seedlings promoting SFW were 1.3- and 2.0-fold higher than nonchitosan-treated plants under osmotic stress and re-watering conditions, respectively (a). In addition, the SDW of chitosan-treated plants were significantly higher by 1.2- and 1.1-fold than untreated control plants under osmotic stress and re-watering conditions, respectively (b). In addition, the chitosan-treated KDML105 cultivar maintained increased photosynthetic pigment levels during osmotic stress. After removing osmotic stress (re-watering), foliar spray chitosan increased the content of Chl a (1.3-fold) and Chl b (1.2-fold), but not the content of carotenoids (c–e).
Figure 3. Growth parameters and photosynthetic pigments of KDML105 rice treated with and without chitosan under osmotic stress and re-watering, indicated by shoot fresh weight (a) and shoot dry weight (b), Chl a (c), Chl b (d), and carotenoids (e). Data are presented as mean ± SD, derived from 4 independent repeats. Different lowercase letters indicate significant differences (p < 0.05).
3.3. Phosphoproteome profile and coexpression network of rice leaves induced by chitosan during osmotic stress
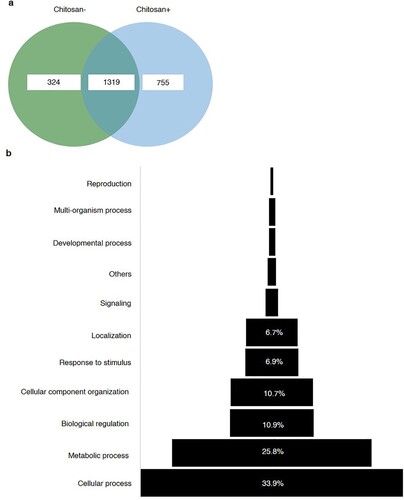
Phosphoproteomics analysis using gel-free LC-MS/MS identified a total of 2,398 proteins in rice leaves under osmotic stress (Table S1). In total, 324 and 755 responsive proteins were detected in rice leaves with and without chitosan treatment, respectively. Of the 2,398 proteins, 1,319, as shown in the Venn diagram in a, were assigned to the following 11 GO functional categories: cellular process (33.9%), metabolic process (25.8%), biological regulation (10.9%), cellular component organization (10.7%) response to stimulus (6.9%), localization (6.7%), signaling (1.7%), developmental process (0.9%), multi-organism process (0.9%), reproduction (0.4%), and others (1.20%; b).
Figure 4. In total, 324 and 755 phosphoproteins detected with and without chitosan treatment. The 1,319 proteins were found upon both treatments in rice leaves (a). Functional classification of the total proteins were constructed based on gene ontology (GO) annotated assignments of proteins in the Protein ANalysis THrough Evolutionary Relationships (PANTHER) (b).
Hierarchical clustering analysis was performed with a total of 2,398 proteins from the leaves of rice plants treated with or without chitosan under osmotic stress and then categorized based on expression patterns. The 60 most significantly expressed proteins are shown in a as a heat map based on expression levels in each replication. Putative functions were assigned to only 32 phosphoproteins, as the remaining 28 were either hypothetical or unknown (Table S2). The significantly expressed proteins were classified into the six following groups based on GO functional annotation in reference to the Rice Genome Annotation Project: signal transduction (41%), metabolic process (34%), transport (13%), transcription factor (6%), defense response (3%), and other (3%; b). Besides, the expression levels of 19 proteins were upregulated, including metabolic processes (GDSL-like lipase/acylhydrolase, dirigent protein 16, and potassium efflux antiporter protein), transport (aminotransferase, IAA-amino acid hydrolase, transmembrane amino acid transporter protein, integral membrane protein, and piezo-type mechanosensitive ion channel), TFs (transcriptional factor B3 family protein and SC35-like splicing factor SCL30), and mainly in signal transduction (OsCML12-calmodulin-related calcium sensor protein, ubiquitin carboxyl-terminal hydrolase 15, U-box domain-containing protein 45, HEAT repeat family protein, BRCA1 C terminus domain-containing protein, pectinesterase, protein kinase domain-containing protein, and receptor-like protein kinase; ).
Figure 5. Heat map of significantly changed proteins in KDML105 rice cultivar under osmotic stress for 3 days with and without chitosan treatment. The heat map was created using the MultiExperiment Viewer (a). Each row in the hierarchical clustering analysis represents an individual protein. The color scale (green to red) indicates low to high protein expressions. Numbers above the column refer to the number of replications. The pie chart was constructed based on the gene ontology annotated assignments of proteins in Rice Genome Annotation Project (b).
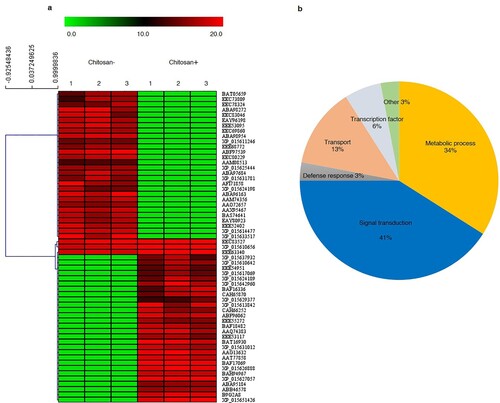
Table 1. Upregulated phosphoproteins in rice in response to chitosan treatment under osmotic stress.
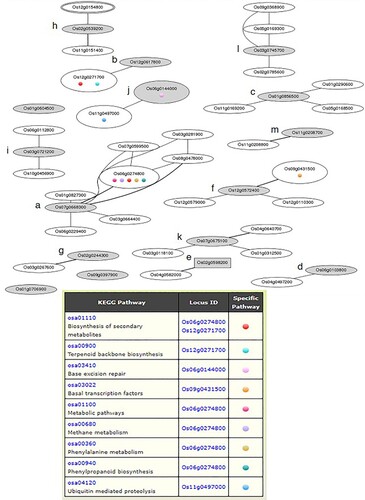
To investigate the main chitosan-induced metabolic processes, 19 upregulated proteins were subjected to coexpression network analysis using the RiceFREND database. Of these 19 chitosan-responsive phosphoproteins, 13 (68.4%) were found to form a positive coexpression network with other genes represented as nodes a-m, as shown in (Table S3). The thirteen phosphoproteins with the coexpression were GDSL-like lipase/acylhydrolase (Os07g0668300; LOC_Os07g47210; node a), potassium efflux antiporter protein (Os12g0617800; LOC_Os12g42300; node b), transmembrane amino acid transporter protein (Os01856500; LOC_Os01g63770; node c), integral membrane protein (Os06g0103800; LOC_Os06g01440; node d), transcriptional factor B3 family protein (Os02g0598200; LOC_Os02g38470; node e), SC35-like splicing factor SCL30 (Os12g0572400; LOC_Os12g38420; node f), ubiquitin carboxyl-terminal hydrolase 15 (Os02g0244300; LOC_Os02g14730; node g), U-box domain-containing protein 45 (Os02g0539200; LOC_Os02g33590; node h), HEAT repeat family protein (Os03g0721200; LOC_Os03g51140; node i), BRCA1 C terminus domain-containing protein (Os06g0144000; LOC_Os06g05190; node j), pectinesterase (Os07g0675100; LOC_Os07g47830; node k), protein kinase domain-containing protein (Os03g0745700; LOC_Os03g53410; node l), and receptor-like protein kinase (Os11g0208700; LOC_Os11g10280; node m).
Figure 6. Coexpressed networks of upregulated proteins with significant expression level changes induced by chitosan treatment in rice leaves under osmotic stress, generated by the RiceFREND. Gray and white ellipses indicate query proteins (node a-m) and related genes in nodes, respectively. The square represents the transcription factor. The colored circles in the ellipses represent the Kyoto Encyclopedia of Genes and Genomes (KEGG) pathways of the node gene shown in the table.
3.4. The effects of chitosan application and osmotic stress on the phenylalanine (PHE) and amino acids profile
Without the addition of chitosan, osmotic stress increased leaf PHE levels the first day, then they returned to normal levels 2 days after the osmotic stress in the KDML105 cultivar. In contrast, chitosan-treated KDML105 did not alter PHE content levels the first 2 days. Then, it showed the highest PHE content levels (50.1 mg/100 g of DW) on day 3 of osmotic stress by approximately 8.7-fold compared to nonchitosan-treated plants (a).
Figure 7. PHE in rice leaves on days 1, 2, and 3 (a) and amino acid compositions on day 3 with and without chitosan treatment under osmotic stress (b). Data are presented as mean ± SD derived from 3 independent repeats. Different lowercase letters indicate significant differences (p < 0.05).
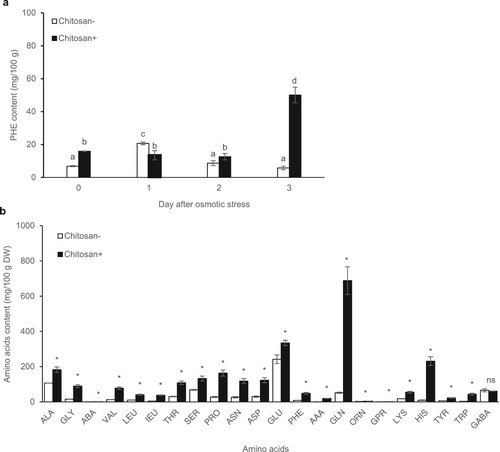
Furthermore, amino acid contents were quantified in rice leaves with or without chitosan application before exposure to osmotic stress. After 3 days of osmotic stress, 22 amino acids were detected, including alanine (ALA), glycine (GLY), α-aminobutyric acid (ABA), valine (VAL), leucine (LEU), isoleucine (IEU), threonine (THR), serine (SER), proline (PRO), asparagine (ASN), aspartic acid (ASP), glutamic acid (GLU), phenylalanine (PHE), α-aminoadipic acid (AAA), glutamine (GLN), ornithine (ORN), glycine-proline (GPR), lysine (LYS), histidine (HIS), tyrosine (TYR), tryptophan (TRP), and γ- aminobutyric acid (GABA). Chitosan-treated plants exhibited higher amino acid contents than untreated control plants, ranging between 1.11 and 688.42 mg/100 g of DW. The amino acids with the highest contents (per 100 g DW) were glutamine (688.42 mg), glutamic acid (334.73 mg), histidine (231.44 mg), alanine (182.89 mg), and proline (163.60 mg; b).
4. Discussion
4.1. Osmotic stress induced by PEG6000 and chitosan affected growth enhancement and photosynthetic pigments in the osmotic stress condition
Khao Dawk Mali 105 or KDML105, known in the world market as Thai Hom Mali or Thai jasmine rice, has a unique fragrance and good eating/cooking quality (Pamuta et al. Citation2020). KDML105 local landrace varieties were widely distributed throughout Thailand and mainly cultivated in northeast Thailand (Vanavichit et al. Citation2018). However, its growth and yield are threatened by drought stress (Kanjoo et al. Citation2012). Previous studies on rice drought stress responses have been performed by transferring rice seedlings into nutrient solutions containing the osmotic agents PEG6000 (Xiong et al. Citation2010; Maksup et al. Citation2014) to create osmotic stress. Drought stress reportedly damages the photosynthetic system by severely damaging the chloroplast envelope (Yamane et al. Citation2003; Vassileva et al. Citation2012) and the PSII complex. A consequence of this damage is a reduced chlorophyll content level (Maksup et al. Citation2014). In the present study, we observed that the Chl a and carotenoid contents were remarkable reduced after 7 days of osmotic stress (c–e). This suggests that chlorophyll degradation occurs under osmotic stress.
Applying exogenous chitosan to osmotic stress resulted in marked drought resistance and improved shoot growth (SFW and SDW) during osmotic stress and after osmotic stress removal (re-watering) (a and b), and also supported by the photosynthetic pigment contents (Chl a and Chl b) after osmotic stress (re-watering) (c and d). These results were consistent with previous reports of the ability of chitosan to stimulate growth and drought resistance in LPT123 rice cultivar (Pongprayoon et al. Citation2013) and induce drought tolerance in white clover (Trifolium repens L.) (Li et al. Citation2017), sweet basil (Ocimum ciliatum L. and O. basilicum L.) (Ghasemi et al. Citation2017), cowpea (Vigna unguiculata (L.) Waip) (Farouk et al. Citation2012), and creeping bentgrass (Agrostis stolonifera L.) (Liu et al. Citation2020).
4.2. Phosphoproteome profiles of rice leave after O80 chitosan application prior to osmotic stress
In contrast to the study of plant growth responses, phosphoproteomics was used to investigate protein phosphorylation, one of the most common posttranslational modification in proteins, controlling nearly all intracellular biological events, such as signal transduction, protein–protein interactions, protein stability, protein localization, apoptosis, and cell cycle control. Protein phosphorylation plays an important role in the regulation of cellular signaling pathways. Detecting changes in protein phosphorylation can be a difficult task because of the transient labile state of the phosphate group. Furthermore, low phosphoprotein abundance and poorly developed phospho-specific antibodies also contribute to difficulties in phosphoprotein detection. As a result, phosphoproteome analysis necessitates highly sensitive and specific methods. Currently, the majority of phosphoproteomic studies are performed by mass spectrometric approaches combined with phospho-specific enrichment methods (Thingholm et al. Citation2009) Using quantitative proteomics approaches, these variations at the protein level can be detected and measured, providing valuable information about the understanding of molecular mechanisms (Gondkar et al. Citation2021). In the present study, we conducted a gel-free-based quantitative phosphoproteomics analysis of the chitosan response to short-term osmotic stress in rice leaves. A large number of phosphoproteins were identified. Indeed, the upregulated phosphoproteins were coexpressed with other genes that might be involved in chitosan-induced resistance to osmotic stress. These chitosan-responsive phosphoproteins and the related signaling and metabolic pathways might play important roles in chitosan signaling and response to osmotic (drought) stress in rice leaves.
4.3. Chitosan-induced phosphoproteins involved in secondary metabolic processes under osmotic stress
Coexpression network analysis showed that GDSL-like lipase/acylhydrolase (Os07g0668300) interacted with other genes, especially peroxidase 11 precursors (Os06g0274800), which is involved in secondary metabolic pathways, such as phenylalanine and phenylpropanoid biosynthesis (, node a). Peroxidases act as antioxidant enzymes and contribute to the removal of hydrogen peroxide (Singh et al. Citation2013). Interestingly, the peroxidase and dirigent (Os08g349100) proteins have been implicated in the modulation of lignification levels upon exposure to abiotic stress (Paniagua et al. Citation2017). Dirigent-like genes are responsive to osmotic, leading to increased lignification and phenylpropanoid biosynthesis as plant defense mechanisms (Caño-Delgado et al. Citation2003; Miedes et al. Citation2014). These data correlate with previous reports that chitosan stimulated an increase in peroxidase activity under stress conditions in plants (El Hadrami et al. Citation2010). Chitosan treatment-induced resistance to osmotic stress via H2O2 production and increased peroxidase levels in rice seedlings (Pongprayoon et al. Citation2013). Also, chitosan was shown to induce resistance against Blumeria graminis f. sp. hordei in barley plants (Hordeum vulgare L.) by oxidative burst induction and phenolic compound deposition (Faoro et al. Citation2008), and significantly improved phenol accumulation and flavonoid metabolism in white clover (Trifolium repens L. cv. Ladino) under dehydration stress (Li et al. Citation2017). Flavonoids participate in the production of phenylalanine and phenylpropanoid secondary metabolites, which function as scavengers of radicals (Fini et al. Citation2011) and are associated with enhanced drought tolerance in plants (Nakabayashi et al. Citation2014). Indeed, the results of the present study revealed that chitosan treatment induced the highest levels of phenylalanine (50.1 mg/100 g of DW) on day 3 of osmotic stress, and chitosan-treated plants had higher phenylalanine contents than untreated plants by approximately 8.7-fold (a). The phosphoproteomics data demonstrated that chitosan induced significant upregulation of many phosphoproteins and genes associated with secondary metabolism, which potentially contributed to coping with osmotic stress. Furthermore, a putative potassium efflux antiporter protein (Os12g0617800) was found to regulate the efflux of monovalent cations to maintain ion homeostasis in plant cells. This protein is localized in chloroplasts and associated with chlorophyll biosynthesis, development, and photosynthesis under abiotic conditions (Luo et al. Citation2018). It is involved in a coexpression network with solanesyl diphosphate synthase 1 (Os12g0271700) in pathways associated with the production of secondary metabolites and terpenoid biosynthesis (, node b). The terpenoid metabolism plays a role in various functions of plants as hormones (gibberellins, abscisic acid), photosynthetic pigments (phytol, carotenoids), and electron carriers (ubiquinone, plastoquinone) (McGarvey et al. Citation1995). In this study, the chitosan-treated KDML105 cultivar maintained high photosynthetic pigments (Chl a, Chl b and carotenoids) during osmotic stress (c–e). These findings imply that chitosan increased the expression of phosphoproteins involved in secondary metabolisms and could help rice seedlings maintain photosynthetic pigments during osmotic stress by affecting the potassium efflux antiporter protein.
4.4. Chitosan elevated the amino acid metabolites and transporter proteins in response to osmotic stress
Amino acids played an important compatible osmolyte and provided available precursors for nitrogen, carbon (Ali et al. Citation2019), and protein synthesis in plants (Burg et al. Citation2008). It is known that during drought stress, free amino acids are a critical adaptive response in plants (Good et al. Citation1994). Proline has been reported to osmotic adjustment and acts as an effective osmotic protector and scavengers of reactive oxygen species when plants are subjected to various environmental stresses (Yamada et al. Citation2005). Glutamine is converted to glutamic acid via the catabolic pathway. It serves as a source of nitrogen and a transport substance. In addition, histidine is metabolized to glutamic acid by four enzymatic steps in animals. However, this pathway has not yet been investigated in plants (Hildebrandt et al. Citation2015). The glutamic acid can serve as the precursor of proline and is involved in Chl biosynthesis in plants (Burg et al. Citation2008). In the present study, chitosan treatment promoted glutamic acid and proline accumulation, and it may maintain the Chl content in rice leaves under osmotic stress. The result was also validated by phosphoproteomics study. During osmotic stress, chitosan-treated KDML105 induced aminotransferase (Os08g0245400) and IAA-amino acid hydrolase (Os01g0706900), and also are reportedly associated with amino acids and nitrogen metabolisms (Schultz et al. Citation1995; Schultz et al. Citation1998). Furthermore, phosphoproteomics study revealed that in rice leaves, chitosan-responsive transport proteins were upregulated, including transmembrane amino acid transporter protein (Os01g856500), integral membrane protein (Os03g0721200), and piezo-type mechanosensitive ion channel (Os01g0388566). Coexpression gene networks, the transmembrane amino acid transporter interacted with aminotransferase, class V family protein (Os01g0290600), amino acid/polyamine transporter II family protein (Os11g0169200), and nonaspanin (TM9SF) family protein (Os05g0168500) (, node c), whereas the integral membrane transport protein showed an interaction with glycoside hydrolase, family 9 protein (Os04g0497200) (, node d). Most amino acid transporters are considered to be proton-amino acid symporters coupled to amino acid uptake across the plasma membrane of plant cells (Ortiz-Lopez et al. Citation2000). Recently, it was discovered that the piezo-type mechanosensitive protein responsible for Ca2+ transduction and involved in the abscisic acid signaling pathway in rice. It is located on the plasma and vacuole membranes (Heng et al. Citation2021).
4.5. Chitosan induced phosphoproteins associated with TFs and signal transduction during osmotic stress
TFs act as upstream triggers in a variety of signaling pathways. Chitosan stimulated the expression of transcriptional factor B3 family protein (Os02g0598200) (, node e), which participates in TF-mediated embryo axis formation and vascular development similar to the TF auxin response factor 1 (Möller et al. Citation2017). Typically, auxin plays a critical role in meristematic cell differentiation in the shoot apical meristem and is a necessary signal responding to abiotic stresses (Zhang et al. Citation2012). The serine/arginine-rich SC35-like splicing factor SCL30 (Os12g0572400) was identified as an essential splicing factor in spliceosome assembly and splicing regulation, either directly or indirectly, to maintain gene expression and development (Yan et al. Citation2000). This phosphoprotein interacted with TATA box-binding protein-associated factor 10 (Os09g0431500), a transcription factor involved in basal transcription (, node f).
Another noteworthy, chitosan treatment increased the expression of eight signal transduction phosphoproteins in rice leaves under osmotic stress, including OsCML12 calmodulin-related calcium sensor protein (Os01g0604500), ubiquitin carboxyl-terminal hydrolase 15 (Os02g0244300), U-box domain-containing protein 45 (Os02g053200), HEAT repeat family protein (Os06g0103800), BRCA1 C terminus domain-containing protein (Os06g0144000), pectinesterase (Os07g0675100), protein kinase domain-containing protein (Os03g0745700), and receptor-like protein kinase (Os11g0208700). The calmodulin family is a vital class of Ca2+ sensor proteins that play crucial roles in cellular signaling cascades through the regulation of numerous target proteins (Ranty et al. Citation2006). Ca2+ is a signaling molecule for chitosan induction. Oligomeric chitosan is reported to induce cytosolic accumulation of Ca2+ in guard cells as a signal for stomatal closure. Changes in intracellular Ca2+ levels have been reported in the early response to various abiotic signals, including mechanical stimuli, osmotic stress, cold and heat shocks (Klsuener et al. Citation2002). Low concentrations (50 µg/ml) of chitosan can induce an increase in the cytosolic Ca2+ concentration ([Ca2+]cyt) and the accumulation of H2O2 (Zuppini et al. 2004). However, previous studies reported chitosan-induced drought resistance in the LPT123 rice cultivar but not in the mutated LPT123-TC171 line via H2O2 signaling (Pongprayoon et al. Citation2013), suggesting that the response to chitosan might vary depending on the genotype or cultivar. Alternatively, Ca2+ may act as a signaling component to elevate calmodulin-related calcium sensor proteins in response to osmotic stress, enhancing drought resistance and growth improvement in KDML105 rice cultivar through chitosan priming.
The results of phosphoproteomics analysis identified four phosphoproteins involved in the ubiquitin pathway, including U-box domain-containing protein, HEAT repeat family protein, BRCA1 C terminus domain-containing protein, and ubiquitin carboxyl (C)-terminal hydrolase 15 protein linking to proteolysis of the signaling pathways involved in hormone responses, environmental adaptation, and development in higher plants (Callis and Vierstra Citation2000). The ubiquitin carboxyl (C)-terminal hydrolase 15 protein hydrolyzes a variety of ubiquitin linkages, either before or after proteolysis, and plays a role in recycling ubiquitin and reversing ubiquitin conjugation in DNA repair, chromatin modification, and signal transduction (Yang et al. Citation2007). U-box domain-containing protein acts as a single peptide E3 ligase (Azevedo et al. Citation2001), while HEAT repeat family protein has been implicated in protein degradation (Cheng et al. Citation2004). These proteins are also related to hormone signaling. In addition, BRCA1 C terminus domain-containing protein is known to participate in base excision repair, as this domain is an integral signaling module in the DNA damage response and has been established as a phosphor-peptide binding module (Leung et al. Citation2011). The coexpression network analysis showed that the BRCA protein interacted with ubiquitin-activating enzyme-like protein (SUMO activating enzyme 1a) associated with the ubiquitin-mediated proteolytic pathway (, node j). SUMO participates in regulated protein degradation and is involved in plant growth and the response to drought stress (Catala et al. Citation2007). Our results revealed that chitosan-responsive proteins were upregulated in ubiquitination and deubiquitination pathways in response to osmotic stress, leading to enhanced drought resistance and growth in rice.
Furthermore, pectinesterase (Os07g0675100) was detected in the enzyme-catalyzed first essential step in bacterial invasion of plant tissues (Fries et al. Citation2007) and acts in defense mechanisms in plants against pathogens by releasing pectin fragments that function as messenger molecules (Collmer and Keen Citation1986). Chitosan was shown to elicit a response to biotic stress and induces an increase in defense-related compounds (Katiyar et al. Citation2014). Generally, plants respond to biotic stress by producing phytoalexin, pathogenesis-related proteins, such as chitinase, β-glucanase, and proteinase inhibitors, and inducing stress-responsive genes (Hidangmayum et al. Citation2019). Chitosan can also induce activation of the chitinase and glucanase enzymes associated with resistance to pathogens in various plants, including the peach (Prunus persica L. Batsch) (Ma et al. Citation2013), tomato (Solanum lycopersicum L.) (Sathiyabama et al. Citation2014) and dragon-fruit (Hylocereus undatus (Haworth) Britton & Rose) (Ali et al. Citation2014). However, in rice species, the difference of pathogenesis-related proteins is dependent on the molecular weight of chitosan (Lin et al. Citation2005) and the cultivar genotype.
Moreover, protein kinase domain-containing protein (Os03g0745700) and receptor-like protein kinase (Os11g0208700) are involved in the regulation of the stress signal transduction pathways. It has been reported that chitosan application induces a receptor-like kinase gene, MAP kinase pathway, and lysin motif receptor-like kinase, chitin elicitor receptor kinase 1 (CERK1) binding with chitin and chitosan (Petutschnig et al. Citation2010). In contrast, chitosan signaling did not activate the CERK1-independent pathway in Arabidopsis thaliana seedlings (Povero et al. Citation2011). Although the binding receptors remain unclear, chitosan might elicit effects in plant cells through charge–charge interactions owning to the positively charged amine groups that could bind to the negatively charged membrane phospholipids and thus, might not be involved with a specific receptor (Kauss et al. Citation1989; Shibuya and Minami Citation2001). However, the results of the present study indicate that chitosan can induce the phosphorylation of proteins in response to osmotic stress by acting as a receptor in a signaling pathway to increase drought resistance in rice.
5. Conclusions
Drought stress is one of the major abiotic stresses, causing a severe reduction in plant growth and crop production. Chitosan has been proposed as a chemical with the potential to induce significant drought resistance and improve growth in various plant species. Oligomeric chitosan with a degree of deacetylation of 80% (O80) at 40 mg l−1 can stimulate SFW and SDW at the seedling stage. Quantitative phosphoproteomics and coexpression network analyses revealed that chitosan-induced expression of phosphoproteins involved in several processes, including secondary metabolism, transport, transcription, and signaling, in response to osmotic stress to enhance drought resistance and growth in rice cultivar.
Supplemental Material
Download Zip (364.3 KB)Acknowledgments
Conceptualization, W.P. and S.R.; methodology, W.P., N.P., J.J., U.U. and A.P.; software, N.P. and S.R.; validation, W.P. and S.R.; formal analysis, W.P.; investigation, W.P., S.M. and S.R.; resources, W.P.; data curation, W.P. and S.R.; writing—original draft preparation, W.P.; writing—review and editing, W.P., S.M., N.P., J.J., U.U., A.P. and S.R.; visualization, W.P.; supervision, S.R.; project administration, W.P. and S.R.; funding acquisition, W.P. All authors have read and agreed to the published version of the manuscript.
Disclosure statement
No potential conflict of interest was reported by the author(s).
Additional information
Funding
Notes on contributors
Wasinee Pongprayoon
Wasinee Pongprayoon is currently an Assistant Professor at the Department of Biology, Faculty of Science, Burapha University, Chon Buri, Thailand. She completed her degree in Biology in 2004 at Silpakorn University and finished her M.Sc. in Plant Science in 2007 at Mahidol University, Thailand. She obtained her Ph.D. in Biological Science in 2013 at Chulalongkorn University, Thailand. She was awarded The Development and Promotion of Science and Technology Talents Project scholarship in 1998–2013 from The Institute for the Promotion of Teaching Science and Technology, Thailand. Her areas of interest include environment and plant physiology, biochemistry, and proteomics, especially rice species.
Sarunyaporn Maksup
Sarunyaporn Maksup is currently an Assistant Professor at the Department of Biology, Faculty of Science, Silpakorn University, Nakhon Pathom, Thailand. She completed her degree in Biology in 2004 at Chiangmai University and finished her M.Sc. in Plant Science (International Program) in 2007 at Mahidol University, Thailand. She obtained her Ph.D. in Biotechnology (International Program) in 2012 at Mahidol University, Thailand. She was awarded The Development and Promotion of Science and Technology Talents Project scholarship, in 2001–2007 from The Institute for the Promotion of Teaching Science and Technology, Thailand, and was awarded the Royal Thai Government Scholarship from The Office of the Higher Education Commission, Thailand during 2007-2010. Her areas of interest include plant-stress responses, natural plant products, physiology, proteomics, biotechnology. Her current research interests are metal stress tolerance and arsenic-free grains of Thai rice varieties.
Narumon Phaonakrop
Narumon Phaonakrop obtained her B.Sc. in Biotechnology from Ramkhamhaeng University in 1994. She started working as a laboratory assistant at National Center for Genetic Engineering and Biotechnology (BIOTEC) in 2008. One year later, she was promoted to be a researcher assistant. She had expertise in antimicrobial activity assay, peptide purification, and LC-MS. From 2008 to 2021, she co-authored 53 articles in scholarly journals. The SCOPUS database has an H-index of 11, and her publications were cited over 283 times from 2002-2021.
Junthima Jaresitthikunchai
Janthima Jaresitthikunchai received her B.Sc. in Biotechnology from Ramkhamhaeng University in 1991. She worked as a researcher assistant in National Center for Metal and Materials Technology Center (MTEC) for 8 years (1999-2007). In 2008, she started working in National Center for Genetic Engineering and Biotechnology (BIOTEC). She had expertise in animal cell culture, cytotoxicity assay, and Maldi-TOF MS. From 2008 to 2021, she co-authored 32 articles in scholarly journals. Based on the SCOPUS database, she has an H-index of 10, and her publications were cited over 231 times from 2002-2021.
Umaporn Uawisetwathana
Umaporn Uawisetwathana, a researcher from National Center for Genetic Engineering and Biotechnology (BIOTEC), Thailand. She received a doctoral degree in Biological Sciences from Queen’s University Belfast since 2015. She experienced on several analytical methods such as 1H-NMR, GC-MS and LC-MS to apply in agricultural and natural product discovery researches. She is one of initiatives to establish Thailand Metabolomics Society (TMS) since 2019. She also received several research grants and awards from both national and international fundings.
Atikorn Panya
Atikorn Panya is head of food biotechnology research team, functional ingredients and food innovation research group at National Center for Genetic Engineering and Biotechnology (BIOTEC), Thailand. Dr. Panya’s research has focused on food lipid chemistry and lipid oxidation. His research interests focus on investigating the influence of food matrix structures on lipid oxidation and applying metabolomics flavoromics and sensomics for food research. Currently, Dr. Panya is also responsible for BIOTEC GC/MS-based metabolomics & Sensomics facility.
Sittiruk Roytrakul
Sittiruk Roytrakul, a Researcher at National Center for Genetic Engineering and Biotechnology (BIOTEC) received his B.Sc. in Medical Technology from Chiang Mai University in 1992 and obtained his M.Sc. in Biochemistry from Mahidol University in 1996. During 1999-2004, he received the Thai government scholarship to pursue his Ph.D. study in Phytochemistry at Leiden University, Netherlands. He has been appointed as the head of Proteomics Research Laboratory, Genome Institute, in 2007 and began contributing to the advancement of proteomics fields. Currently, he is working as the Research Team Leader of Functional Proteomics Technology Team, Functional Ingredients, and Food Innovation Research Group. From 2008 to 2021, he authored and co-authored more than three hundred articles in scholarly journals. The SCOPUS database has an H-index of 30, and his publications were cited over 3867 times from 2002-2021.
Related Research Data
References
- Abu-Muriefah SS. 2017. Effect of nano chitosan on growth, physiological and biochemical parameters of phaseolus vulgaris under salt stress. J Plant Prod. 8:577–585. doi:10.21608/jpp.2017.40468.
- Ali A, Zahid N, Manickam S, Siddiqui Y, Alderson PG, Maqbool M. 2014. Induction of lignin and pathogenesis related proteins in dragon fruit plants in response to submicron chitosan dispersions. Crop Prot. 63:83–88. doi:10.1016/j.cropro.2014.05.009.
- Ali GM, Komatsu S. 2006. Proteomic analysis of rice leaf sheath during drought stress. J Proteome Res. 5(2):396–403. doi:10.1021/pr050291g.
- Ali Q, Athar H, Haider M, Shahid S, Aslam N, Shehzad F, Naseem J, Ashraf R, Ali A, Hussain S. 2019. Role of amino acids in improving abiotic stress tolerance to plants. In: Hasanuzzaman M, Fujita M, Oku H, Islam M, editor. Plant tolerance to environmental stress. 1st edn. Boca Raton: CRC Press; p. 175–1204.
- Aroonluk S, Roytrakul S, Jantasuriyarat C. 2020. Identification and characterization of phosphoproteins in somatic embryogenesis acquisition during oil palm tissue culture. Plants. 9. doi:10.3390/plants9010036.
- Azevedo C, Santos-Rosa MJ, Shirasu K. 2001. The U-box protein family in plants. Trends Plant Sci. 6(8):354–358. doi:10.1016/S1360-1385(01)01960-4.
- Batista ACL, Melo TBL, Paiva WS, Souza FS, Campos-Takaki GM. 2020. Economic microbiological conversion of agroindustrial wastes to fungi chitosan. An Acad Bras Cienc. 92(1):e20180885. doi:10.1590/0001-3765202020180885.
- Bonhomme L, Valot B, Tardieu F, Zivy M. 2012. Phosphoproteome dynamics upon changes in plant water status reveal early events associated with rapid growth adjustment in maize leaves. Mol Cell Proteomics. 11(10):957–972. doi:10.1074/mcp.M111.015867.
- Boonlertnirun S, Sarobol E, Meechoui S, Sooksathan I. 2007. Drought recovery and grain yield potential of rice after chitosan application. Kasetsart J. 41:1 –16.
- Burg MB, Ferraris JD. 2008. Intracellular organic osmolytes: function and regulation. J Biol Chem. 283:7309–7313. doi:10.1074/jbc.R700042200.
- Callis J, Vierstra RD. 2000. Protein degradation in signaling. Curr Opin Plant Biol. 3(5):381–386. doi:10.1016/S1369-5266(00)00100-X.
- Caño-Delgado A, Penfield S, Smith C, Catley M, Bevan M. 2003. Reduced cellulose synthesis invokes lignification and defense responses in Arabidopsis thaliana. The Plant J. 34(3):351–362. doi:10.1046/j.1365-313X.2003.01729.x.
- Catala R, Ouyang J, Abreu IA, Hu Y, Seo H, Zhang X, Chua NH. 2007. The Arabidopsis E3 SUMO ligase SIZ1 regulates plant growth and drought responses. Plant Cell. 19(9):2952–2966. doi:10.1105/tpc.106.049981.
- Cha-um S, Roytakul S, Sathung T, Maijandang A, Tengsiriwattana S, Kirdmanee C. 2007. Exogenous glucose and abscisic acid pre-treatment in indica rice (Oryza sativa L. spp. indica) responses to sodium chloride salt stress. J Plant Sci. 2:141–152. doi:10.3923/jps.2007.141.152.
- Chamnanmanoontham N, Pongprayoon W, Pichayangkura R, Roytrakul S, Chadchawan S. 2015. Chitosan enhances rice seedling growth via gene expression network between nucleus and chloroplast. Plant Growth Regul. 75(1):101–114. doi:10.1007/s10725-014-9935-7.
- Cheng DX, Zhao Y. 2004. AtCAND1, a HEAT-repeat protein that participates in auxin signaling in Arabidopsis. Plant Physiol. 135(2):1020–1026. doi:10.1104/pp.104.044495.
- Chintakovid N, Maipoka M, Phaonakrop N, Mickelbart MV, Roytrakul S, Chadchawan S. 2017. Proteomic analysis of drought-responsive proteins in rice reveals photosynthesis-related adaptations to drought stress. Acta Physiol Plant. 39:240. doi:10.1007/s11738-017-2532-4.
- Collmer A, Keen NT. 1986. The role of pectic enzymes in plant pathogenesis. Annu Rev Phytopathology. 24(1):383–409. doi:10.1146/annurev.py.24.090186.002123.
- Dzung NA, Khanh VTP, Dzung TT. 2011. Research on impact of chitosan oligomers on biophysical characteristics, growth, development and drought resistance of coffee. Carbohydr Polymer. 84(2):751–755. doi:10.1016/j.carbpol.2010.07.066.
- El Hadrami A, Adam LR, El Hadrami I, Daayf F. 2010. Chitosan in plant protection. Mar Drugs. 8(4):968–987. doi:10.3390/md8040968.
- Faoro F, Maffi D, Cantu D, Iriti M. 2008. Chemical-induced resistance against powdery mildew in barley: the effects of chitosan and benzothiadiazole. BioControl. 53(2):387–401. doi:10.1007/s10526-007-9091-3.
- Farouk S, Amany AR. 2012. Improving growth and yield of cowpea by foliar application of chitosan under water stress. Egypt J Biol. 14(1):14 –116. doi:10.4314/ejb.v14i1.2.
- Fini A, Brunetti C, Di Ferdinando M, Ferrini F, Tattini M. 2011. Stress-induced flavonoid biosynthesis and the antioxidant machinery of plants. Plant Signal Behav. 6(5):709–711. doi:10.4161/psb.6.5.15069.
- Fries M, Ihrig J, Brocklehurst K, Shevchik VE, Pickersgill RW. 2007. Molecular basis of the activity of the phytopathogen pectin methylesterase. EMBO J. 26(17):3879–3887. doi:10.1038/sj.emboj.7601816.
- Ghasemi Pirbalouti A, Malekpoor F, Salimi A, Golparvar A. 2017. Exogenous application of chitosan on biochemical and physiological characteristics, phenolic content and antioxidant activity of two species of basil (Ocimum ciliatum and Ocimum basilicum) under reduced irrigation. Sci Hortic (Amaterdam). 217:114–122. doi:10.1016/j.scienta.2017.01.031.
- Gondkar K, Sathe G, Joshi N, Nair B, Pandey A, Kumar P. 2021. Integrated proteomic and phosphoproteomics analysis of DKK3 signaling reveals activated kinase in the most aggressive gallbladder cancer. Cells. 10:511. doi:10.3390/cells10030511.
- Good AG, Zaplachinski ST. 1994. The effects of drought stress on free amino acid accumulation and protein synthesis in Brassica napus. Physiol Plant. 90:9–14. doi:10.1111/j.1399-3054.1994.tb02185.x.
- Hadwiger LA. 2015. Anatomy of a nonhost disease resistance response of pea to Fusarium solani: PR gene elicitation via DNase, chitosan and chromatin alterations. Front Plant Sci. 6(373):1 –11. doi:10.3389/fpls.2015.00373.
- Heng H, Guoqiang H, Jin S, Fengli Z, Dabing Z. 2021. Bioinformatics analysis for piezo in rice. Reproduction and Breeding. 1:108–113. doi:10.1016/j.repbre.2021.07.001.
- Hidangmayum A, Dwivedi P, Katiyar D, Hemantaranjan A. 2019. Application of chitosan on plant responses with special reference to abiotic stress. Physiol Mol Biol Plants. 25(2):313–326. doi:10.1007/s12298-018-0633-1.
- Hildebrandt TM, Nunes NA, Araújo WL, Braun HP. 2015. Amino acid catabolism in plants. Mol Plant. 8(11):1563–1579. doi:10.1016/j.molp.2015.09.005.
- Jiménez-Martín E, Ruiz J, Pérez-Palacios T, Silva A, Antequera T. 2012. Gas chromatography–mass spectrometry method for the determination of free amino acids as their dimethyl-tert-butylsilyl (TBDMS) derivatives in animal source food. J Agr Food Chem. 60(10):2456–2463. doi:10.1021/jf2052338.
- Kanjoo V, Punyawaew K, Siangliw JL, Jearakongman S, Vanavichit A, Toojinda T. 2012. Evaluation of agronomic traits in chromosome segment substitution lines of KDML105 containing drought tolerance QTL under drought stress. Rice Sci. 19:117–124. doi:10.1016/S1672-6308(12)60030-4.
- Kanya C, Ashraf M, Wijaya L, Ahmad P. 2019. The putative role of endogenous nitric oxide in brassinosteroid-induced antioxidant defence system in pepper (Capsicum annuum L.) plants under water stress. Plant Physiol Biochem. 143:119–128. doi:10.1016/j.plaphy.2019.08.024.
- Katiyar D, Hemantaranjan A, Singh B, Bhanu A. 2014. A future perspective in crop protection: chitosan and its oligosaccharides. Adv Plants Agric Res. 1:6. doi:10.15406/apar.2014.01.00006.
- Kauss H, Jeblick W, Domard A. 1989. The degrees of polymerization and N-acetylation of chitosan determine its ability to elicit callose formation in suspension cells and protoplasts of Catharanthus roseus. Planta. 178:385–392. doi:10.1007/BF00391866.
- Klüsener B, Young JJ, Murata Y, Allen GJ, Mori IC, Hugouvieux V, Schroeder JI. 2002. Convergence of calcium signaling pathways of pathogenic elicitors and abscisic acid in Arabidopsis guard cells. Plant Physiol. 130(4):2152. doi:10.1104/pp.012187.
- Lamaoui M, Jemo M, Datla R, Bekkaoui F. 2018. Heat and drought stresses in crops and approaches for their mitigation. Front Chem. 6(26):1 –14. doi:10.3389/fchem.2018.00026.
- Leung CC, Glover JN. 2011. BRCT domains. Cell Cycle. 10(15):2461–2470. doi:10.4161/cc.10.15.16312
- Li Z, Zhang Y, Zhang X, Merewitz E, Peng Y, Ma X, Huang L, Yan Y. 2017. Metabolic pathways regulated by chitosan contributing to drought resistance in white clover. J Proteome Res. 16(8):3039–3052. doi:10.1021/acs.jproteome.7b00334.
- Lichtenthaler HK. 1987. Chlorophylls carotenoids, chlorophylls carotenoids pigment. Photosynth Biomembr. 148:350–380. doi:10.1016/0076-6879(87)48036-1.
- Limpanavech P, Chaiyasuta S, Vongpromek R, Pichyangkura R, Khunwasi C, Chadchawan S, Lotrakul P, Bunjongrat R, Chaidee A, Bangyeekhun T. 2008. Chitosan effects on floral production, gene expression, and anatomical changes in the Dendrobium orchid. Sci Hortic. 116:65–72. doi:10.1016/j.scienta.2007.10.034.
- Lin W, Hu X, Zhang W, John Rogers W, Cai W. 2005. Hydrogen peroxide mediates defence responses induced by chitosans of different molecular weights in rice. J Plant Physiol. 162(8):937–944. doi:10.1016/j.jplph.2004.10.003.
- Liu Z, Liu T, Liang L, Li Z, Hassan M, Peng Y, Wang D. 2020. Enhanced photosynthesis, carbohydrates, and energy metabolism associated with chitosan-induced drought tolerance in creeping bentgrass. Crop Sci. 60:1064–1076. doi:10.1002/csc2.20026.
- Lowry OH, Rosebrough NJ, Farr AL, Randall RJ. 1951. Protein measurement with the folin phenol reagent. J Biol Chem. 193(1):265–275.
- Luo R, Jiang H, Lv Y, Hu S, Sheng Z, Shao G, Tang S, Hu P, Wei X. 2018. Chlorophyll deficient 3, encoding a putative potassium efflux antiporter, affects chloroplast development under high temperature conditions in rice (Oryza sativa L.). Plant Mol Biol Report. 36(4):675–684. doi:10.1007/s11105-018-1109-8.
- Lv DW, Ge P, Zhang M, Cheng ZW, Li XH, Yan YM. 2014. Integrative network analysis of the signaling cascades in seedling leaves of bread wheat by large-scale phosphoproteomic profiling. J Proteome Res. 13(5):2381–2395. doi:10.1021/pr401184v.
- Ma Z, Yang L, Yan H, Kennedy JF, Meng X. 2013. Chitosan and oligochitosan enhance the resistance of peach fruit to brown rot. Carbohydr Polym. 94(1):272–277. doi:10.1016/j.carbpol.2013.01.012.
- Maksup S, Roytrakul S, Supaibulwatana K. 2014. Physiological and comparative proteomic analyses of Thai jasmine rice and two check cultivars in response to drought stress. J Plant Interact. 9:43–55. doi:10.1080/17429145.2012.752042.
- Mayya V, Han D. 2009. Phosphoproteomics by mass spectrometry: insights, implications, applications, and limitations. Expert Rev Proteomics. 6:605–618. doi:10.1586/epr.09.84.
- McGarvey DJ, Croteau R. 1995. Terpenoid metabolism. Plant Cell. 7:1015–1026. doi:10.1105/tpc.7.7.1015.
- Miedes E, Vanholme R, Boerjan W, Molina A. 2014. The role of the secondary cell wall in plant resistance to pathogens. Front Plant Sci. 5(358):1–14. doi:10.3389/fpls.2014.00358.
- Möller BK, ten Hove CA, Xiang D, Williams N, López LG, Yoshida S, Smit M, Datla R, Weijers D. 2017. Auxin response cell-autonomously controls ground tissue initiation in the early Arabidopsis embryo. PNAS. 114(12):E2533–E2539. doi:10.1073/pnas.1616493114.
- Nakabayashi R, Yonekura-Sakakibara K, Urano K, Suzuki M, Yamada Y, Nishizawa T, Matsuda F, Kojima M, Sakakibara H, Shinozaki K, et al. 2014. Enhancement of oxidative and drought tolerance in Arabidopsis by overaccumulation of antioxidant flavonoids. Plant J. 77(3):367–379. doi:10.1111/tpj.12388.
- Nakagami H, Sugiyama N, Ishihama Y, Shirasu K. 2012. Shotguns in the front line: phosphoproteomics in plants. Plant Cell Physiol. 53:118–124. doi:10.1093/pcp/pcr148.
- Ndayiragije A, Lutts S. 2006. Do exogenous polyamines have an impact on the response of a salt-sensitive rice cultivar to NaCl? J Plant Physiol. 163(5):506–516. doi:10.1016/j.jplph.2005.04.034.
- Ortiz-Lopez A, Chang HC, Bush DR. 2000. Amino acid transporters in plants. Biochimica et Biophysica Acta (BBA) - Biomembranes. 1465(1-2):275–280. doi:10.1016/S0005-2736(00)00144-9.
- Ouyang S, Zhu W, Hamilton J, Lin H, Campbell M, Childs K, Thibaud-Nissen F, Malek RL, Lee Y, Zheng L. 2007. The TIGR rice genome annotation resource: improvements and new features. Nucl Acids Res. 35:D883–D887. doi:10.1093/nar/gkl976.
- Pamuta D, Siangliw M, Sanitchon J, Pengrat J, Siangliw J, Toojinda T, Theerakulpisut P. 2020. Photosynthetic performance in improved ‘KDML105’ rice (Oryza sativa L.) lines containing drought and salt tolerance genes under drought and salt stress. Pertanika J Trop Agric Sci. 43. doi:10.47836/pjtas.43.4.17.
- Paniagua C, Bilkova A, Jackson P, Dabravolski S, Riber W, Didi V, Houser J, Gigli-Bisceglia N, Wimmerova M, Budínská E, et al. 2017. Dirigent proteins in plants: modulating cell wall metabolism during abiotic and biotic stress exposure. Environ Exp Bot. 68(13):3287–3301. doi:10.1093/jxb/erx141.
- Pearlman SM, Serber Z, Ferrell JE J. 2011. A mechanism for the evolution of phosphorylation sites. Cell. 147(4):934–946. doi:10.1016/j.cell.2011.08.052.
- Petutschnig EK, Jones AME, Serazetdinova L, Lipka U, Lipka V. 2010. The lysin motif receptor-like kinase (LysM-RLK) CERK1 is a major chitin-binding protein in Arabidopsis thaliana and subject to chitin-induced phosphorylation. J Biol Chem. 285:28902–28911. doi:10.1074/jbc.M110.116657.
- Pichyangkura R, Chadchawan S. 2015. Biostimulant activity of chitosan in horticulture. Sci Hortic (Amsterdam). 196:49–65. doi:10.1016/j.scienta.2015.09.031.
- Pongprayoon W, Roytrakul S, Pichayangkura R, Chadchawan S. 2013. The role of hydrogen peroxide in chitosan-induced resistance to osmotic stress in rice (Oryza sativa L.). Plant Growth Regul. 70(2):159–173. doi:10.1007/s10725-013-9789-4.
- Povero G, Loreti E, Pucciariello C, Santaniello A, Di Tommaso D, Di Tommaso G, Kapetis D, Zolezzi F, Piaggesi A, Perata P. 2011. Transcript profiling of chitosan-treated Arabidopsis seedlings. J Plant Res. 124:619–629. doi:10.1007/s10265-010-0399-1.
- Qeli E, Ahrens CH. 2010. Peptideclassifier for protein inference and targeted quantitative proteomics. Nat Biotechnol. 28(7):647–650. doi:10.1038/nbt0710-647.
- Rakwal R, Tamogami S, Agrawal GK, Iwahashi H. 2002. Octadecanoid signaling component “burst” in rice (Oryza sativa L.) seedling leaves upon wounding by cut and treatment with fungal elicitor chitosan. Biochem Biophys Res Commun. 295(5):1041–1045. doi:10.1016/S0006-291X(02)00779-9.
- Ranty B, Aldon D, Galaud JP. 2006. Plant calmodulins and calmodulin-related proteins. Plant Signal Behav. 1(3):96–104. doi:10.4161/psb.1.3.2998.
- Saeed AI, Sharov V, White J, Li J, Liang W, Bhagabati N, Braisted J, Klapa M, Currier T, Thiagarajan M, et al. 2003. TM4: a free, open-source system for microarray data management and analysis. BioTechniques. 34(2):374–378. doi:10.2144/03342mt01.
- Sathiyabama M, Akila G, Einstein Charles R. 2014. Chitosan-induced defence responses in tomato plants against early blight disease disease caused by Alternaria solani (Ellis and Martin) Sorauer. Arch Phytopathology Plant Protect. 47(14):1777–1787. doi:10.1080/03235408.2013.858423.
- Sato Y, Namiki N, Takehisa H, Kamatsuki K, Minami H, Ikawa H, Ohyanagi H, Sugimoto K, Itoh J-I, Antonio BA, Nagamura Y. 2013. RiceFREND: a platform for retrieving coexpressed gene networks in rice. Nucleic Acids Res. 41(D1):D1214–D1221. doi:10.1093/nar/gks1122.
- Schultz CJ, Coruzzi GM. 1995. The aspartate aminotransferase gene family of Arabidopsis encodes isoenzymes localized to three distinct subcellular compartments. Plant J. 7:61–75. doi:10.1046/j.1365-313X.1995.07010061.x.
- Schultz CJ, Hsu M, Miesak B, Coruzzi GM. 1998. Arabidopsis mutants define an in vivo role for isoenzymes of aspartate aminotransferase in plant nitrogen assimilation. Genetics. 149:491–499. doi:10.1093/genetics/149.2.491.
- Shabala S, Shabala S, Martynenko A, Babourina O, Newman I. 1998. Salinity effect on bioelectric activity, growth, Na+ accumulation and chlorophyll fluorescence of maize leaves: A comparative survey and prospects for screening. Funct Plant Biol. 25:609–616. doi:10.1071/PP97146.
- Shibuya N, Minami E. 2001. Oligosaccharide signalling for defence responses in plant. Physiol Mol Plant Pathol. 59(5):223–233. doi:10.1006/pmpp.2001.0364.
- Singh H, Dixit S, Singh P, Verma PC. 2013. Differential peroxidase activities in three different crops upon insect feeding. Plant Signal Behav. 8(9):e25615. doi:10.4161/psb.25615.
- Stasińska-Jakubas M, Hawrylak-Nowak B. 2022. Protective, biostimulating, and eliciting effects of chitosan and its derivatives on crop plants. Molecules. 27(9). doi:10.3390/molecules27092801.
- Thingholm TE, Jensen ON, Larsen MR. 2009. Analytical strategies for phosphoproteomics. Proteomics. 9:1451–1468. doi:10.1002/pmic.200800454.
- Thomas PD, Kejariwal A, Campbell MJ, Mi H, Diemer K, Guo N, Ladunga I, Ulitsky-Lazareva B, Muruganujan A, Rabkin S, et al. 2003. PANTHER: a browsable database of gene products organized by biological function, using curated protein family and subfamily classification. Nucleic Acids Res. 31(1):334–341. doi:10.1093/nar/gkg115.
- Uawisetwathana U, Graham SF, Kamolsukyunyong W, Sukhaket W, Klanchui A, Toojinda T, Vanavichit A, Karoonuthaisiri N, Elliott CT. 2015. Quantitative 1H NMR metabolome profiling of Thai jasmine rice (Oryza sativa) reveals primary metabolic response during brown planthopper infestation. Metabolomics. 11(6):1640–1655. doi:10.1007/s11306-015-0817-4.
- Vajrabhaya M, Vajrabhaya T. 1991. Biotechnology in agriculture and forestry. Biotechnol Agric. 14:368–382. doi:10.1007/978-3-642-83986-3_24.
- Vanavichit A, Kamolsukyeunyong W, Siangliw M, Siangliw JL, Traprab S, Ruengphayak S, Chaichoompu E, Saensuk C, Phuvanartnarubal E, Toojinda T, Tragoonrung S. 2018. Thai Hom Mali rice: origin and breeding for subsistence rainfed lowland rice system. Rice. 11:20. doi:10.1186/s12284-018-0212-7.
- Vassileva V, Demirevska K, Simova-Stoilova L, Petrova T, Tsenov N, Feller U. 2012. Long-term field drought affects leaf protein pattern and chloroplast ultrastructure of winter wheat in a cultivar-specific manner. J Agron Crop Sci. 198:104–117. doi:10.1111/j.1439-037X.2011.00492.x.
- Wu CJ, Cheng ZQ, Huang XQ, Yin SH, Cao KM, Sun CR. 2004. Genetic diversity among and within populations of Oryza granulata from yunnan of China revealed by RAPD and ISSR markers: implications for conservation of the endangered species. Plant Sci J. 167:35–42. doi:10.1016/j.plantsci.2004.02.022.
- Xiong JH, Fu BY, Xu HX, Li YS. 2010. Proteomic analysis of PEG-simulated drought stress-responsive proteins of rice leaves using a pyramiding rice line at the seedling stage. Bot Stud. 51:137–145.
- Yamada M, Morishita H, Urano K, Shiozaki N, Yamaguchi-Shinozaki K, Shinozaki K, Yoshiba Y. 2005. Effects of free proline accumulation in petunias under drought stress. J Exp Bot. 56:1975–1981. doi:10.1093/jxb/eri195.
- Yamane K, Kawasaki M, Taniguchi M, Miyake H. 2003. Differential effect of nacl and polyethylene glycol on the ultrastructure of chloroplasts in rice seedlings. J Plant Physiol. 160:573–575. doi:10.1078/0176-1617-00948.
- Yan N, Doelling JH, Falbel TG, Durski AM, Vierstra RD. 2000. The ubiquitin-specific protease family from Arabidopsis. AtUBP1 and 2 are required for the resistance to the amino acid analog canavanine. Plant Physiol. 124(4):1828–1843. doi:10.1104/pp.124.4.1828
- Yang F, Hu J, Li J, Wu X, Qian Y. 2009. Chitosan enhances leaf membrane stability and antioxidant enzyme activities in apple seedlings under drought stress. Plant Growth Regul. 58(2):131–136. doi:10.1007/s10725-009-9361-4.
- Yang P, Smalle J, Lee S, Yan N, Emborg T, Vierstra R. 2007. Ubiquitin C-terminal hydrolases 1 and 2 affect shoot architecture in Arabidopsis. Plant J. 51:441–457. doi:10.1111/j.1365-313X.2007.03154.x.
- Zeng D. 2012. Physiological effects of chitosan coating on wheat growth and activities of protective enzyme with drought tolerance. Open J Soil Sci. 02:282–288. doi:10.4236/ojss.2012.23034.
- Zhang M, Lv D, Ge P, Bian Y, Chen G, Zhu G, Li X, Yan Y. 2014. Phosphoproteome analysis reveals new drought response and defense mechanisms of seedling leaves in bread wheat (Triticum aestivum L.). J Proteomics. 109:290–308. doi:10.1016/j.jprot.2014.07.010.
- Zhang Q, Li J, Zhang W, Yan S, Wang R, Zhao J, Li Y, Qi Z, Sun Z, Zhu Z. 2012. The putative auxin efflux carrier OsPIN3t is involved in the drought stress response and drought tolerance. Plant J. 72:805–816. doi:10.1111/j.1365-313X.2012.05121.x.