
 ?Mathematical formulae have been encoded as MathML and are displayed in this HTML version using MathJax in order to improve their display. Uncheck the box to turn MathJax off. This feature requires Javascript. Click on a formula to zoom.
ABSTRACT
Photosynthesis is susceptible in response to nitrogen (N) deficiency. However, the acclimation of shade-tolerant and high-N sensitive species to N deficiency is unclear. Leaf morpho-physiological traits, photosynthetic performance related parameters were examined in a shade-tolerant and high-N sensitive species P. notoginseng grown under different N levels. Lower N content and Chl content were recorded in the N0-grown P. notoginseng. The maximum values of leaf morpho-physiological traits, photosynthetic rate, and photosynthetic N use efficiency (PNUE) were obtained in the N15-grown P. notoginseng. Coefficients for leaf N allocation into the carboxylation and light-harvesting system components in the N0-grown plants were significantly higher than others. N0 and N7.5 plants showed higher K phase. N addition decreased the absorption and capture of the light energy per unit area (ABS/RC and TRO/RC) and non-photochemical quenching (NPQ). Photochemical quenching (qP), electron transport rate (ETR), and effective quantum yield of photosystem II (ϕPSII) were reduced in the N0-grown plants. The reduction of light-harvesting and utilization capacity not only leads to a decrease in PNUE, but also induces the damage of PSII reaction center. Overall, the inhibition of leaf growth and photosynthetic capacity is an essential strategy for high-N sensitive and shade-tolerant plants in response to N deficiency.
1. Introduction
Nitrogen (N) is an essential constituent of nucleic acid, proteins, and chlorophyll (Chl) (Jian et al. Citation2017). Chl content, plant growth, and crop yield are positively correlated with N application within a certain range of N supply (Maheswari et al. Citation2017; Alves Negrini et al. Citation2020). N deficiency inhibits plant growth and development, reduces leaf area, Chl content and photosynthesis, and ultimately decreases crop yield, and this suppression has been confirmed in N-deficient crop Zea mays and Glycine max (Mu et al. Citation2018; Yazaki et al. Citation2021). The imbalance between the vegetative and reproductive growth results in a decrease in biomass and yield when Cucumis sativus and Lycopersicon esculentum are exposed to N-excess conditions (Zhang et al. Citation2008; Yuan et al. Citation2012). However, N utilized by plants accounts for only about 30% of the applied N (Coskun et al. Citation2017). It is urgent for us to reduce crop dependence on N fertilizer and to improve N use efficiency (Wei et al. Citation2022). Therefore, more efforts should be made to understand the tolerance or acclimation of plants to N deficiency, and thus to improve crop productivity.
N use efficiency can increase plant fitness (Rütting et al. Citation2018). However, the majority of leaf N in some plants is allocated to the photosynthetic system (Onoda et al. Citation2017; Evans and Clarke Citation2019). Thus, photosynthetic N use efficiency (PNUE) is a major indicator for evaluating low-N tolerance in plants (Kumar et al. Citation2002). PNUE is positively related to photosynthetic efficiency (Lei et al. Citation2021). However, significant decline in specific leaf N (SLN), Chl content and net photosynthetic assimilation rate (Pn) with the increasing degree of N deficiency results in a decreased PNUE in sun-demanding species Cannabis sativa, Panicum virgatum, and Saccharum spp. (Zhu et al. Citation2014; Saloner and Bernstein Citation2020; Tofanello et al. Citation2021). Meanwhile, PNUE is described as photosynthetic capacity per unit leaf N (Rotundo and Cipriotti Citation2017). Thus, the allocation of leaf N into photosynthetic apparatus significantly affects the PNUE (Onoda et al. Citation2004). The decrease of proportion for leaf N allocation into the carboxylation (PC) and bioenergetics (PB) components results in an inhibition to photosynthetic capacity and PNUE in shade-tolerant species Torreya jackii grown under N-deficient condition (Lu et al. Citation2021). The sun-demanding species Z. mays tends to allocate more N in the bioenergetics components under low N condition to reduce light-harvesting capacity, thus maintaining electron transport and increasing PNUE by 54% (Mu et al. Citation2016). Nevertheless, it is still unclear whether low-N-driven allocation of leaf N is correlated with the change of PNUE.
Chl fluorescence is closely associated with photosynthesis and is strongly influenced by low N stress (Tantray et al. Citation2020). N deficiency significantly suppress the maximum and the effective quantum yield of PSII (Fv/Fm and ϕPSII), consequently inducing PSII photoinhibition and decreasing photosynthetic capacity (Carpenter et al. Citation2014; Bascuñán-Godoy et al. Citation2018). Light-harvesting and photosynthetic efficiency are considerably reduced in N-deficient Spinacia oleracea, while high xanthophyll cycle and non-photochemical quenching (NPQ) enhances the dissipation of excess light energy (Verhoeven et al. Citation1997). Meanwhile, N deficiency inhibits the photochemical quenching (qP) and enhances NPQ in plants (Wang et al. Citation2022). The previous studies confirm that N deficiency is closely related to PSII activity and functions (Kalaji et al. Citation2014). A fast Chl a fluorescence (JIP-test) could assess the structure and function of PSII (Stirbet and Govindjee Citation2012; Murchie and Lawson Citation2013). The ability of the JIP method to uncover changes in PSII photochemistry is influenced by environmental factors, e.g. Cd stress, heat stress, and salt stress (Jedmowski and Brüggemann Citation2015; Chen et al. Citation2021b; Wang et al. Citation2022). There are some examples of the application of JIP method in high-N-stressed plant (Dudeja and Chaudhary Citation2005; Cun et al. Citation2021). However, relatively few studies have been conducted to assess low-N tolerance of PSII in terms of OJIP.
Panax notoginseng (Burkill) F. H. Chen (Sanqi in Chinese) is a perennial herb (the Panax genus, Araliaceae), which is a shade-tolerant species (Wen and Zimmer Citation1996; Jiang et al. Citation2020). The root of P. notoginseng has been used as a traditional Chinese medicinal material for thousands of years (Pharmacopoeia of the People’s Republic of China Citation2020). Photosynthetic capacity and accumulation of root biomass peaked in response to 9.6–11.5% light transmittance (Chen et al. Citation2016). Additionally, N surplus lead maximum root yield, but excessive N increases the incidence of root rot in P. notoginseng (Chen et al. Citation2018; Zhang et al. Citation2020b). PNUE, photosynthetic efficiency, photoprotection capacity, root biomass, and yield are significantly suppressed in P. notoginseng grown under high N condition (450 kg·ha−1) (Zhang et al. Citation2020a, Citation2020b; Cun et al. Citation2021). Thus, P. notoginseng has also been a high-N sensitive species or a low-N tolerant species. Nevertheless, previous studies have mainly elucidated the effect of high N on photosynthetic performance in the N-sensitive and shade-tolerant species P. notoginseng. Low-N-grown P. notoginseng possess a higher survival rate and higher PNUE than high-N-grown individuals (Ou et al. Citation2020; Zhang et al. Citation2020a). SLN, Chl content, photosynthetic efficiency are reduced in P. notoginseng grown under low N condition, but the economic yield is significantly elevated (Ou et al. Citation2020; Zhang et al. Citation2020a, Citation2020b; Cun et al. Citation2021). However, it is not very well known about the acclimation of shade-tolerant and high-N sensitive species to N deficiency. In the present study, leaf morpho-physiological traits, leaf N allocation and photosynthetic efficiency, PNUE, and OJIP kinetics curves were examined in P. notoginseng grown under different nitrogen deficiency levels. We anticipated that: (i) leaf growth is limited in P. notoginseng grown under N-deficient condition; (ii) N deficiency inhibits leaf N allocation into the carboxylation and bioenergetics components; (iii) N deficiency induces photodamage to PSII of P. notoginseng.
2. Materials and methods
2.1. Experiment design
The pot experiment was carried out from January 2021 to November 2021 in Kunming (102°45'E, 25°08'N), Yunnan Province, China. An environmentally controlled house with about 10% full sunlight irradiance was used for the pot experiments (Zhang et al. Citation2021). The raw soil has the physical and chemical properties as showed in .
Table 1. Analysis of soil physical and chemical properties.
Three replicates were used in a complete randomized block design, including three dosages of N fertilizer: (i) without N fertilizer addition (severe N deficiency), N0; (ii) N fertilizer applied at 7.5 kg·N·667 m−2 (mild N deficiency), N7.5; and (iii) N fertilizer applied at 15 kg·N·667 m−2 (normal N), N15. Each N level was replicated by three plot (n = 3), there were 40 pots in each plot, 120 pots were used for each N levels, and a total of 360 pots were arranged. All treatments except N fertilizer received the same phosphate (15 kg·P2O5·667 m−2) and potassium (30 kg·K2O·667 m−2) fertilizers. Compound fertilizer (32% N, 4% P2O5), calcium superphosphate (52% P2O5, 34% K2O), and potassium sulfate (52% K2O) were used. Fertilizer was applied in four splits: mid-May, -June, -July, and -August 2021, respectively. The use of chemicals was used to control weeds, pests, and diseases. In November 2021, after the measurement of photosynthetic parameters, the leaf area, dry matter, Chl, and N content were determined.
2.2. Measurement of gas exchange parameters
Between 08:30 am and 11:30 am, selected leaves were measured for Pn – PPFD (photosynthetic photon flux density) and Pn - Ci (internal leaf CO2 concentrations) response curves using a photosynthesis system (LI-6400XT, Li-Cor, USA). The leaf chamber temperature and the air flow rate were set as 25°C and 400 μmol·s−1, respectively. For the measurement of Pn – PPFD response curves, the CO2 concentrations of leaf chamber was set at 400 μmol·CO2·mol−1 (with 10% blue light). It was adjusted based on the following light intensity regimes: 800, 500, 300, 250, 200, 150, 100, 80, 60, 40, 20, and 0 μmol·photons·m−2·s−1; for the measurement of the Pn – Ci response curves, the PPFD of leaf chamber was set 500 μmol·photons·m−2·s−1 (with 10% blue light). It was adjusted based on the following CO2 concentrations regimes: 400, 300, 250, 200, 150, 100, 50, 400, 500, 600, 800, 1000, 1200, and 1500 μmol·CO2·mol−1. The maximum net photosynthetic rate (Pmax), the light compensation point (LCP), the light saturating point (LSP), the dark respiration rate (Rd), the maximum carboxylation rate (Vcmax), and the maximum electron transport rate (Jmax), were calculated using the Pn − PPFD/Pn − Ci response curve according to the method suggested by Long and Bernacchi (Citation2003).
2.3. Determination of chlorophyll fluorescence characteristics
Dual-PAM 100 chlorophyll (Chl) fluorometer (Heinz Walz Gmbh, Effeltrich, Germany) was used to determine Chl fluorescence parameters and fast Chl fluorescence kinetics curves (OJIP kinetics curves). After dark adaptation of 3 h, the leaf of P. notoginseng was exposed to saturating (8000 μmol·photons·m−2·s−1) red (652 nm) actinic light for 1 s, and fluorescence intensity at the O (20 μs), J (2 ms), I (30 ms), and P (300 ms) step were quantified along with the initial slope of the fluorescence transient (MO). Immediately after that, in accordance with the method suggested by Strasser et al. (Citation2000, Citation2004), several additional parameters would be calculated.
2.4. Pigment measurements
Chl was extracted as described by Pérez-Patricio et al. (Citation2018). A Li-3000 leaf-area meter (Li-Cor, USA) was used to determine leaf area. 0.5 g of fresh leaves were immersed in a 15 mL extraction mixture [99% acetone was mixed with ethanol (2:1 v/v)]. 3 h of standing in the dark were followed by a 10 min centrifugation at 3000 rpm. Absorbance readings were performed at wavelengths of 665 and 649 nm. Chl a and b content were calculated based on the method of Gu et al. (Citation2016). Total Chl content was the sum of Chl a and b.
2.5. Calculation of N allocation in photosynthetic apparatus
After completing photosynthetic measurements, the leaf was oven-dried separately, at 60°C for 96 h. SLA (specific leaf area, cm2·g−1), LAR (leaf area ratio, cm2·g−1), and LMA (leaf mass per unit area, g·cm−2) were calculated based on dry leaf matter and leaf area. The leaf N content was determined using Kjeldahl's method (Lynch and Barbano Citation1999). Photosynthetic N use efficiency (PNUE, μmol·g−1·N·s−1) was calculated as the ratio of Pmax and Specific leaf N (SLN, g·m−2) (Gao et al. Citation2020). Based on the method suggested by Niinemets and Tenhunen (Citation1997), N allocation were calculated for each component of the photosynthetic apparatus.
where PC is the coefficients for leaf N allocation into the carboxylation component. PB is the coefficient for leaf N allocation into the bioenergetics component. PL is the coefficient for leaf N allocation into the light-harvesting system component. Ppsn is the coefficient for leaf N allocation in photosynthetic components. Pnon-psn is the coefficient for leaf N allocation in non-photosynthetic components. NC is the N content in the carboxylation component. NB is the N content in bioenergetics component. NL is the N content in the light-harvesting system component. Npsn is the N content in photosynthetic components. Nnon-psn is the N content in non-photosynthetic components. Vcr is the specific activity of Rubisco (20.78 μmol·CO2·g−1·Rubisco·s−1) at 25°C. Jmc is the potential rate of photosynthetic electron transport (155.65 μmol·electrons·mmol−1·Cyt f·s−1) at 25°C. CC is the Chl content (mmol·m−2). CB is the ratio of Chl to organic N in light-harvesting components (2.15 mmol·g−1) at 25°C (Nolan and Smillie Citation1977; Jordan and Ogren Citation1984).
2.6. Statistical analysis
One-way ANOVA was applied to assess the differences in each parameter among the treatments with the SPSS 20.0 statistical software packages. Significant differences (P < 0.05) among treatments are indicated by different letters using the least significant difference test (n = 3). GraphPad 8.0 software was used to make a plot.
3. Results
3.1. Effects of N supply on leaf Chl and N content
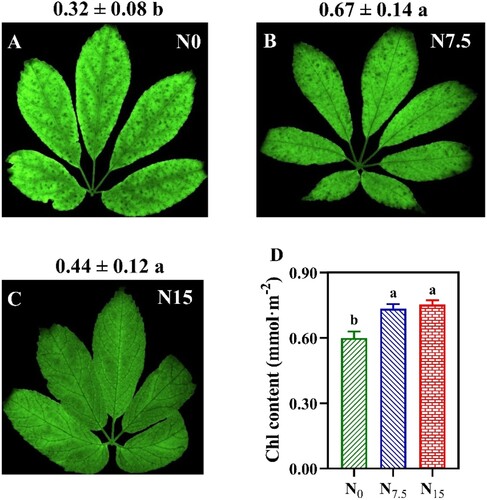
The minimum values of leaf N content and SLN were recorded in N0-grown P. notoginseng (, P < 0.05), but there was no significant difference in the leaf N content between N7.5 and N15 conditions (A, P > 0.05). Chl content was increased with the N application, and Chl Index (Chlldx) and Chl content in N0-grown plants were significantly lower than that in N7.5- and N15-grown individuals (, P < 0.05).
Figure 1. The contents of leaf nitrogen in Panax notoginseng grown under different nitrogen levels. (A) Nitrogen content in leaf (%); (B) SLN is the specific leaf nitrogen (g·m−2). Green represents N0, bule represents N7.5, red represents N15. Values for each point were means ± SD (n = 3). Significant differences are indicated by letters (ANOVA; P < 0.05).
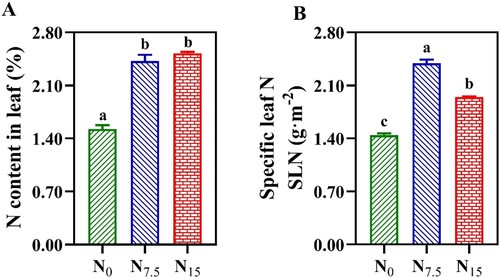
Figure 2. The contents of chlorophyll (Chl) in P. notoginseng grown under different nitrogen levels. Chl Index (Chlldx) imaging were obtained using a multifunctional plant photosynthetic phenotyping system (Plant Explorer Pro+) (A–C); (D) Chl contents (mmol·m−2). Values for each point were means ± SD (n = 3). Significant differences are indicated by letters (ANOVA; P < 0.05).
3.2. Leaf structural traits in response to N levels
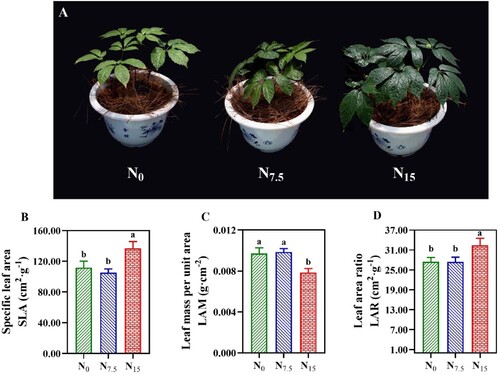
Leaf phenotypic and structural traits differed significantly among N levels (A). The maximum values of SLA and LAR were obtained in P. notoginseng grown under N15 conditions (B,D; P < 0.05). Lower LAM was recorded in N15-grown plants than the N0 and N7.5 plants (C, P < 0.05). There was no significant difference in SLA, LAR, and LAM of P. notoginseng between N0 and N7.5 conditions (B–D, P > 0.05).
Figure 3. Leaf phenotypic traits in P. notoginseng grown under different nitrogen deficiency levels (A). (B) SLA is the specific leaf area (cm2·g−1); (C) LAM is the leaf mass per unit area (g·cm−2); (D) LAR is the leaf area ratio (cm2·g−1). Green represents N0, bule represents N7.5, red represents N15. Values for each point were means ± SD (n = 3). Significant differences are indicated by letters (ANOVA; P < 0.05).
3.3. Responses of photosynthetic gas exchange parameters to N regimes
In the Pn – PPFD response curves, Pn, Pmax, LCP, and LSP were higher in the N15-grown plants compared with N0- and N7.5-grown P. notoginseng (A and ; P < 0.05). The minimum values of Pn, Pmax, LCP, LSP, and Rd were shown in N0-grown plants (A and ; P < 0.05). In the Pn – Ci response curves, Pn, CE (carboxylation efficiency), RL (light respiration rate), Vcmax, Jmax, and Jmax / Vcmax were not significantly different among N levels (B and ; P > 0.05).
Figure 4. The response of net photosynthetic rate (Pn) to nitrogen regimes. (A) Response of Pn to photosynthetic photon flux density (PPFD) in P. notoginseng grown under different N levels; (B) The change of Pn with intercellular CO2 concentration (Ci) in P. notoginseng grown under different nitrogen levels. Green represents N0, bule represents N7.5, red represents N15. Values for each point were means ± SD (n = 3).
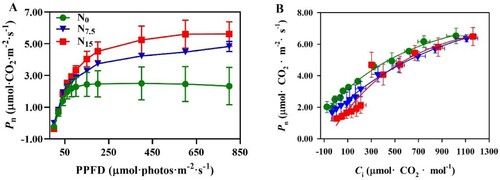
Table 2. The effect of nitrogen deficiency on leaf photosynthetic-related parameters of P. notoginseng.
3.4. N-driven changes in photosynthetic N allocation
Different proportions of leaf N were allocated among carboxylation, bioenergetics, and light-harvesting components (). PC, PL, and Ppsn in the N0-grown plants were significantly higher than others ( and ; P < 0.05). PB was positively correlated with N levels, and the minimum values of PB and Pnon-psn were recorded in N0-grown P. notoginseng ( and ).
Figure 5. Nitrogen allocation in leaves of P. notoginseng at different nitrogen levels. (A) Leaf nitrogen allocation under N0; (B) Leaf nitrogen allocation under N7.5; (C) Leaf nitrogen allocation under N15. The data outside of the brackets are the nitrogen content of components, the units is g·m−2; the data in the brackets are the allocation of the nitrogen content, the unit is percentage (%); the data of inner-circle indicate the leaf total nitrogen content, the units is g·m−2. Values for each point were means (n = 3). See an explanation of trait abbreviations in Abbreviations.
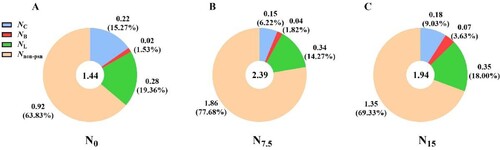
Table 3. Effects of different N deficiency levels on N allocation within the photosynthetic apparatus of P. notoginseng.
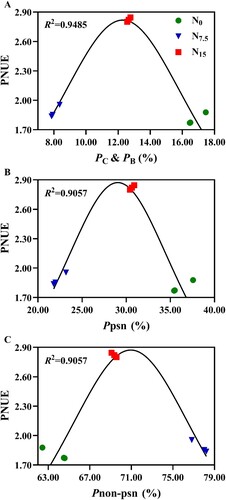
The obvious differences in Npsn were not observed within N0 and N7.5 treatments (). NL was 17.6% and 20.0% higher in the N7.5 and N15 individuals than in the N0 individuals, respectively (). NC was increased by 46.67% and 22.22% in N0-grown plants compared with N7.5- and N15-grown P. notoginseng, respectively (). NB was increased with N levels, and NB was increased by 71.43% in N15-grown plants compared with N0-grown plants (). PNUE in N15-grown plants was significantly higher than that in the N0- and N7.5-grown P. notoginseng (, P < 0.05), and the obvious differences in PNUE were not observed within N7.5 and N15 conditions (, P > 0.05). Moreover, PNUE firstly increases and then decreases with the increase of PC & PB (R2 = 0.9485, A), Ppsn (R2 = 0.9057, B), and Pnon-psn (R2 = 0.9057, C).
Figure 6. The response of photosynthetic nitrogen use efficiency (PNUE) to nitrogen regimes. Green represents N0, bule represents N7.5, red represents N15. Values for each point were means ± SD (n = 3). Significant differences are indicated by letters (ANOVA; P < 0.05).
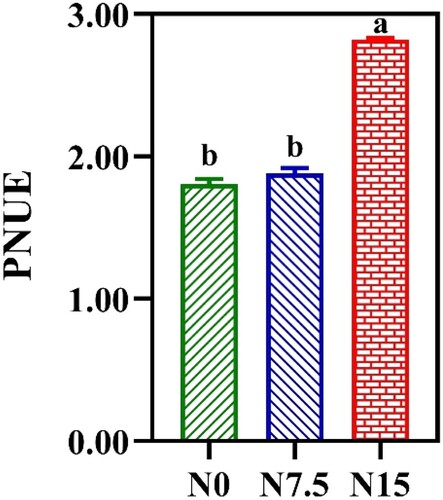
Figure 7. Relationship between photosynthetic nitrogen use efficiency and N allocation of P. notoginseng under N regimes. (A) Correlation between the PNUE and PC & PB in P. notoginseng. (B) Correlation between the PNUE and Ppsn in P. notoginseng. (C) Correlation between the PNUE and Pnon-psn in P. notoginseng. Green represents N0, bule represents N7.5, red represents N15. Values for each point were means (n = 3).
3.5. Chl fluorescence characteristics in response to N levels
Chl fluorescence induction kinetics showed an ‘S’ shape (OJIP type) in all treatments (A). Compared with the N15-grown plants, Chl fluorescence was higher in N0 and N7.5-grown individuals when the time was 300 μs, and the N0- and N7.5-grown plants showed higher K phase (ΔK > 0, B). Interestingly, the levels of ΔI was increased and decreased in the N7.5 and N0 plants, respectively, compared with the N15 plants (B).
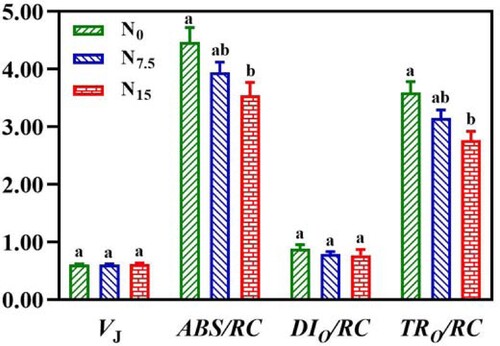
Figure 8. Effects of nitrogen levels on chlorophyll fluorescence transients of P. notoginseng. (A) O, J, I, and P phase represent the fluorescence at T = 20 μs, 2, 30 and 300 ms, respectively. (B) Effects of nitrogen levels on relative variable fluorescence (ΔVt). ΔVt = V(treatment)-V(control), ΔK, ΔJ and ΔI represent the relative variable fluorescence at T = 300 μs, 2, 30 ms. (C) The radar diagram of JIP-test index under different N levels. Green represents N0, bule represents N7.5, red represents N15. Values for each point were means (n = 3).
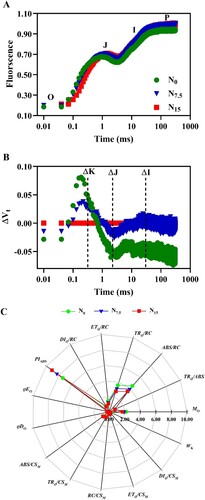
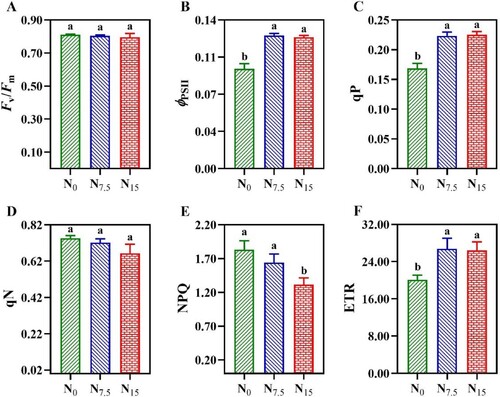
As showed in C and , there were no significant differences in VJ and DIO/RC among N levels (P > 0.05). N addition decreased the absorption and capture of light energy per unit area (ABS/RC and TRO/RC) and electron transport of quantum yield per unit area (ETO/RC), thus showing significant differences (C,). However, the maximum value of PIABS (performance index on an absorption basis) was recorded in N15-grown P. notoginseng (C). Fv/Fm and qN exhibited no significant changes under N regimes (A,D; P > 0.05). ϕPSII, qP, and ETR in N0-grown plants were significantly lower than ones in N7.5- and N15-grown P. notoginseng (B,C,F; P < 0.05). Moreover, ϕPSII, qP, and ETR were not significantly different between N7.5 and N15 conditions (B,C,F; P > 0.05). NPQ was lower in the N15-grown plants compared with the N7.5 and N0 plants (E; P < 0.05).
Figure 9. Chlorophyll fluorescence transients in P. notoginseng grown under different N levels. Green represents N0, bule represents N7.5, red represents N15. Values for each point were means ± SD (n = 3). Significant differences are indicated by letters (ANOVA; P < 0.05).
3.6. The sensitivity of different parameters in response to N deficiency
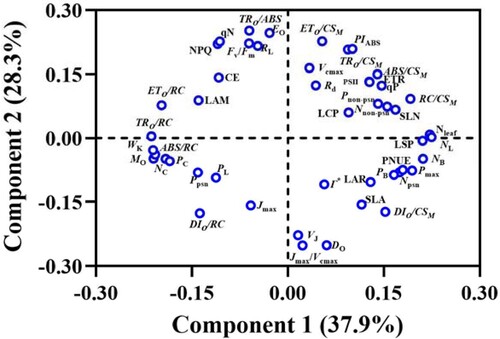
Multivariate comparisons were carried out with the mean values of photosynthetic-related parameters in P. notoginseng grown under different N levels. The first two axes of the principal component analysis (PCA) explained 66.2% (PC1, 37.9%; PC2, 28.3%) of the total variation of the 48 photosynthetic-related parameters (). Leaf N content, NL, LSP, and NB parameters showed larger weighting coefficients, and demonstrated a positive correlation with PC1 and contributed more to PC1 ( and Table S1). Loading coefficients showed that WK (FO and the redox degree of the PSII donor side), TRO/RC, and ABS/RC have a negative correlation with PC1 and contributed more to PC1 ( and Table S1).
Figure 11. A principal component analysis for 48 photosynthetic-related parameters in P. notoginseng grown under different nitrogen deficiency levels.
4. Discussion
4.1. Plants adapt to N deficiency by reducing the light-harvesting area and inhibiting leaf growth
Changes in leaf structure are commonly quantified by SLA, LMR, and LAR (Evans Citation1989; Díaz et al. Citation2016). The maximum values of the SLA, LAR, and Chl content were obtained in N15-grown P. notoginseng (B,D; P < 0.05). This has been confirmed by the fact that Chl content, SLA, and LAR of Rauvolfia vomitoria is reduced with a decrease in N application (Li et al. Citation2010). Low SLA and LAR indicate that light-harvesting leaf area per unit biomass is reduced (Weraduwage et al. Citation2015; Wu et al. Citation2018). Thus, photosynthetic capacity (as reflected by Pn and Pmax) was inhibited in P. notoginseng grown under N0 and N7.5, partly due to a decrease in light-harvesting area ( and ). This interpretation is consistent with the previous study that photosynthesis is considerably decreased in Oryza sativa grown under N deficiency (Shao et al. Citation2020). Meanwhile, Pn, SLN, and Chl declined in N-deficient P. notoginseng (,,), and this might result in the reduced light energy absorption and utilization as suggested by Niinemets (Citation2010). Additionally, biomass allocation is an essential strategy for plants to respond to N stress (Mccarthy and Enquist Citation2007; Chen et al. Citation2021a). The decrease of SLA and LAR indicates that N deficiency force more biomass to be allocated to roots, thus promotes N and water uptake as observed in Malus domestica (; Wang et al. Citation2019).
4.2. Lower N content of photosynthetic components reduces PNUE in N-deficient plants
N allocation affects the photosynthesis-N relationship and the acclimation to N deficiency (Zhong et al. Citation2019). Lower leaf N is allocated to the carboxylation and bioenergetics components in Betula alnoides and T. jackii with the low N input, eventually resulting in lower PNUE (Tang et al. Citation2019; Lu et al. Citation2021). In the present study, PC, PL, and Ppsn in N0-grown plants were significantly higher than ones in the N7.5- and N15-grown plants ( and ; P < 0.05), but NB, NC, and PNUE were reduced with the increase of N levels (,). These results imply that a larger proportion of leaf N would be allocated to photosynthetic components under severe N deficiency. However, the N content in carboxylation and bioenergetics components were reduced, as a corollary to this, also decreases PNUE and photosynthetic efficiency. This is consistent with the results reported by Mao et al. (Citation2012) that photosynthetic N allocation between carboxylation and bioenergetics components is the vital factor limiting PNUE, as reflected by the decrease in Pnet, Pmax, PNUE, LSP, and LSP under the N0 and N7.5 conditions (). However, the optimized allocation of leaf N in carboxylation and bioenergetics components would lead to an increased PNUE of P. notoginseng (N15 conditions) and Catalpa bungee (A; Xiao et al. Citation2019).
Higher SLN and Chl induces the enhancement of light-harvesting capacity (Niinemets Citation2010). Evidence is accumulating that Chl content, SLN, and light-harvesting capacity are decreased in N-deficient Camellia sinensis and Mitragyna speciosa (Zhang et al. Citation2020c; Lin et al. Citation2021). Chl content, SLN, and PNUE were declined in N0-grown plants (,,), but higher NL and PL were recorded in P. notoginseng grown under N15 conditions (; ,). This has also been confirmed by the previous study that PNUE is positively correlated with NL in O. sativa and C. bungee (Xiao et al. Citation2019; Zhong et al. Citation2019; ). It might be speculated that leaf N deficiency might cause the imbalance between the absorption and utilization of light energy, thus leading to a depressed PNUE and photosynthetic capacity. Furthermore, the increase of N allocation to leaves is an effective strategy for improving carbon fixation and PNUE (Perchlik and Tegeder Citation2018). The previous observation is consistent with our results that Npsn, PNUE and photosynthetic capacity were increased in N15-grown P. notoginseng (; ,,B). More leaf N is allocated to structural and defense components, and thus promoting the growth of Ulmus americana (Reich et al. Citation1989). Hence, higher PNUE might be the underlying reason for the superior photosynthesis and the growth of N15-grown plants (,). In short, the reduction of N allocation in carboxylation and bioenergetics components leads to a decrease in PNUE and photosynthetic capacity of P. notoginseng under N deficiency.
4.3. N deficiency induces photodamage of PSII reaction centers
N deficiency leads to a decline in photosynthetic protein synthesis, resulting in photoinhibition or photodamage of the PSII (Chen et al. Citation2003; Cisse et al. Citation2020). PIABS could reflect the activity of PSII compared with Fv/Fm (Crafts-Brandner and Salvucci Citation2002). In the present study, Fv/Fm did not change, and PIABS was obviously decreased in N0- and N7.5-grown P. notoginseng (C and A). PSII activity is suppressed in N-deficient P. notoginseng during the process of light reaction, and this may lead to PSII photoinhibition or photodamage. A similar effect has been observed in N-deficient Tritium aestivum and Coffea arabica (Pompelli et al. Citation2010; Gao et al. Citation2018; Li et al. Citation2021). The inability to utilize and dissipate excess light energy rapidly is a main cause of photoinhibition or photodamage in N-deficient plants (Raven Citation2011; Zhang et al. Citation2015). N deficiency induced a significant reduction in ϕPSII (), indicating a decline in the utilization efficiency of light energy as reflected by TRO/RC, ETR, and qP (Wang et al. Citation2016). However, NPQ was significantly improved under N deficiency (). The proportion of light energy allocated to thermal dissipation, PSII photochemistry and fluorescence would be imbalanced in plants grown under N-deficient condition (Demmig-Adams et al. Citation1996; Shuang et al. Citation2022). A similar effect has also been observed in Petiveria alliacea grown under N deficiency condition (Zuluaga et al. Citation2004). Meanwhile, K phases were raised in N0- and N7.5-grown plants (B,), and N deficiency reduced the OEC activity and prevented the release of oxygen and electrons, thus resulting in a decrease in electron transport (; Oukarroum et al. Citation2007). The photochemical efficiency of PSII and the activity of PSII reaction centers would be decreased, and photodamage of PSII would occur in Porphyridium cruentum grown under N starvation (Zhao et al. Citation2017). N deficiency might induce the accumulation of ROS, and this can directly damage the thylakoid membranes of the chloroplasts, consequently resulting in the destruction of the PSII reaction center and rendering these membranes unable to carry out electron transport (; Xiang et al. Citation2021). These results imply that light-harvesting capacity and electron flux are decreased in high-N sensitive P. notoginseng grown under N deficiency condition, and however thermal dissipation is enhanced. In a word, an imbalance of light energy allocation between thermal dissipation and electron transports might be the main reason for the damage of PSII reaction centers in high-N sensitive P. notoginseng grown under N deficiency condition.
Figure 10. Chlorophyll fluorescence transients in P. notoginseng grown under different N levels. (A) Fv/Fm is the maximum photochemical efficiency of PSII under dark adaptation; (B) ϕPSII is the effective quantum yield of PSII photochemistry; (C) qP is the photochemical quenching; (D) qN is the non-photochemical quenching coefficient; (E) NPQ is the non-photochemical quenching; (F) ETR is the electron transport rate. Green represents N0, bule represents N7.5, red represents N15. Values for each point were means ± SD (n = 3). Significant differences are indicated by letters (ANOVA; P < 0.05).
5. Conclusion
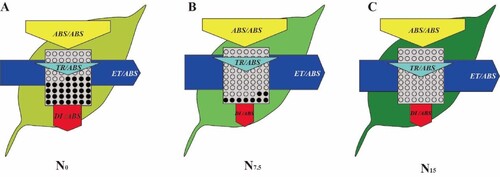
Leaf growth, N allocation to the photosynthetic system were obviously inhibited in high-N sensitive and shade-tolerant plants grown under N deficiency, leading to a decrease in PNUE and photosynthetic capacity. To further analyze the mechanism of suppressed photosynthesis under N deficiency condition, the damaged model diagrams were proposed for the PSII reaction center in the high-N sensitive and shade-tolerant species represented by P. notoginseng under N-deficient conditions (). N deficiency reduces Chl and N content in leaf. Light-harvesting capacity and electron flux are reduced in high-N sensitive and shade-tolerant species grown under N deficiency, and thermal dissipation is enhanced. The imbalanced allocation of light energy leads to a damage of PSII reaction centers in N-deficient plants. Overall, the inhibition of leaf growth as well as the suppression of photosynthetic capacity by reducing leaf N allocation to photosynthetic components and by damaging PSII reaction centers are the essential strategy for the high-N sensitive and shade-tolerant plants to respond to N deficiency
Figure 12. A damage model diagrams were proposed for the PSII reaction center in the N-sensitive and shade-tolerant species P. notoginseng under N-deficient conditions. The light capture capacity was significantly reduced under N-deficient stress (there were many black sites in TR/ABS), electron flux decreased (ET/ABS decreased), and thermal dissipation increased (DI/ABS increased), indicating the imbalance of the light energy allocation strategy. The shade of leaf color represents the level of leaf nitrogen content. ABS/ABS is the absorbed light energy; TR/ABS is the quantum yield of PSII photochemistry; ET/ABS is the quantum yield of electron transport; DI/ABS is the quantum yield of thermal dissipation. Each part of the graphic element represents a value of the activity of the photoreaction center. Changes in shape and size all represent that the activity is affected, and the black dot represents damage. (A) N0; (B) N7.5; (C) N15.
Author contributions
Jun-Wen Chen: conceiving and designing the project. Zhu Cun: analyzing the data and writing the paper. Hong-Min Wu, Jin-Yan Zhang, Sheng-Pu Shuang, Jie Hong: performing data analysis and correcting the manuscript. Hong-Chao Zhao, Jing Yang, Li-Lin Gao: participating in the construction of shade-house and pot experiments. All authors agree to the publication of this article.
Supplemental Material
Download MS Word (21.2 KB)Disclosure statement
No potential conflict of interest was reported by the author(s).
Additional information
Funding
Notes on contributors
Zhu Cun
Zhu Cun PhD at Yunnan Agricultural University, Kunming, China. Research interests: plant ecophysiology and plant nutrition, mainly including photosynthesis of plants, interaction between plants and light/nitrogen, and the effects of nitrogen on the accumulation of secondary metabolites in medicinal plants. Published in international journals as first author: Photosynthesis research, Frontiers in plant science.
Sheng-Pu Shuang
Sheng-Pu Shuang a master candidate at Yunnan Agricultural University, Kunming, China. Research interests: photosynthesis of plants, mainly including interaction between plants and light intensities. Published in international journals as first author: Published in international journals as first author: Frontiers in plant science.
Jin-Yan Zhang
Jin-Yan Zhang PhD at Yunnan Agricultural University, Kunming, China. Research interests: plant ecophysiology and plant nutrition, mainly including photosynthesis of plants, interaction between plants and light/nitrogen, and the effects of nitrogen on the accumulation of secondary metabolites in medicinal plants. Published in international journals as first author: Industrial crops and products, BMC plant biology, Plant physiology and biochemistry, Frontiers in plant science, Acta physiologiae plantarum, et al.
Jie Hong
Jie Hong a master candidate at Yunnan Agricultural University, Kunming, China. Research interests: plant ecophysiology, mainly including interaction between soil microorganism and light/nitrogen.
Hong-Min Wu
Hong-Min Wu a master candidate at Yunnan Agricultural University, Kunming, China. Research interests: plant ecophysiology and plant nutrition, mainly including the effects of nitrogen on the accumulation of secondary metabolites in medicinal plants.
Jing Yang
Jing Yang a master candidate at Yunnan Agricultural University, Kunming, China. Research interests: photosynthesis of plants, interaction between plants and light/nitrogen.
Hong-Chao Zhao
Hong-Chao Zhao PhD at Yunnan Agricultural University, Kunming, China. Research interests: photosynthesis of plants, interaction between plants and light/nitrogen.
Li-Lin Gao
Li-Lin Gao a master candidate at Yunnan Agricultural University, Kunming, China. Research interests: photosynthesis of plants, mainly including interaction between plants and light intensities.
Jun-Wen Chen
Jun-Wen Chen The professor of Yunnan Agricultural University, Kunming, China. He has studied in the plant ecophysiology field for over 15 years. He has published more than 60 scientific papers.
References
- Alves Negrini AC, Evans JR, Kaiser BN, Millar AH, Kariyawasam BC, Atkin OK. 2020. Effect of N supply on the carbon economy of barley when accounting for plant size. Funct Plant Biol. 47(4):368–381.
- Bascuñán-Godoy L, Sanhueza C, Hernández CE, Cifuentes L, Pinto K, Álvarez R, González-Teuber M, Bravo LA. 2018. Nitrogen supply affects photosynthesis and photoprotective attributes during drought-induced senescence in Quinoa. Front Plant Sci. 9:994. doi:10.3389/fpls.2018.00994.
- Carpenter KL, Keidel TS, Pihl MC, Hughes NM. 2014. Support for a photoprotective function of winter leaf reddening in nitrogen-deficient individuals of Lonicera japonica. Molecules. 19(11):17810–17828.
- Chen JW, Kuang SB, Long GQ, Yang SC, Meng ZG, Li LG, Chen ZJ, Zhang GH. 2016. Photosynthesis, light energy partitioning, and photoprotection in the shade-demanding species Panax notoginseng under high and low level of growth irradiance. Funct Plant Biol. 43(6):479–491.
- Chen R, Ran J, Hu W, Dong L, Ji M, Jia X, Lu J, Gong H, Aqeel M, Yao S, et al. 2021a. Effects of biotic and abiotic factors on forest biomass fractions. Natl Sci Rev. 8:nwab025.
- Chen X, Zhou Y, Cong Y, Zhu P, Xing J, Cui J, Xu W, Shi Q, Diao M, Liu HY. 2021b. Ascorbic acid-induced photosynthetic adaptability of processing tomatoes to salt stress probed by fast OJIP fluorescence rise. Front Plant Sci. 12:594400.
- Chen Y, Murchie EH, Hubbart S, Horton P, Peng S. 2003. Effects of season-dependent irradiance levels and nitrogen-deficiency on photosynthesis and photoinhibition in field-grown rice (Oryza sativa). Physiol Plant. 117(3):343–351.
- Chen YM, Zhang JY, Xu X, Qu HY, Hou M, Zhou K, Jiao XG, Sui YY. 2018. Effects of different irrigation and fertilization practices on nitrogen leaching in facility vegetable production in northeastern China. Agric Water Manag. 210:165–170.
- Cisse A, Zhao X, Fu W, Kim RER, Chen T, Tao L, Feng B. 2020. Non-photochemical quenching involved in the regulation of photosynthesis of rice leaves under high nitrogen conditions. Int J Mol Sci. 21(6):2115. doi:10.3390/ijms21062115.
- Coskun D, Britto DT, Shi W, Kronzucker HJ. 2017. Nitrogen transformations in modern agriculture and the role of biological nitrification inhibition. Nat Plants. 3:17074. doi:10.1038/nplants.2017.74.
- Crafts-Brandner SJ, Salvucci ME. 2002. Sensitivity of photosynthesis in a C4 plant, maize, to heat stress. Plant Physiol. 129(4):1773–1780.
- Cun Z, Zhang JY, Wu HM, Zhang L, Chen JW. 2021. High nitrogen inhibits photosynthetic performance in a shade-tolerant and N-sensitive species Panax notoginseng. Photosynth Res. 147(3):283–300.
- Demmig-Adams B, Adams WWIII, Barker DH, Logan BA, Bowling DR, Verhoeven AS. 1996. Using chlorophyll fluorescence to assess the fraction of absorbed light allocated to thermal dissipation of excess excitation. Physiol Plantarum. 98:253–264.
- Díaz S, Kattge J, Cornelissen JH, Wright IJ, Lavorel S, Dray S, Reu B, Kleyer M, Wirth C, Prentice IC, et al. 2016. The global spectrum of plant form and function. Nature. 529(7585):167–171.
- Dudeja SS, Chaudhary P. 2005. Fast chlorophyll fluorescence transient and nitrogen fixing ability of chickpea nodulation variants. Photosynthetica. 43:253–259.
- Evans JR. 1989. Photosynthesis and nitrogen relationships in leaves of C3 plants. Oecologia. 78(1):9–19.
- Evans JR, Clarke VC. 2019. The nitrogen cost of photosynthesis. J Exp Bot. 70(1):7–15.
- Gao J, Wang F, Sun J, Tian Z, Hu H, Jiang S, Luo Q, Xu Y, Jiang D, Cao W, Dai T. 2018. Enhanced Rubisco activation associated with maintenance of electron transport alleviates inhibition of photosynthesis under low nitrogen conditions in winter wheat seedlings. J Exp Bot. 69(22):5477–5488.
- Gao L, Lu Z, Ding L, Xie K, Wang M, Ling N, Guo S. 2020. Anatomically induced changes in rice leaf mesophyll conductance explain the variation in photosynthetic nitrogen use efficiency under contrasting nitrogen supply. BMC Plant Biol. 20(1):527. doi:10.1186/s12870-020-02731-7.
- Gu DD, Wang WZ, Hu JD, Zhang XM, Wang JB, Wang BS. 2016. Nondestructive determination of total chlorophyll content in maize using three-wavelength diffuse reflectance. J Appl Spectrosc. 83:541–547.
- Jedmowski C, Brüggemann W. 2015. Imaging of fast chlorophyll fluorescence induction curve (OJIP) parameters, applied in a screening study with wild barley (Hordeum spontaneum) genotypes under heat stress. J Photochem Photobiol B. 151:153–160.
- Jian J, Zeng D, Wei W, Lin H, Li P, Liu W. 2017. The combination of RNA and protein profiling reveals the response to nitrogen depletion in Thalassiosira pseudonana. Sci Rep. 7(1):8989. doi:10.1038/s41598-017-09546-x.
- Jiang Z, Tu L, Yang W, Zhang Y, Hu T, Ma B, Lu Y, Cui X, Gao J, Wu X, et al. 2020. The chromosome-level reference genome assembly for Panax notoginseng and insights into ginsenoside biosynthesis. Plant Commun. 2(1):100113.
- Jordan DB, Ogren WL. 1984. The CO2/O2 specificity of ribulose 1,5-bisphosphate carboxylase/oxygenase: dependence on ribulosebisphosphate concentration, pH and temperature. Planta. 161(4):308–313.
- Kalaji HM, Oukarroum A, Alexandrov V, Kouzmanova M, Brestic M, Zivcak M, Samborska IA, Cetner MD, Allakhverdiev SI, Goltsev V. 2014. Identification of nutrient deficiency in maize and tomato plants by in vivo chlorophyll a fluorescence measurements. Plant Physiol Biochem. 81:16–25.
- Kumar PA, Parry MAJ, Mitchell RAC, Ahmad A, Abrol YP. 2002. Photosynthesis and nitrogen-Use efficiency. In: Foyer C.H., Noctor G, editors. Photosynthetic nitrogen assimilation and associated carbon and respiratory metabolism. advances in photosynthesis and respiration. Dordrecht: Springer, vol. 12; p. 23–24.
- Lei ZY, Wang H, Wright IJ, Zhu XG, Niinemets Ü, Li ZL, Sun DS, Dong N, Zhang WF, Zhou ZL, et al. 2021. Enhanced photosynthetic nitrogen use efficiency and increased nitrogen allocation to photosynthetic machinery under cotton domestication. Photosynth Res. 150(1-3):239–250.
- Li H, Li J, Zhang X, Shi T, Chai X, Hou P, Wang Y. 2021. Mesophyll conductance, photoprotective process and optimal N partitioning are essential to the maintenance of photosynthesis at N deficient condition in a wheat yellow-green mutant (Triticum aestivum L. J Plant Physiol. 263:153469.
- Li L, Cai CT, Liu GZ. 2010. Effect of light and nitrogen level on leaf growth and photosynthesis of rauvolfia vomitoria. J Wuhan Botanical Res. 28(2):206–212.
- Lin ZH, Chen CS, Zhong QS, Ruan QC, Chen ZH, You XM, Shan RY, Li XL. 2021. The GC-TOF/MS-based metabolomic analysis reveals altered metabolic profiles in nitrogen-deficient leaves and roots of tea plants (Camellia sinensis). BMC Plant Biol. 21(1):506. doi:10.1186/s12870-021-03285-y.
- Long SP, Bernacchi CJ. 2003. Gas exchange measurements, what can they tell us about the underlying limitations to photosynthesis? Procedures and sources of error. J Exp Bot. 54(392):2393–2401.
- Lu Y, Ma Q, Chen C, Xu X, Zhang D. 2021. Effects of arbuscular mycorrhizal fungi on the nitrogen distribution in endangered Torreya jackii under nitrogen limitation. Planta. 254(3):53. doi:10.1007/s00425-021-03704-2.
- Lynch JM, Barbano DM. 1999. Kjeldahl nitrogen analysis as a reference method for protein determination in dairy products. J AOAC Int. 82(6):1389–1398.
- Maheswari M, Murthy ANG, Shanker AK. 2017. Nitrogen nutrition in crops and its importance in crop quality. Indian Nitrogen Assessment. Chapter, 12:175–186. doi:10.1016/B978-0-12-811836-8.00012-4.
- Mao QZ, Watanabe M, Imori M, Kim YS, Kita K, Koike T. 2012. Photosynthesis and nitrogen allocation in needles in the sun and shade crowns of hybrid larch saplings: effect of nitrogen application. Photosynthetica. 50(4):422–428.
- Mccarthy MC, Enquist BJ. 2007. Consistency between an allometric approach and optimal partitioning theory in global patterns of plant biomass allocation. Funct Ecol. 21:713–720.
- Mu X, Chen Q, Chen F, Yuan L, Mi G. 2016. Within-leaf nitrogen allocation in adaptation to low nitrogen supply in maize during grain-filling stage. Front Plant Sci. 7:699. doi:10.3389/fpls.2016.00699.
- Mu XH, Chen QW, Wu XY, Chen FJ, Yuan LX, Mi GH. 2018. Gibberellins synthesis is involved in the reduction of cell flux and elemental growth rate in maize leaf under low nitrogen supply. Environ Exp Bot. 150:198–208.
- Murchie EH, Lawson T. 2013. Chlorophyll fluorescence analysis: a guide to good practice and understanding some new applications. J Exp Bot. 64(13):3983–3998.
- National Pharmacopoeia Committee. 2020. Pharmacopoeia of the people's republic of China (Part 1). Beijing: The Medicine Science and Technology Press of China.
- Niinemets Ü. 2010. A review of light interception in plant stands from leaf to canopy in different plant functional types and in species with varying shade tolerance. Ecol Res. 25:693–714.
- Niinemets Ü, Tenhunen J. 1997. A model separating leaf structural and physiological effects on carbon gain along light gradients for the shade-tolerant species Acer saccharum. Plant Cell Environ. 20:845–866.
- Nolan WG, Smillie RM. 1977. Temperature-induced changes in hill activity of chloroplasts isolated from chilling-sensitive and chilling-resistant plants. Plant Physiol. 59(6):1141–1145.
- Onoda Y, Hikosaka K, Hirose T. 2004. Allocation of nitrogen to call walls decreases photosynthetic nitrogen-use efficiency. Funct Ecol. 18:419–425.
- Onoda Y, Wright IJ, Evans JR, Hikosaka K, Kitajima K, Niinemets Ü, Poorter H, Tosens T, Westoby M. 2017. Physiological and structural tradeoffs underlying the leaf economics spectrum. New Phytol. 214(4):1447–1463.
- Ou X, Cui X, Zhu D, Guo L, Liu D, Yang Y. 2020. Lowering nitrogen and increasing potassium application level can improve the yield and quality of Panax notoginseng. Front Plant Sci. 11:595095.
- Oukarroum A, Madidi SE, Schansker G, Strasser RJ. 2007. Probing the responses of barley cultivars (Hordeum vulgare L.) by chlorophyll a fluorescence OLKJIP under drought stress and re-watering. Environ Exp Bot. 60(3):438–446.
- Perchlik M, Tegeder M. 2018. Leaf amino acid supply affects photosynthetic and plant nitrogen use efficiency under nitrogen stress. Plant Physiol. 178(1):174–188.
- Pérez-Patricio M, Camas-Anzueto JL, Sanchez-Alegría A, Aguilar-González A, Gutiérrez-Miceli F, Escobar-Gómez E, Voisin Y, Rios-Rojas C, Grajales-Coutiño R. 2018. Optical method for estimating the chlorophyll contents in plant leaves. Sensors (Basel. 18(2):650. doi:10.3390/s18020650.
- Pompelli MF, Martins SC, Antunes WC, Chaves AR, Da Matta FM. 2010. Photosynthesis and photoprotection in coffee leaves is affected by nitrogen and light availabilities in winter conditions. J Plant Physiol. 167(13):1052–1060.
- Raven JA. 2011. The cost of photoinhibition. Physiol Plant. 142(1):87–104.
- Reich PB, Walters MB, Tabone TJ. 1989. Response of Ulmus americana seedlings to varying nitrogen and water status.2 Water and nitrogen use efficiency in photosynthesis. Tree Physiol. 5(2):173–184.
- Rotundo JL, Cipriotti PA. 2017. Biological limits on nitrogen use for plant photosynthesis: a quantitative revision comparing cultivated and wild species. New Phytol. 214(1):120–131.
- Rütting T, Aronsson H, Delin S. 2018. Efficient use of nitrogen in agriculture. Nutr Cycl Agroecosyst. 110:1–5.
- Saloner A, Bernstein N. 2020. Response of medical cannabis (Cannabis sativa L.) to nitrogen supply under long photoperiod. Front Plant Sci. 11:572293.
- Shao CH, Qiu CF, Qian YF, Liu GR. 2020. Nitrate deficiency decreased photosynthesis and oxidation-reduction processes, but increased cellular transport, lignin biosynthesis and flavonoid metabolism revealed by RNA-Seq in Oryza sativa leaves. PLoS One. 15(7):e0235975.
- Shuang SP, Zhang JY, Cun Z, Wu HM, Hong J, Chen JW. 2022. A comparison of photoprotective mechanism in different light-demanding plants under dynamic light conditions. Front Plant Sci. 13:819843.
- Stirbet A, Govindjee. 2012. Chlorophyll a fluorescence induction: a personal perspective of the thermal phase, the J-I-P rise. Photosynth Res. 113(1-3):15–61. doi:10.1007/s11120-012-9754-5.
- Strasser RJ, Srivastava A, Tsimilli-Michael M. 2000. The fluorescence transient as a tool to characterize and screen photosynthetic samples. In: M Yunus, U Pathre, P Mohanty, editor. Probing photosynthesis: mechanisms, regulation and adaptation. London: Taylor & Francis; p. 445–483.
- Strasser RJ, Tsimilli-Michael M, Srivastava A. 2004. Analysis of the chlorophylla fluorescence transient. In: G Papageorgious, Govindjee, editors. Advances in photosynthesis and respiration. Chlorophylla fluorescence: a signature of photosynthesis. Dordrecht: Springer; p. 321–362.
- Tang J, Sun B, Cheng R, Shi Z, Luo D, Liu S, Centritto M. 2019. Effects of soil nitrogen (N) deficiency on photosynthetic N-use efficiency in N-fixing and non-N-fixing tree seedlings in subtropical China. Sci Rep. 9(1):4604. doi:10.1038/s41598-019-41035-1.
- Tantray AY, Bashir SS, Ahmad A. 2020. Low nitrogen stress regulates chlorophyll fluorescence in coordination with photosynthesis and Rubisco efficiency of rice. Physiol Mol Biol Plants. 26(1):83–94.
- Tofanello VR, Andrade LM, Flores-Borges DNA, Kiyota E, Mayer JLS, Creste S, Machado EC, Yin X, Struik PC, Ribeiro RV. 2021. Role of bundle sheath conductance in sustaining photosynthesis competence in sugarcane plants under nitrogen deficiency. Photosynth Res. 149(3):275–287.
- Verhoeven AS, Demmig-Adams B, Adams IIIWW. 1997. Enhanced employment of the xanthophyll cycle and thermal energy dissipation in spinach exposed to high light and n stress. Plant Physiol. 113(3):817–824.
- Wang HR, Zhao XY, Zhang JM, Lu C, Feng FJ. 2022. Arbuscular mycorrhizal fungus regulates cadmium accumulation, migration, transport, and tolerance in Medicago sativa. J Hazard Mater. 435:129077.
- Wang Q, Liu C, Huang D, Dong Q, Li P, Ma F. 2019. High-efficient utilization and uptake of N contribute to higher NUE of ‘Qinguan’ apple under drought and N-deficient conditions compared with ‘Honeycrisp’. Tree Physiol. 39(11):1880–1895.
- Wang X, Wang L, Shangguan Z. 2016. Leaf gas exchange and fluorescence of two winter wheat varieties in response to drought stress and nitrogen supply. PLoS One. 11(11):e0165733.
- Wei S, Li X, Lu Z, Zhang H, Ye X, Zhou Y, Li J, Yan Y, Pei H, Duan F, et al. 2022. A transcriptional regulator that boosts grain yields and shortens the growth duration of rice. Science. 377:6604. eabi8455.
- Wen J, Zimmer EA. 1996. Phylogeny and biogeography of Panax L. (the ginseng genus. Araliaceae): inferences from ITS sequences of nuclear ribosomal DNA. Mol Phylogenet Evol. 6(2):167–177.
- Weraduwage SM, Chen J, Anozie FC, Morales A, Weise SE, Sharkey TD. 2015. The relationship between leaf area growth and biomass accumulation in Arabidopsis thaliana. Front Plant Sci. 6:167. doi:10.3389/fpls.2015.00167.
- Wu Y, Gong W, Wang Y, Yong T, Yang F, Liu W, Wu X, Du J, Shu K, Liu J, et al. 2018. Leaf area and photosynthesis of newly emerged trifoliolate leaves are regulated by mature leaves in soybean. J Plant Res. 131(4):671–680.
- Xiang J, Qian K, Zhang Y, Chew J, Liang J, Zhu J, Zhang Y, Fan X. 2021. OsLSD1.1 is involved in the photosystem II reaction and affects nitrogen allocation in rice. Plant Physiol Biochem. 166:246–257.
- Xiao Y, Yi F, Han DH, Lu M, Yang GJ, Zhao K, Wang JH, Ma WJ. 2019. Difference analysis of growth and nitrogen utilization and distribution in photosynthetic system of Catalpa bungee intraspecific and interspecific hybrid. Scientia Silvae Sinicae. 55:55–64.
- Yazaki W, Shimasaki T, Aoki Y, Masuda S, Shibata A, Suda W, Shirasu K, Yazaki K, Sugiyama A. 2021. Nitrogen deficiency-induced bacterial community shifts in soybean roots. Microbes Environ. 36:3. ME21004.
- Yuan L, Yuan Y, Du J, Sun J, Guo S. 2012. Effects of 24-epibrassinolide on nitrogen metabolism in cucumber seedlings under Ca(NO3)2 stress. Plant Physiol Biochem. 61:29–35.
- Zhang GW, Liu ZL, Zhou JG, Zhu YL. 2008. Effects of Ca(NO3)2 stress on oxidative damage, antioxidant enzymes activities and polyamine contents in roots of grafted and non-grafted tomato plants. Plant Growth Regul. 56:7. doi:10.1007/s10725-008-9281-8.
- Zhang JY, Cun Z, Chen JW. 2020a. Photosynthetic performance and photosynthesis-related gene expression coordinated in a shade-tolerant species Panax notoginseng under nitrogen regimes. BMC Plant Biol. 20(1):273. doi:10.1186/s12870-020-02434-z.
- Zhang JY, Cun Z, Wu HM, Chen JW. 2020b. Integrated analysis on biochemical profiling and transcriptome revealed nitrogen-driven difference in accumulation of saponins in a medicinal plant Panax notoginseng. Plant Physiol Biochem. 154:564–580.
- Zhang JY, Xu XZ, Kuang SB, Cun Z, Chen JW. 2021. Constitutive activation of genes involved in triterpene saponins enhances the accumulation of saponins in three-year-old Panax notoginseng growing under moderate light intensity. Ind Crops Prod. 171(36):113938.
- Zhang L, He M, Liu J, Li L. 2015. Role of the mitochondrial alternative oxidase pathway in hydrogen photoproduction in Chlorella protothecoides. Planta. 241(4):1005–1014.
- Zhang M, Sharma A, León F, Avery B, Kjelgren R, McCurdy CR, Pearson BJ. 2020c. Effects of nutrient fertility on growth and alkaloidal content in Mitragyna speciosa (Kratom). Front Plant Sci. 11:597696.
- Zhao LS, Li K, Wang QM, Song XY, Su HN, Xie BB, Zhang XY, Huang F, Chen XL, Zhou BC, Zhang YZ. 2017. Nitrogen starvation impacts the photosynthetic performance of Porphyridium cruentum as revealed by chlorophyll a fluorescence. Sci. Rep. 7(1):8542. doi:10.1038/s41598-017-08428-6.
- Zhong C, Jian SF, Huang J, Jin QY, Cao XC. 2019. Trade-off of within-leaf nitrogen allocation between photosynthetic nitrogen-use efficiency and water deficit stress acclimation in rice (Oryza sativa L. Plant Physiol Biochem. 135:41–50.
- Zhu Y, Fan XF, Hou XC, Wu JY, Wang T. 2014. Effect of different levels of nitrogen deficiency on switchgrass seedling growth. Crop J . 2(4):223–234. doi:10.1016/j.cj.2014.04.005.
- Zuluaga H, Oviedo A, Efrain S, Pena EJ. 2004. Light stress effect and by nitrogen deficiency in plants of Petiveria alliacea measured with two-chlorophyll-fluorescence technique. Proc. SPIE 5622, 5th Iberoamerican Meeting on Optics and 8th Latin American Meeting on Optics, Lasers, and Their Applications.