
ABSTRACT
Duckweeds are particularly well suited for studies needing high output because of their quick growth and reproduction. Due to their starches and flavonoids, the potential for using duckweed as a source of food, medicine or feed has been studied. Through LC-MS analysis, 195 differential metabolites, including organic acids, phenolics, and other categories, were screened in Spirodela polyrhiza L. exposed to 4 days of NaCl. S. polyrhiza contained higher amounts of oxidized glutathione, jasmonates, and phenolic compounds but lower amounts of citric acid and glutathione under salt stress. Additionally, after 4 days of salt stress, there was an increase in the relative expression levels of genes involved in the phenolic biosynthesis pathway. Based on metabolomics, this study provides insight into the mechanism of salt-tolerant by duckweeds, as well as useful information for plant breeders and molecular biologists developing duckweed cultivars with salt tolerance and high phenolic content.
Key policy highlights
A total of 195 differential metabolites were examined in S. polyrhiza under salt stress using LC‒MS analysis.
The effects of salt stress on S. polyrhiza metabolic pathways were reported.
Under salt stress, the expression of genes involved in the S. polyrhiza phenolic biosynthesis pathway was evaluated.
1. Introduction
Duckweeds are a member of the Lemnaceae family and are divided into 37 species among five genera: Spirodela, Landoltia, Lemna, Wolffiella, and Wolffia (Fu et al. Citation2019). Recent research has shown that duckweeds are a promising source of bioethanol and livestock feed because of their quick biomass accumulation and high starch content (Cui and Cheng Citation2015). In addition, duckweeds are used as human food in several Asian countries and have been used for pharmaceutical purposes in China (Xu et al. Citation2021). The presence of vital nutrients such as proteins, carbohydrates, and lipids in duckweed is well known (Xu et al. Citation2021). Additionally, duckweeds contain a range of advantageous secondary metabolites, including phenolic compounds such as vitexin, quercetin, orientin, and luteolin (Tsolmon et al. Citation2021).
Salt stress has well-known negative impacts on plants, and it commonly leads to cellular damage that prevents plants from growing and developing normally (van Zelm et al. Citation2020). With their decreased morphology, duckweeds are more vulnerable to salt stress because there are no physical barriers between their photosynthetic organs and their food sources (Fu et al. Citation2019). Many attempts have been made to describe how duckweeds respond to salt. The development of Spirodela polyrhiza L. was shown to be inhibited by a high NaCl concentration, which also increased lipid peroxidation, reduced the amount of photosynthetic pigments, raised malondialdehyde content, and increased peroxidase, superoxide dismutase, ascorbate peroxidase, catalase, and glutathione reductase activities (Cheng Citation2011). NaCl treatment also contributed to the accumulation of more starch and led to the disturbance of ion homeostasis (Fu et al. Citation2019). These results provide valuable insights into duckweed’s physiological response to salt stress. However, salt tolerance is a complex trait governed by genetic factors. Many researchers have concentrated on collecting salt-tolerance genes to understand the molecular mechanisms behind plant salt tolerance. It has been demonstrated that the expression of transcription factors that regulate abiotic stress and differentiation of cells is influenced by NaCl stress and the expression of numerous genes changes in S. polyrhiza after NaCl treatment. These data are crucial for understanding the molecular mechanisms of duckweed salt tolerance (Fu et al. Citation2019). However, metabolomic changes caused by salt stress in duckweeds have received scant attention.
In this study, S. polyrhiza was exposed to a 4-day treatment with 100 mM NaCl. A metabolic profiling method using a High-Performance Liquid Chromatography-Mass Spectrometry (LC‒MS) and multivariate statistical analyses, such as principal component analysis (PCA), orthogonal partial least squares-discriminant analysis (OPLS-DA), and hierarchical clustering analysis (HCA), was used to identify the pertinent metabolites, separate the groups, and screen differential metabolites. The primary and secondary metabolic pathways of metabolites in S. polyrhiza were also investigated to assess the effects of salt stress, with particular attention given to phenolic profiling. Subsequently, several genes involved in the biosynthesis of phenolic compounds were evaluated for gene expression. This research will promote the creation of high-quality, salt-tolerant duckweed as well as our understanding of how salt stress affects phenolic synthesis at the gene and metabolic levels.
2. Materials and methods
2.1 Plant materials and salt treatment
S. polyrhiza were cultivated aseptically on Datko medium with 16 h of light and 8 h of darkness and a light intensity of 45 ∼µmol m−2 s−1 at 25 ± 1°C (Zhu et al. Citation2021). Seven days before the experiments, three healthy colonies with three frond plants were further adapted to Datko medium, a process called precultivation. To examine how the metabolomic composition of duckweed was altered in response to salt stress, all plants from precultivation were inoculated in a 250 mL flask containing 100 mL Datko medium supplemented with 100 mM NaCl. The samples were collected after a 4 d exposure to NaCl. Immediately after collection, samples were transferred to liquid nitrogen and stored at −80°C for metabolomics analysis.
2.2 Sample preparation
An appropriate amount of sample (200 ± 0.5 mg) was weighed into a 2 mL centrifuge tube, 600 µL MeOH (stored at −20°C) (containing 2-amino-3-(2-chloro-phenyl)-propionic acid (4 ppm)) was added, and the mixture was vortexed for 30 s. Glass beads (100 mg) were added and the mixture was placed in a tissue grinder for 90 s at 60 Hz, followed by 15 min of room temperature ultrasound. Finally, the supernatant was centrifuged for 10 min at 12,000 rpm at 4°C before it was filtered through a 0.22-μm membrane and transferred to a detection container for LC‒MS (Vasilev et al. Citation2016).
2.3 LC-MS analysis of metabolomics
2.3.1 Liquid chromatography conditions
LC analysis was performed on an Ultimate 3000 UHPLC System (Thermo Fisher Scientific, USA). Chromatography was carried out with an ACQUITY UPLC ® HSS T3 column (150 × 2.1 mm, 1.8 µm) (Waters, Milford, MA, USA). The temperature in the column was kept constant at 40°C. Two microlitres of sample was injected at a flow rate of 0.25 mL/min. For the LC-ESI (+)-MS analysis, the mobile phases used were (C) 0.1% formic acid in acetonitrile (v/v) and (D) 0.1% formic acid in water (v/v). The gradient used for separation was as follows: 0–1 min at 2% C, 1–9 min at 2%−50% C, 9–12 min at 50%−98% C, 12–13.5 min at 98% C, 13.5–14 min at 98%−2% C, and 14–20 min at 2% C. The analytes were processed using (A) acetonitrile and (B) ammonium formate for LC-ESI (-)-MS analysis (5 mM). The gradient used for separation was as follows: 0–1 min, 2% A, 1–9 min, 2%−50% A, 9–12 min, 50%−98% A, 12–13.5 min, 98% A, 13.5–14 min, 98%−2% A, 14–17 min, 2% A (Zelena et al. Citation2009).
2.3.2 Mass spectrometry conditions
A Thermo Q Exactive mass spectrometer (Thermo Fisher Scientific, USA), electrospray ion source (ESI), and positive and negative ion modes were used to collect data separately. The positive ion spray voltage was 3.50 kV, the negative ion spray voltage was −2.50 kV, the sheath gas was 30 arb, and the auxiliary gas was 10 arb. The capillary temperature was 325°C, with the following conditions: MS1 range, m/z 81-1000; MS1 resolving power, 70000 FWHM; number of data-dependent scans per cycle, 10; and MS/MS resolving power, 17500 FWHM. At the same time, dynamic exclusion was used to eliminate needless MS and MS information (Want et al. Citation2013).
2.4 Data processing
The ProteoWizard software MSConvert first transformed the raw data into mzXML format before processing it with XCMS for feature detection, retention time correction, and alignment (Smith et al. Citation2006; Navarro-Reig et al. Citation2015). Accurate mass (< 30 ppm) and MS/MS data were linked with HMDB (Wishart et al. Citation2022), massbank (Edmands et al. Citation2017), LipidMaps (Sud et al. Citation2007), mzclound (Abdelrazig et al. Citation2020) and KEGG (Kanehisa and Goto Citation2000).
2.5 Statistical analysis
Data were analyzed using Ropls software for multivariate statistical analysis (PCA, OPLS-DA) (Thévenot et al. Citation2015). Every point on the score plot represents a sample and displays the metabolic profiles. An S-plot was created to reveal information about the metabolites that affect how the samples cluster. Using permutation testing techniques, all of the examined models were checked for overfitting. After that, data were collected on the fitness parameters of the model (goodness-of-fit, R2Y, goodness-of-prediction, Q2Y). When screening metabolites, variable importance in projection (VIP) can be used to determine the strength and explanatory capacity of each metabolite’s contribution to sample classification and discrimination. OPLS-DA enabled the identification of distinguishing metabolites utilizing the VIP. Fold change (FC) was used to calculate the multiplicity of differences between groups. To identify the classifiable variable, the P value, VIP from OPLS-DA, and FC were used. Finally, statistically significant metabolites were those with P values < 0.05 and VIP values > 1. Six replicates were collected from each of the control and experimental groups.
2.6 Pathway analysis
Using the KEGG website and MetaboAnalyst, biological pathway analysis was built based on the dramatically altered metabolites of the salinity-treated groups compared to the control group. Using the KEGG Mapper tool, the metabolites and associated pathways were made visible.
2.7 Gene expression analysis using qRT–PCR
2.7.1 Extraction of total RNA from S. polyrhiza
An Eastep Super Total RNA Extraction Kit (Promega, Shanghai) was used to extract total RNA from samples of the CK- and 100 mM NaCl-treated duckweed in accordance with the manufacturer’s instructions.
FastKing RT Kit with gDNase from TIANGEN Biotech in China was used to create first-strand cDNA. One cycle was performed at 42°C for 15 min, followed by a third cycle at 95°C for 3 min.
2.7.2 RT–PCR amplification system and conditions
The reaction system was set up in accordance with the Super Real PreMix Plus (SYBR Green) guidelines (TIANGEN Biotech, China). The following conditions were applied to each reaction: 40 cycles at 95°C for 10 s and 60°C for 30 s were performed after one cycle at 95°C for 15 min. As a standard reference control gene, the S. polyrhiza ACTIN was employed. Real-time quantitative PCR was performed three times on the samples, and the 2−ΔΔCt technique was used to determine the relative expression level. Real-time quantitative PCR was carried out using a Bio-Rad iQ5 Detection System (Bio-Rad, California, USA).
S. polyrhiza-related sequences were obtained from the transcriptomic results of our laboratory, and Primer Premier 5.0 software was used to design gene-specific primers (Table S1), which were synthesized by Sales Genomics CN (Tianjin, China).
2.7.3 Statistical analysis
Data were analyzed using ANOVA, and differences were considered significant at the p < 0.05 level.
3. Results
3.1 Metabolomic analysis of samples from control and salt stress treatments
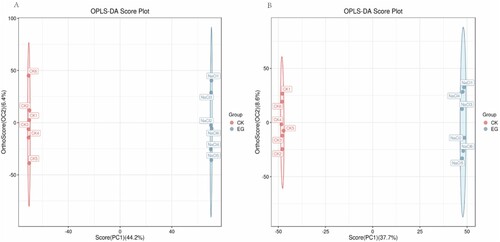
In this work, multivariate statistical analysis was employed after LC‒MS to examine metabolite changes in S. polyrhiza under salt stress. The variations in metabolite composition between the experimental samples and the control samples were analyzed using PCA based on the metabolic database generated from LC‒MS in the ESI + and ESI- modes. The PCA score plot depicts the degree of sample aggregation and dispersion (). The more similar the composition and concentration of the variables and molecules contained in these samples, the closer the sample distribution points. Conversely, greater differences between the sample points indicate dissimilarity. There was clear separation between salt stress samples and control samples in the PCA, indicating significant differences between the groups. The differential compositions of metabolites in the control and salt stress groups were further identified using the OPLS-DA model. In the OPLS-DA model, the values of R2X, R2Y, and Q2 were 0.506, 1, and 0.979 in positive ion mode, respectively, and the values of R2X, R2Y, and Q2 were 0.462, 1, and 0.966 in negative ion mode (). It can be seen from the OPLS-DA score scatter plot that control and stress are located on opposite sides of the first principal component, indicating significant differences between the samples.
Figure 1. Principal component analysis (PCA) score plot. The first principal component (PC1) accounted for 44.3% and 37.7% of all variation in positive ion mode (A) and negative ion mode (B), respectively. CK: control group, EG: experimental group. Red and blue represent CK and EG, respectively.
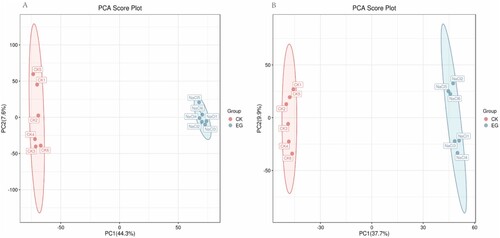
Figure 2. OPLS-DA score plot of S. polyrhiza under salt stress. The first principal component (PC1) accounted for 44.2% and 37.7% of all variation in the positive ion mode (A) and negative ion mode (B), respectively. CK: control group, EG: experimental group. Red and blue represent CK and EG, respectively.
3.2 Metabolic changes in S. polyrhiza under salt stress
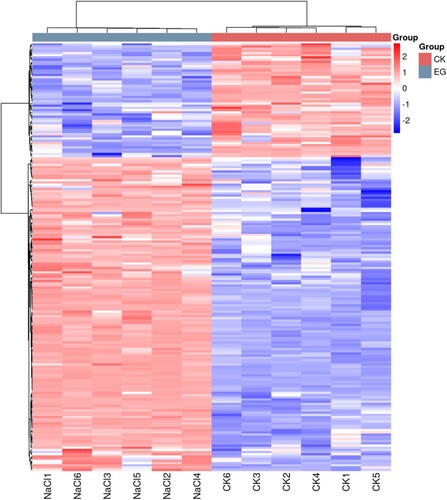
Through LC-MS analysis and identification of primary and secondary metabolites, approximately 524 metabolites were identified in S. polyrhiza. A complete list of detected metabolites is provided in the supplementary material, including detailed metabolite information (Table S2). Screening of differential metabolites with a P value < 0.05 and VIP > 1 was done with statistical tests. A total of 195 metabolites were screened and classified into diverse chemical classes, including carboxylic acids, flavonoids, fatty acids, amino acids, sugars, organic acids, and other compounds. Compared with the control, S. polyrhiza had 143 upregulated metabolites and 52 downregulated metabolites after salt treatment (Table S3). Metabolites were visualized using a volcano plot (), and differentiation was observed with a heat map (). The mapping of these metabolites against the 72 pathways listed in KEGG revealed that the majority of metabolites were involved in linoleic acid metabolism (8 compounds); phenylalanine, tyrosine, and tryptophan biosynthesis (6 compounds); phenylpropanoid biosynthesis (9 compounds); glutathione metabolism (5 compounds); ABC transporters (11 compounds); purine metabolism (8 compounds); flavone and flavonol biosynthesis (5 compounds); and flavonoid biosynthesis (6 compounds) (Table S4).
Figure 3. Volcano plot of differential metabolites. Red dots indicate metabolites that are upregulated, blue dots indicate metabolites that are downregulated, and gray dots indicate metabolites that did not pass the filter’s screening requirements.
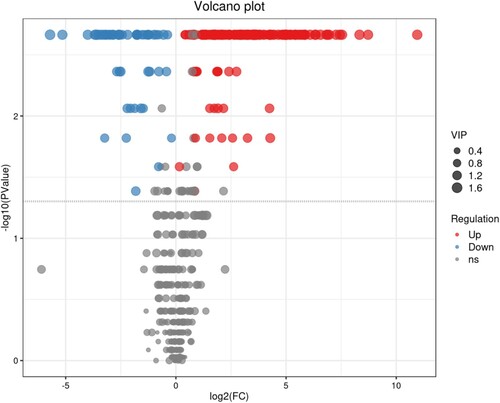
Figure 4. Hierarchical clustering heatmap of differential metabolites. The relative content of metabolites from low to high is graphically depicted by the change in blue and red hues. Each sample variety is visualized in a single column, and each metabolite is represented by a single row. CK and NaCl represent samples from the control and salt treatments with six replicates, respectively.
3.3 Metabolic pathway enrichment analysis for differential metabolites
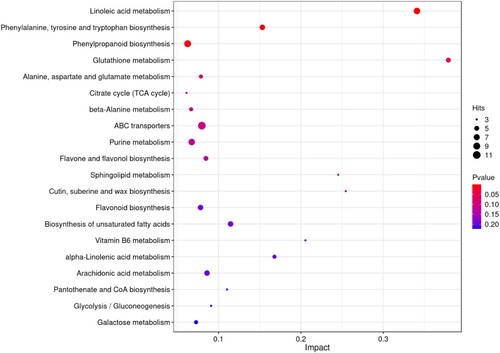
KEGG pathway analysis was used to examine significant salinity-related changes in various biological pathways. The identification of the metabolic pathways that are important under salinity was achieved by mapping significantly changed metabolites. depicts the first 20 significantly altered pathways identified by pathway analysis. Linoleic acid metabolism; phenylalanine, tyrosine, and tryptophan biosynthesis; phenylpropanoid biosynthesis; glutathione metabolism; alanine, aspartate, and glutamate metabolism; and the citrate cycle (TCA cycle) were profoundly impacted by salinity. Detailed results of the pathway enrichment analysis are given in Table S4.
Figure 5. A bubble plot of metabolic pathway impact factors showed significantly altered metabolic pathways in S. polyrhiza under salt stress. A metabolic pathway is represented by each point; the abscissa is the impact value in the different metabolic pathways; the ordinate is the enriched pathway. The number of metabolites in the pathway is shown by the appropriate number of dots. The correlation between color and P value indicates that bluer colors have larger P values and redder colors have smaller P values.
3.4 Differences in the expression of S. polyrhiza phenolic biosynthetic genes between the control and salt stress treatments
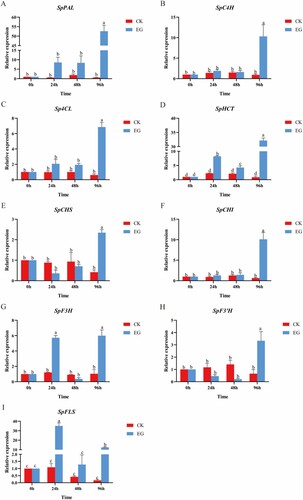
The effects of salt on phenolic biosynthetic pathways were investigated by analyzing the gene expression of phenylalanine ammonia-lyase (PAL), cinnamate 4-hydroxylase (C4H), 4-hydroxycinnamoyl-CoA ligase (4CL), chalcone isomerase (CHI), chalcone synthase (CHS), hydroxycinnamoyl transferase (HCT), flavanone 3-hydroxylase (F3H), flavanone-3’-hydroxylase (F3’H), and flavonol synthase (FLS), whose enzymes are involved in phenolic biosynthesis. Analysis of gene expression patterns was done using qRT‒PCR. According to qRT‒PCR results, the gene expression of SpPAL, SpC4H, Sp4CL, SpHCT, SpCHI, and SpFLS increased in comparison to the control. Among these, PAL, C4H, and 4CL are crucial enzymes in the biosynthesis of phenylpropanoid, and HCT is vital to the production of chlorogenic acid. CHI and FLS are critical enzymes in the flavonoid production pathway. Additionally, the flavonoid biosynthesis pathway involved SpCHS, SpF3’H, and SpF3H, whose gene expression levels under salt stress displayed divergent trends. The gene expression of SpCHS and SpF3’H was decreased at 24 and 48 h compared to the control, while it was significantly upregulated at 96 h. The gene expression of SpF3H was upregulated at 24 and 96 h compared to the control, while it decreased at 48 h. The results of gene expression analysis are shown in .
Figure 6. Expression levels of genes involved in phenolic biosynthesis (SpPAL(A), SpC4H(B), Sp4CL(C), SpHCT(D), SpCHS(E), SpCHI(F), SpF3H(G), SpF3’H(H), and SpFLS(I)) from control and salt-treated S. polyrhiza at 0,24,48 and 96 h. Data are the mean ± SE of 3 replicates. At each time piont, p < 0.05 indicated a significant difference between groups. The S. polyrhiza ACTIN gene was used as a reference gene. Red and blue represent CK and EG, respectively.
4. Discussion
It has been demonstrated that elevated TCA cycle activity can improve salt tolerance in plants by increasing the levels of intermediate products and energy capacity (Guo et al. Citation2022). In this study, the concentration of oxaloacetic acid increased 3.37-fold and the concentration of citric acid decreased 3.3-fold in S. polyrhiza after salt stress. This may have occured if there was not enough acetyl coenzyme A to react with oxaloacetic acid to produce citric acid. The concentration of cis-aconitic acid increased 7.82-fold. We hypothesize that a decrease in citric acid may cause an increase in cis-aconitic acid quickly under salt stress in S. polyrhiza. It has been reported that the citric acid content in some plants increases under salt stress (Panda et al. Citation2021), while the citric acid content in other plants decreases (Chen et al. Citation2019). We speculate that a decrease in citric acid in S. polyrhiza may be related to the salt shock effect. Such responses not only efficiently relieve salt-induced hyperammonia but also generate compatible osmolytes to maintain osmotic balance, such as sucrose, glucose and fructose, which are used as carbon stores and ROS scavengers (Zhang et al. Citation2011).
Glutathione (GSH) can scavenge ROS directly or indirectly by regulating cellular homeostasis through the ascorbate-glutathione cycle (Zhou et al. Citation2017). Intracellular GSH accumulation may enhance plant salt tolerance (Li et al. Citation2011; Foyer and Noctor Citation2011). However, under salt stress, the GSH content decreased 10-fold, and the oxidized glutathione (GSSG) content increased 6.23-fold in S. polyrhiza. This result was consistent with a study showing that long-term salinity (10 d) induced decreases in GSH and increases in GSSG in Pancratium maritimum (Carfagna et al. Citation2021). It is possible that GSH was utilized to scavenge H2O2, reducing lipids and organic hydroperoxides to protect cells from stress-induced oxidative damage (Hasanuzzaman et al. Citation2020).
Many studies have shown that the relative concentrations of jasmonates are affected during stress. Ricinus communis was exposed to salt stress, and jasmonic acid (JA) decreased in the cotyledons but remained unchanged in the roots (Wang et al. Citation2021). However, JA increased significantly in Dendrobium officinale under salt stress (Zhang et al. Citation2021). In this study, jasmonic acid and methyl jasmonate (MeJA) in S. polyrhiza increased 18.9- and 6.29-fold, respectively, under salt stress. Linolenic acid decreased 2.27-fold and was oxidized to JA with high ROS levels under salt stress (Ho et al. Citation2020). Studies have demonstrated that jasmonates, as signaling molecules, can activate transcription factors such as MYC, MYB and ERF (Ho et al. Citation2020; Delgado et al. Citation2021). These transcription factors control the expression of stress-response genes, enhance the antioxidant system, and encourage ion balance to improve stress tolerance in plants (Zhao et al. Citation2020). To date, jasmonates are effective elicitors used in various medicinal plant cultures. Studies have demonstrated that exogenous application of jasmonates increases flavonoids, alkaloids, terpenes, and other bioactive chemicals in plants (Pauwels et al. Citation2008; Wang et al. Citation2016; Yuan et al. Citation2017). It has been reported that jasmonates influence the expression of genes involved in secondary metabolic biosynthesis, which has an impact on the accumulation of secondary metabolites (Pauwels et al. Citation2008). We hypothesize that the accumulation of flavonoids is connected to the accumulation of jasmonates under salt stress in S. polyrhiza.
Previous studies have demonstrated that plants preferentially accumulate flavonoids when they are exposed to extremely stressful conditions, such as salt stress (Xu et al. Citation2020). Hence, applying salt to plants is a useful way to improve the quality of a medicinal plant by increasing the accumulation of flavonoids. When Andrographis paniculata was exposed to salt stress, anticancer phytochemicals, such as andrographolide, greatly increased (Talei et al. Citation2013). The medicinal components of S. polyrhiza changed significantly after salt stress. Among them, chlorogenic acid and vitexin had the highest fold changes, increasing by 44- and 36-fold, respectively. Quercetin, orientin and kaempferol increased by 19-, 12- and 11-fold, respectively. Previous transcriptome analyses have shown that the expression of genes involved in the secondary metabolism of flavonoids increases dramatically within 12–24 h of salt treatment (Fu et al. Citation2019). However, the specific expression profiles for these genes in S. polyrhiza have not been reported. Phenolic compounds are derived from the phenylpropanoid pathway (). Through the actions of PAL, C4H, and 4CL, phenylalanine is transformed into p-coumaroyl-CoA (Jiang et al. Citation2016). In this study, the qRT‒PCR results demonstrated that salt treatment greatly increased the expression levels of SpPAL, SpC4H, and Sp4CL. However, metabolomics revealed a decline in the relative coumaric acid content, no change in the relative phenylpropane and cinnamic acid contents, and coumaryl CoA was not detected. It has been hypothesized that it is possible to quickly and efficiently synthesize downstream products. All of the downstream metabolites share the main phenylpropanoid pathway. HCT catalyzes the conversion of coumaroyl-CoA into 4-coumaroyl-quinic acid, which is then catalyzed to produce chlorogenic acid (Clifford et al. Citation2017). In this study, the relative level of SpHCT expression increased, which was compatible with an increase in the relative level of chlorogenic acid after stress (). In recent years, chlorogenic acid has attracted increasing attention. Although it is crucial for human health, a low concentration and challenges in extraction and separation make it difficult to obtain chlorogenic acid in significant quantities. Chlorogenic acid chemical synthesis has previously been documented, but production and widespread application are severely constrained by numerous steps to synthesis, a protracted process route, challenging selectivity control, and low total yield (Smarrito et al. Citation2008). The findings of this study suggest that NaCl can activate plant defense mechanisms that increase the content of phenolic compounds such as chlorogenic acid with high efficiency, low cost, and high maneuverability.
Figure 7. Schematic diagram showing how phenolic biosynthesis is affected by salt. The red boxes represents the metabolites with increased relative content, the green boxes represents the metabolites with decreased relative content, and the gray boxes represents the metabolites with unchanged relative content. Boxes without a colored background indicate compounds that were not detected. Red font indicates the genes with increased relative expression.
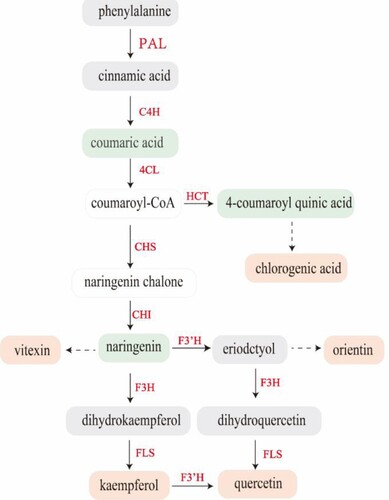
Table 1. List of the phenolic compounds in salt-treated S. polyrhiza, chosen by combining fold-change analyses.
Additionally, CHS catalyzes the conversion of coumaryl CoA into naringenin chalcone, which is subsequently utilized by CHI to create naringenin (Tao et al. Citation2017). Naringenin represents the main branch point in the flavonoid production pathway and is a common substrate for downstream flavinoids (Liu et al. Citation2021). The relative expression of SpCHS was downregulated at 24 and 48 h, but not significantly, and was significantly upregulated at 96 h of treatment. While naringenin chalcone was not found in the metabolomics results, synthesized naringenin chalcone may soon be employed to manufacture naringenin via CHI. The relative expression of SpCHI was upregulated during this process, but the naringenin content fell. However, the majority of the flavonoid compounds that were transformed from naringenin were dramatically elevated. For instance, the relative content of vitexin increased significantly after treatment (). Next, naringenin was converted to eriodctyol under the action of F3’H and then further converted to orientin (Jiang et al. Citation2016; Liu et al. Citation2021). After salt treatment for 24 and 48 h, the relative gene expression of SpF3'H was reduced, but not significantly, and then increased after 96 h. The relative content of eriodctyol remained constant, but the amount of orientin increased (). It is possible that eriodctyol was used to synthesize orientin. In the presence of F3’H, naringenin and eriodctyol were transformed into dihydrokaempferol (DHK), followed by kaempferol catalyzed by FLS, and ultimately quercetin catalyzed by F3'H (Jiang et al. Citation2016). The relative gene expression levels of SpFLS and SpF3H were considerably increased after salt treatment. The results were consistent with the increase in the relative contents of kaempferol and quercetin after salt stress. Salt stress for 96 h dramatically stimulated genes involved in the production of phenolic compounds and enhanced the quantity of medicinal components.
5. Conclusions
We showed that combining multivariate statistical analysis with LC-MS based metabolomics was a useful method for identifying S. polyrhiza under salt stress. Our findings demonstrated that inoculation with salt significantly enhanced organic acids and phenolics in S. polyrhiza, which improve osmotic adjustment and maintain cell membrane stability under stress. In this study, the TCA cycle and glutathione metabolism differed from those in earlier research, offering novel understanding of the metabolic pathways of salt stress in S. polyrhiza. Salt stress greatly affected phenolic compound biosynthesis and encouraged the buildup of phenolic compounds; the expression of genes involved in phenolic compound biosynthesis also changed. Our results suggest that a low-salt environment may be more effective for the cultivation of duckweed with high phenolic compounds. Duckweed is also a crucial model plant in synthetic biology research and a superior plant bioreactor (Yang et al. Citation2021). We discovered that after salt stress, several plant secondary metabolic pathways accumulated more intermediates. The accumulation of these metabolites provides a foundation for the use of synthetic biology technologies to produce more advantageous medicinal components. This will encourage the sustainable exploitation of resources from medicinal plants.
Author contributions
B.X. designed the experiment and reviewed the manuscript. T.H. organized the experimental process and wrote the paper. Y.Z., R.J., Y.H., W.W. and Y.W. participated in the experiments. Y.W, Y.Z. and L.Y. reviewed this manuscript. All authors have read and approved the final manuscript.
Acknowledgements
We are grateful to Suzhou PANOMIX Biomedical Tech Co., Ltd for assisting in the detection of metabolites.
Disclosure statement
No potential conflict of interest was reported by the authors.
Additional information
Funding
Notes on contributors

Tanyue Hui
Tanyue Hui is currently working toward the M.S. degree in pharmacognosy with Tianjin University of Traditional Chinese Medicine, Tianjin, China. Her research interests include the production of bioactive compounds in duckweed by the synthetic biological technology, and plant abiotic stresses physiology and metabolomic.
Yamei Zhang
Yamei Zhang is currently working toward the M.S. degree in pharmaceutical analysis at the Tianjin University of Traditional Chinese Medicine, Tianjin, China. Her research interests include the production of bioactive compounds in duckweed by synthetic biological technology and plant abiotic stresses on physiology and metabolism.

Rong Jia
Rong Jia is currently working toward the M.S. degree in traditional Chinese pharmacology at the Tianjin University of Traditional Chinese Medicine, Tianjin, China. Her research interests include the production of bioactive compounds in duckweed by synthetic biological technology and plant abiotic stresses on physiology and metabolism.

Yue Hu
Yue Hu received her M.S. degree from Tianjin University of Traditional Chinese Medicine, Tianjin, China. Her research interests include the production of bioactive compounds in duckweed by synthetic biological technology and the effects of plant abiotic stresses on physiology and metabolism.
Wenjing Wang
Wenjing Wang is currently working toward the M.S. degree in pharmacognosy with Tianjin University of Traditional Chinese Medicine,Tianjin,China. Her research interests include the production of bioactive compounds in duckweed and Swertia mussotii by the synthetic biological technology, and plant abiotic stresses physiology and metabolomic.
Yi Wang
Yong Wang is a professor at the College of Life Science, Nankai University. His research interests include photosynthesis, stress resistance, and secondary metabolism of plants; bioenergy; bioreactors; rice breeding; herbicide physiology, etc.
Yong Wang
Yi Wang is currently working toward the M.S. degree in pharmacognosy with Tianjin University of Traditional Chinese Medicine, Tianjin, China. Her research interests include the response of transgenic duckweed to abiotic stress and the production of bioactive compounds in duckweed by the synthetic biological technology.
Yerong Zhu
Yerong Zhu is an Associated Professor at the Department of Plant and Ecology Science, College of Life Science, Nankai University. She has a background in the study on improving the accumulation of Secondary metabolites in medical plant through genetic engineering.

Lin Yang
Lin Yang Associate Professor, College of Life Sciences, Tianjin Normal University, her research interests include: (1) Mechanism of glutamic acid and γ -aminobutyric acid in rapid Response to Cadmium stress in duckweed; (2) Mechanism of enhancing cadmium Stress resistance in plants
Beibei Xiang
Beibei Xiang is an associate professor at the School of Chinese Materia Medica, Tianjin University of Traditional Chinese Medicine. Her research interests include: (1) The use of synthetic biology on the growth and production of bioactive compounds in medicinal plants; (2) Mechanisms of enhancing abiotic stress resistance in plants.
References
- Abdelrazig S, Safo L, Rance GA, Fay MW, Theodosiou E, Topham PD, Kim DH, Fernández-Castané A. 2020. Metabolic characterisation of Magnetospirillum gryphiswaldense MSR-1 using LC-MS-based metabolite profiling. RSC Adv. 10:32548–32560. doi:10.1039/d0ra05326k.
- Carfagna S, Salbitani G, Innangi M, Menale B, De Castro O, Di Martino C, Crawford TW Jr. 2021. Simultaneous biochemical and physiological responses of the roots and leaves of pancratium maritimum (Amaryllidaceae) to mild salt stress. Plants (Basel). 10:345. doi:10.3390/plants10020345.
- Chen C, Liu H, Wang C, Liu Z, Liu X, Zou L, Zhao H, Yan Y, Shi J, Chen S. 2019. Metabolomics characterizes metabolic changes of Apocyni Veneti Folium in response to salt stress. Plant Physiol Biochem. 144:187–196. doi:10.1016/j.plaphy.2019.09.043.
- Cheng T-S. 2011. NaCl-induced responses in giant duckweed (Spirodela polyrhiza). J. Aquat Plant Manage. 49:62–71.
- Clifford MN, Jaganath IB, Ludwig IA, Crozier A. 2017. Chlorogenic acids and the acyl-quinic acids: discovery, biosynthesis, bioavailability and bioactivity. Nat Prod Rep. 34:1391–1421. doi:10.1039/c7np00030h.
- Cui W, Cheng JJ. 2015. Growing duckweed for biofuel production: a review. Plant Biol (Stuttg). 17(1):16–23. doi:10.1111/plb.12216.
- Delgado C, Mora-Poblete F, Ahmar S, Chen JT, Figueroa CR. 2021. Jasmonates and plant salt stress: molecular players, physiological effects, and improving tolerance by using genome-associated tools. Int J Mol Sci. 22:3082. doi:10.3390/ijms22063082.
- Edmands WM, Petrick L, Barupal DK, Scalbert A, Wilson MJ, Wickliffe JK, Rappaport SM. 2017. Compms2miner: an automatable metabolite identification, visualization, and data-sharing R package for high-resolution LC-MS data sets. Anal Chem. 89:3919–3928. doi:10.1021/acs.analchem.6b02394.
- Foyer CH, Noctor G. 2011. Ascorbate and glutathione: the heart of the redox Hub. Plant Physiol. 155:2–18. doi:10.1104/pp.110.167569.
- Fu L, Ding Z, Sun X, Zhang J. 2019. Physiological and transcriptomic analysis reveals distorted Ion homeostasis and responses in the freshwater plant spirodela polyrhiza L. under salt stress. Genes (Basel). 10:743. doi:10.3390/genes10100743.
- Guo Q, Han J, Li C, Hou X, Zhao C, Wang Q, Wu J, Mur LAJ. 2022. Defining key metabolic roles in osmotic adjustment and ROS homeostasis in the recretohalophyte Karelinia caspia under salt stress. Physiol Plant. 174:e13663. doi:10.1111/ppl.13663.
- Hasanuzzaman M, Bhuyan M, Zulfiqar F, Raza A, Mohsin SM, Mahmud JA, Fujita M, Fotopoulos V. 2020. Reactive Oxygen Species and Antioxidant Defense in Plants under Abiotic Stress: revisiting the Crucial Role of a Universal Defense Regulator. Antioxidants (Basel). 9:681. doi:10.3390/antiox9080681.
- Ho TT, Murthy HN, Park SY. 2020. Methyl jasmonate induced oxidative stress and accumulation of secondary metabolites in plant cell and organ cultures. Int J Mol Sci. 21:716. doi:10.3390/ijms21030716.
- Jiang N, Doseff AI, Grotewold E. 2016. Flavones: from biosynthesis to health benefits. Plants (Basel). 5:27. doi:10.3390/plants5020027.
- Kanehisa M, Goto S. 2000. KEGG: kyoto encyclopedia of genes and genomes. Nucleic Acids Res. 28:27–30. doi:10.1093/nar/28.1.27.
- Li J-T, Qiu Z-B, Zhang X-W, Wang L-S. 2011. Exogenous hydrogen peroxide can enhance tolerance of wheat seedlings to salt stress. Acta Physiol Plant. 33:835–842. doi:10.1007/s11738-010-0608-5.
- Liu W, Feng Y, Yu S, Fan Z, Li X, Li J, Yin H. 2021. The flavonoid biosynthesis network in plants. Int J Mol Sci. 22:12824. doi:10.3390/ijms222312824.
- Navarro-Reig M, Jaumot J, García-Reiriz A, Tauler R. 2015. Evaluation of changes induced in rice metabolome by Cd and Cu exposure using LC-MS with XCMS and MCR-ALS data analysis strategies. Anal Bioanal Chem. 407:8835–8847. doi:10.1007/s00216-015-9042-2.
- Panda A, Rangani J, Parida AK. 2021. Unraveling salt responsive metabolites and metabolic pathways using non-targeted metabolomics approach and elucidation of salt tolerance mechanisms in the xero-halophyte Haloxylon salicornicum. Plant Physiol Biochem. 158:284–296. doi:10.1016/j.plaphy.2020.11.012.
- Pauwels L, Morreel K, De Witte E, Lammertyn F, Van Montagu M, Boerjan W, Inzé D, Goossens A. 2008. Mapping methyl jasmonate-mediated transcriptional reprogramming of metabolism and cell cycle progression in cultured Arabidopsis cells. Proc Natl Acad Sci U S A. 105:1380–1385. doi:10.1073/pnas.0711203105.
- Smarrito CM, Munari C, Robert F, Barron D. 2008. A novel efficient and versatile route to the synthesis of 5-O-feruloylquinic acids. Org Biomol Chem. 6:986–987. doi:10.1039/b719132d.
- Smith CA, Want EJ, O'Maille G, Abagyan R, Siuzdak G. 2006. XCMS: processing mass spectrometry data for metabolite profiling using nonlinear peak alignment, matching, and identification. Anal Chem. 78:779–787. doi:10.1021/ac051437y.
- Sud M, Fahy E, Cotter D, Brown A, Dennis EA, Glass CK, Merrill AH, Murphy RC Jr., Raetz CR, Russell DW, et al. 2007. LMSD: LIPID MAPS structure database. Nucleic Acids Res. 35:D527–D532. doi:10.1093/nar/gkl838.
- Talei D, Valdiani A, Maziah M, Sagineedu SR, Saad MS. 2013. Analysis of the anticancer phytochemicals in Andrographis paniculata Nees. under salinity stress. Biomed Res Int. 2013:319047. doi:10.1155/2013/319047.
- Tao X, Fang Y, Huang MJ, Xiao Y, Liu Y, Ma XR, Zhao H. 2017. High flavonoid accompanied with high starch accumulation triggered by nutrient starvation in bioenergy crop duckweed (Landoltia punctata). BMC Genomics. 18:166. doi:10.1186/s12864-017-3559-z.
- Thévenot EA, Roux A, Xu Y, Ezan E, Junot C. 2015. Analysis of the human adult urinary metabolome variations with Age, body mass index, and gender by implementing a comprehensive workflow for univariate and OPLS statistical analyses. J Proteome Res. 14:3322–3335. doi:10.1021/acs.jproteome.5b00354.
- Tsolmon B, Fang Y, Yang T, Guo L, He K, Li GY, Zhao H. 2021. Structural identification and UPLC-ESI-QTOF-MS(2) analysis of flavonoids in the aquatic plant Landoltia punctata and their in vitro and in vivo antioxidant activities. Food Chem. 343:128392. doi:10.1016/j.foodchem.2020.128392.
- van Zelm E, Zhang Y, Testerink C. 2020. Salt tolerance mechanisms of plants. Annu Rev Plant Biol. 71:403–433. doi:10.1146/annurev-arplant-050718-100005.
- Vasilev N, Boccard J, Lang G, Grömping U, Fischer R, Goepfert S, Rudaz S, Schillberg S. 2016. Structured plant metabolomics for the simultaneous exploration of multiple factors. Sci Rep. 6:37390. doi:10.1038/srep37390.
- Wang H-Q, Jin M-Y, Paek K-Y, Piao X-C, Lian M-L. 2016. An efficient strategy for enhancement of bioactive compounds by protocorm-like body culture of Dendrobium candidum. Ind Crops Prod. 84:121–130. doi:https://doi.org/10.1016/j.indcrop.2016.02.001.
- Wang Y, Liu J, Yang F, Zhou W, Mao S, Lin J, Yan X. 2021. Untargeted LC-MS-based metabolomics revealed specific metabolic changes in cotyledons and roots of Ricinus communis during early seedling establishment under salt stress. Plant Physiol Biochem. 163:108–118. doi:10.1016/j.plaphy.2021.03.019.
- Want EJ, Masson P, Michopoulos F, Wilson ID, Theodoridis G, Plumb RS, Shockcor J, Loftus N, Holmes E, Nicholson JK. 2013. Global metabolic profiling of animal and human tissues via UPLC-MS. Nat Protoc. 8:17–32. doi:10.1038/nprot.2012.135.
- Wishart DS, Guo A, Oler E, Wang F, Anjum A, Peters H, Dizon R, Sayeeda Z, Tian S, Lee BL, et al. 2022. Hmdb 5.0: the human metabolome database for 2022. Nucleic Acids Res. 50:D622–d631. doi:10.1093/nar/gkab1062.
- Xu J, Shen Y, Zheng Y, Smith G, Sun XS, Wang D, Zhao Y, Zhang W, Li Y. 2021. Duckweed (Lemnaceae) for potentially nutritious human food: a review. Food Rev Int. 1–15. doi:10.1080/87559129.2021.2012800.
- Xu Z, Zhou J, Ren T, Du H, Liu H, Li Y, Zhang C. 2020. Salt stress decreases seedling growth and development but increases quercetin and kaempferol content in Apocynum venetum. Plant Biol (Stuttg). 22:813–821. doi:10.1111/plb.13128.
- Yang GL, Feng D, Liu YT, Lv SM, Zheng MM, Tan AJ. 2021. Research progress of a potential bioreactor: duckweed. Biomolecules. 11:93. doi:10.3390/biom11010093.
- Yuan ZQ, Zhang JY, Liu T. 2017. Enhancement of polysaccharides accumulation in Dendrobium officinale by exogenously applied methyl jasmonate. Biologia plantarum. 61:438–444. doi:10.1007/s10535-016-0702-7.
- Zelena E, Dunn WB, Broadhurst D, Francis-McIntyre S, Carroll KM, Begley P, O'Hagan S, Knowles JD, Halsall A, Wilson ID, et al. 2009. Development of a robust and repeatable UPLC-MS method for the long-term metabolomic study of human serum. Anal Chem. 81:1357–1364. doi:10.1021/ac8019366.
- Zhang J, Zhang Y, Du Y, Chen S, Tang H. 2011. Dynamic metabonomic responses of tobacco (Nicotiana tabacum) plants to salt stress. J Proteome Res. 10:1904–1914. doi:10.1021/pr101140n.
- Zhang M, Yu Z, Zeng D, Si C, Zhao C, Wang H, Li C, He C, Duan J. 2021. Transcriptome and Metabolome Reveal Salt-Stress Responses of Leaf Tissues from Dendrobium officinale. Biomolecules. 11:736. doi:10.3390/biom11050736.
- Zhao G, Song Y, Wang Q, Yao D, Li D, Qin W, Ge X, Yang Z, Xu W, Su Z, et al. 2020. Gossypium hirsutum Salt Tolerance Is Enhanced by Overexpression of G. arboreum JAZ1. Front Bioeng Biotechnol. 8:157. doi:10.3389/fbioe.2020.00157.
- Zhou Y, Wen Z, Zhang J, Chen X, Cui J, Xu W, Liu H-y. 2017. Exogenous glutathione alleviates salt-induced oxidative stress in tomato seedlings by regulating glutathione metabolism, redox status, and the antioxidant system. Sci Hortic. 220:90–101. doi:https://doi.org/10.1016/j.scienta.2017.02.021.
- Zhu Y, Li X, Gao X, Sun J, Ji X, Feng G, Shen G, Xiang B, Wang Y. 2021. Molecular mechanism underlying the effect of maleic hydrazide treatment on starch accumulation in S. polyrrhiza 7498 fronds. Biotechnol Biofuels. 14:99. doi:10.1186/s13068-021-01932-y.