
ABSTRACT
Salinity significantly reduces global rice yield, especially in Eastern and Southern Africa, necessitating the development of salinity-tolerant varieties. We collected and analyzed 201 rice varieties, including Tanzanian landraces. Using 1k-RiCA SNP markers, we found that 36 out of 201 genotypes possessed the Saltol allele, a marker for salinity tolerance. Only two genotypes, K5 and Intsindagira bigega, were both phenotypically tolerant and had the Saltol allele. Interestingly, 16 genotypes without Saltol showed salinity tolerance, suggesting other salinity tolerance QTLs. The distribution of Saltol and phenotypically tolerant genotypes varied across Tanzanian agro-ecological zones, with the Coastal Zone showing a higher proportion of tolerant genotypes, possibly due to farmer selection pressure. However, ancestral population proportion correlated with decreased salinity tolerance. This study highlights the complex relationship between environmental factors and population structure in shaping the genetic and phenotypic composition of landraces. The identified tolerant genotypes could be utilized in breeding for new salinity-tolerant-rice varieties.
Introduction
Rice (Oryza sativa L.) is the staple food for half of the world’s population (Schneider and Asch Citation2020). It plays a pivotal role in improving household food security, livelihoods, and national economies in Sub-Saharan Africa (Nhamo et al., Citation2014). Despite the importance of rice, its production is under threat due to several abiotic and biotic stresses such as salinity, drought, extreme temperature, submergence, pests, and diseases, which are expected to worsen with the current trend of climate change. Out of many abiotic stresses, soil salinity is one of the major constraints toward global rice production (Vu et al. Citation2012). Over 20% of cultivated land worldwide has high levels of salt that can lead to crop plant salt stress and this problem is expanding at an alarming rate of 2 million hectares per year (Abbas et al. Citation2013). Moreover, Africa has the highest proportion of saline soils, accounting for almost 63% of the total saline soils on earth (Eswar et al. Citation2021). Rice yields can be reduced by up to 50% when grown under moderate (6 dS m-1) salinity levels (Adak et al. Citation2020). A substantial proportion of areas well-suited for rice cultivation are currently either abandoned due to salinization or experience significantly lower yields compared to the average productivity (Krishnamurthy et al. Citation2020). In essence, the occurrence of soil salinity can be attributed to both natural and human-induced factors, and managing saline soils involves implementing techniques such as selecting crops that can tolerate salt and reducing salt levels through flushing. While there are other agronomic interventions available, growing salt-tolerant varieties is the most cost-effective solution (Dar et al., Citation2021; Omar et al. Citation2022).
Breeding for salinity tolerance in rice has emerged as a promising solution for mitigating the adverse effects of salinity on rice cultivation (Wani et al. Citation2020). Krishnamurthy et al. (Citation2020) highlighted the need for high-yielding salt-tolerant rice varieties for commercial cultivation, which requires the introgression of salt-tolerant QTLs into high-yielding varieties. Molecular and genomic technologies have facilitated the identification and characterization of salinity tolerance genes and QTLs in rice, enabling the development of new breeding strategies (Gregorio et al. Citation2002). However, there are still some challenges and research gaps that need to be addressed, such as the identification of suitable donors, limited understanding of the genetic mechanisms underlying salinity tolerance, and the lack of efficient screening methods for large-scale breeding programs (Zeng et al. Citation2003). Nevertheless, the prospects for developing high-yielding and salt-tolerant rice varieties are promising and will significantly contribute to global food security.
Selecting salt-tolerant rice varieties that can thrive in saline soils is crucial, and breeders have several approaches to identify such rice genotypes. Phenotypic screening has been one of the useful tools for identifying tolerant genotypes, however, the screening process is time-consuming and can be easily interfered with environmental factors (Reddy et al., Citation2017). To overcome these limitations, recent advancements in biotechnology have provided breeders with tools such as marker-assisted selection that can improve the accuracy and efficiency of the screening process (Pray et al., Citation2011). Utilizing these advanced tools, breeders can quickly identify desirable traits and introgress them into high-yielding rice varieties, producing salt-tolerant rice varieties that are commercially viable and can thrive in saline soils (Pray et al., Citation2011; Reddy et al., Citation2017; Krishnamurthy et al. Citation2020).
Some genetic mapping studies in rice have located various quantitative trait loci (QTL) associated with salinity tolerance (Adak et al. Citation2020). QTLs or genes such as qSKC1, qSNC7, Saltol, OsRR22, qSIS2, qWCSST2, qST1, qSDW2.1, qSNC5, qNaL-1.2, qKR-1, qNa/KL_1.2, qGY-2, qRSL3, qRRL3, qSH1, qNa2.1, qSTY11.1, qCDP1.1, qSLn1.1, qRLs2.1, qRFWs6.1, qST-3.1, qST-5.1, qST-6.1, qST-6.2, qSTGY2.2, qSTGF2, qRSL7, qSL7, qSIS1, qSSI1, qSL1, qSIS1.39, qChlo4, qRL6.1, qRL12.1, qRL1.2, qGLWR2, qSSIGY2.1, qSF1.4, SH12.1, qSH12.2, and qDSW12.1 have been identified by genomic methods (Sun et al. Citation2019; Rasheed et al. Citation2022). Saltol is regarded as the major QTL governing salinity tolerance in rice, located on chromosome 1 (Linh et al. Citation2012). This QTL confers salinity tolerance at the vegetative stage that governs the Na+/K+ uptake ratio and explains 64.3–80.2% of the phenotypic variation in salt tolerance (Arzani et al. Citation2008). Multiple salt-tolerant rice varieties have been developed by incorporating the Saltol QTL into modern high-yielding rice varieties that are otherwise sensitive to salt, using marker-assisted backcrossing and selection (Waziri et al. Citation2016).
Most salinity-tolerance QTLs are found in landraces (such as Pokkali and Nona Bokra) which are geographically found in low-lying areas of South Asia with soil salinity (Manohara et al. Citation2021). These landraces have naturally adapted to salt stress over generations. However, most research on abiotic stress tolerance in plants overlooks the ecological and geographical factors of tolerant genotypes (Bin Rahman and Zhang Citation2018). For instance, Saltol, a gene responsible for salinity tolerance, was discovered in Pokkali, a landrace grown in coastal areas of Kerala, India (Chen et al. Citation2020). Therefore, to effectively identify donor plants for salt-tolerant QTLs, it is still essential to take into account for the geographical origin of the genotypes that are being studied.
Several rice genotypes in Asia have been identified to possess the ability to withstand high levels of salt in the soil, which makes them promising candidates for breeding new rice varieties that can tolerate salinity. However, many traditional African rice varieties have not been screened for their ability to tolerate salinity. This study hypothesized that selected African rice genotypes may harbor the Saltol allele responsible for salinity tolerance, which could be utilized for the development of salinity-tolerant rice varieties. This study screened landraces and improved genotypes that had not been previously screened for salinity tolerance at the seedling stage. The aim was to determine whether these genotypes possess the Saltol allele, a major QTL responsible for salinity tolerance at the seedling stage. Furthermore, this study examined the spatial distribution and population structure of the tested genotypes with respect to their salinity tolerance with the hypothesis that the occurrence of salt-tolerant and the Saltol-containing genotypes would be dependent on where the genotype had been collected.
Material and methods
Seed collection
To establish a panel of Tanzanian rice landraces and improved genotypes, seeds were collected from farmers’ fields in 2020 by Sokoine University of Agriculture (SUA). The authorization to perform the task of rice seed collection from farmers and several Agricultural Institutes in Tanzania was granted at different levels of authority as required by research guidelines of the country including the SUA Deputy Vice Chancellor’s office, the President's Office of Regional Administration, and Local Governments for the respective regions where seeds were collected. The researchers collected approximately 250 g of seed of each rice genotype. The coordinates of these genotypes were recorded using a Garmin Emap GPS device (datum: WGS84). The zones from which the georeferenced genotypes in Tanzania were collected include the Eastern plateaux and Mountain blocks (66 genotypes; Morogoro, Kilimanjaro-Same and Tanga regions), Central Zone (22 genotypes; Tabora, Shinyanga, and Mwanza regions), Southern Highlands (7 genotypes; Mbeya (Kyela and Mbeya rural) region), Northern rift zone and Volcanic highland (1 genotype; Kilimanjaro-Moshi rural), Rukwa-Ruaha rift zone (11 genotypes; Mbeya-Mbarali, Songwe, Rukwa-Sumbawanga rural and Singida regions), Ufipa plateau (1 genotype; Rukwa-Nkasi) and Coastal Zone (12 genotypes; Mtwara, Bagamoyo, and Zanzibar).
Seeds of 201 rice genotypes (O. sativa L.) were collected including the panel of Tanzanian rice landraces and improved genotypes from farmers’ fields across Tanzania as well as from several research institutes including the International Rice Research Institute (IRRI) stations in Tanzania, Burundi, Kenya, and the Tanzania Agricultural Research Institute (TARI). Other genotypes were acquired from Malawi, Rwanda, Ethiopia, Mozambique and Uganda. Out of the 201 genotypes, 102 were landraces and 99 were improved genotypes based on their classifications in the Tanzanian Official Seed Certification Institute (TOSCI) database (https://www.tosci.go.tz/seed-varieties?page=8). It should be noted that georeferenced data and the mapping exercise were conducted on the Tanzanian genotypes only. The five check genotypes were obtained from IRRI, Philippines, namely Pokkali, FL 478, CSR 28, and Nona Bokra, which are known for their tolerance to salinity and IRRI 154, which is a salt-sensitive genotype. The seeds were increased at SUA for conducting this study and the remaining stock is currently stored in a cold room located within the Department of Crop Science and Horticulture Main Building.
Phenotypic screening
The phenotypic screening was conducted in the screen house in August 2022 at Sokoine University of Agriculture (SUA), Morogoro, Tanzania located at latitude 6° 49′ 27″ S, longitude 37° 39′ 48″ E and elevation of 509 m above sea level.
Rice genotypes were screened for salt tolerance at the seedling stage in a hydroponic system using the IRRI standard protocol (Gregorio et al. Citation2013). The seeds were pre-treated at 50°C in a convection oven for 5 days to break dormancy and then germinated in petri dishes containing moistened filter paper for 2 days. The pre-germinated seeds were then sown on Styrofoam seedling floats established in trays filled with nutrient solution (Yoshida Citation1976) in a screen house. The experiment was conducted using a split-plot design with three replications each with salinized and non-salinized treatments. The 7-day-old seedlings were initially salinized (NaCl) using an electrical conductivity (EC) of 6 dS m−1, which was then increased to 12 dS m−1 after two days to reduce immediate shock. During treatment, EC (12 dS m−1) and pH (5.0–5.5) levels of the nutrient solution were checked daily and the nutrient solution was renewed weekly. The modified standard evaluation system (SES) was used in rating the visual symptoms of salt toxicity (Gregorio et al. Citation1997). This scoring discriminated the susceptible from the tolerant and the moderately tolerant genotypes. Initial and final scoring were done at 14 and 21 days after salinization, respectively.
Genotypic screening
Sample collection
A healthy youngest fully expanded leaf of each genotype from each of the 201 rice genotypes was collected from 3-week-old plants. During the sample collection, each leaf sample was rolled twice and punched to get four leaf disks of 6 mm. The leaf disks were then inserted into a specific well of 96-well plates according to the sample number. The samples were kept cool on ice throughout the sample collection. The sample plates were then lyophilized and ready for 1k-RiCA genotyping (GSL IRRI Citation2021).
The genotypes and checks used in this study were genotyped using the 1k-Rice Custom Amplicon (1k-RiCA assay), as described by Arbelaez et al. (Citation2019). The 1k-RiCA was designed to be used for genomic selection, QTL profiling, background selection, marker-assisted forward breeding, and marker-assisted backcrossing. Although about 90 major genes and QTLs for stress-tolerance, pathogen resistance, and other traits important to rice breeding are represented by the 1k-RiCA assay, this study focused on the genotypic variation in the presence of Saltol. Genomic DNA was obtained from leaf tissues of single plants. DNA extraction, genotyping, and single nucleotide polymorphism (SNP) calling was done using the genotyping services of Agriplex Genomics (Cleveland, OH, USA). A custom SNP calling pipeline developed by Agriplex Genomics was used to assign variants on the 1k-RiCA Amplicon through alignment to the Nipponbare rice genome MSU7 version (Kawahara et al. Citation2013). Final SNP data were merged and formatted in a single data frame with markers in rows and samples in columns providing information on the presence and absence of Saltol. The SNP identification, chromosome, and physical position information were also provided.
Spatial mapping of Tanzanian genotypes
The geographic origins of 120 Tanzanian genotypes with precise georeferenced information was mapped to identify the spatial distribution of phenotypically salt-tolerant and Saltol QTL-possessing rice genotypes across various rice-growing regions in Tanzania. Tanzania's regional boundaries were based on shape files obtained from the National Bureau of Statistics (NBS) (2012 PHC: Shape files – level one and two), and the resulting maps were produced employing QGIS version 3.2.2.
Spatial population structure analysis of Tanzanian genotypes
Using the 1k-RiCA SNP of the Tanzanian genotypes, together with the georeferenced information and salinity tolerance (SES scores) from the phenotypic screening, we conducted a spatial population structure analysis using the package tess3r v1.1.0 (Caye and Francois Citation2016; Caye et al. Citation2016). Using the 1k-RiCA SNP information of the 120 Tanzanian genotypes, together with the georeferenced information and salinity tolerance (SES scores) from the phenotypic screening, we conducted a spatial population structure analysis using TESS3 method (Caye et al. Citation2016) implemented in R package tess3r v1.1.0 (Caye and Francois Citation2016). The R packages maps v. 3.4.1.1 (https://cran.r-project.org/web/packages/maps/index.html) and glue v. 1.6.2 (https://cran.r-project.org/web/packages/glue/index.html) were used to generate plots in R version 4.3.1 (R Core Team Citation2023). Only the Tanzanian landraces were used for the spatial population structure analysis (not the improved varieties collected in Tanzania), for a total of 88 landraces.
Results
Identification of rice genotypes with Saltol QTL
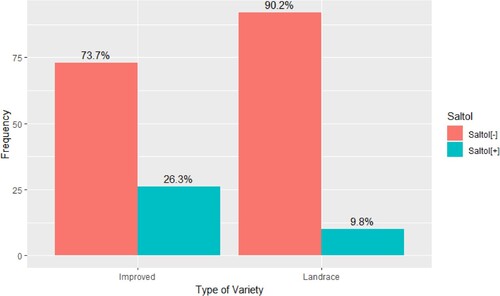
Based on genotyping data, the salinity-tolerant Saltol allele was present in 36 genotypes (10 landraces and 26 improved genotypes). This finding indicates that the proportion of improved cultivars possesses the salinity-tolerant Saltol allele (26.3%), compared to the landraces (9.8%) (Tables 1 and 2 found in the Supplementary materials). The chi-square test revealed a significant association between the presence or absence of the Saltol allele and the type of genotype (improved or landrace). The obtained p-value (p = 0.004) indicates that the observed difference in Saltol allele presence between the two types of cultivars is unlikely to have occurred by chance. Based on the chi-square test result, it can be concluded that the presence of the Saltol allele is significantly more frequently associated with the improved cultivars (26 out of 99) compared to the landraces (10 out of 102) ().
Figure 1. Proportion of rice genotypes from Eastern and Southern Africa (n = 201) in which the salinity-tolerant Saltol allele is present. The collection included 102 landraces and 99 improved cultivars from Eastern and Southern Africa. The genotyping was conducted by 1k RiCA (Agriplex Genomics). The presence of Saltol was significantly more frequently associated with improved genotypes compared with landraces (χ2 = 8.17, df = 1, p-value = 0.004).
Phenotypic screening of salt-tolerant genotypes
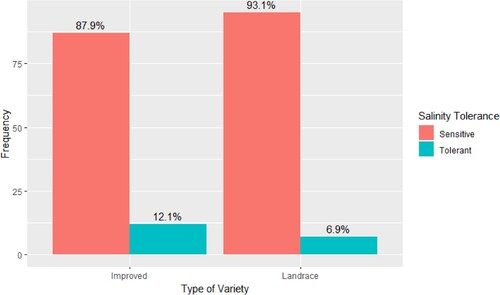
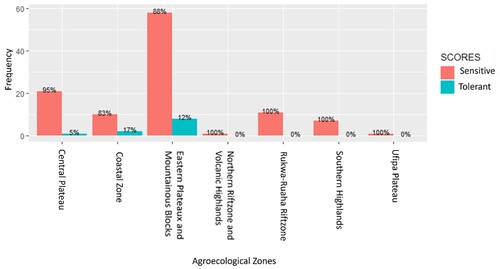
Among the 201 genotypes that were subjected to phenotypic screening using IRRI standard protocol, 19 genotypes (7 landraces and 12 improved cultivars) were tolerant (SES < 6) at EC of 12 dS m−1 under Yoshida hydroponic culture (Table 1 and Table 2 found in the Supplementary materials). The rice genotypes tested showed a range of phenotypic responses to salinity stress at the seedling stage. Three (1.5% of 201) genotypes (K5, Intsindagira bigega, ZX 117) were classified as tolerant with an SES score of 3–4.3 while 15 (7.5%) genotypes (Jaribu, Kijicho, Nerica 4, SATO 1, TXD 88 Improved, Moshi wa sigara, Mpaka wa bibi, Sukari, BR, Rumbuka, Nemeyubutaka, Terimbere, Chupa, Line 16, and Rumbuka bug 2013A) were moderately tolerant with SES scores of 5–5.7. One hundred and twenty-one (60.2%) genotypes were susceptible (SES score 6–8.3) and the remaining 62 genotypes (30.8%) were highly susceptible to salinity (SES score 9). However, only the tolerant checks (Pokkali, FL 478 and Nona Bokra) qualified to be highly tolerant with scores ranging from 1 to 1.7. Overall, a small proportion (6.9%) of the landraces and improved cultivars (12.1%) that were screened showed tolerance to salt stress with SES scores less than 6 (). The chi-square test was conducted and the results showed no statistically significant difference in the distribution of phenotypic tolerance between the landrace and improved genotypes (χ2 = 1.06, df = 1, p-value = .30). The calculated chi-square value of 1.06 with 1 degree of freedom indicates that the observed distribution of phenotypic tolerance is not significantly different between the two types of genotypes. The associated p-value of 0.30 suggests that the observed association between cultivar type and phenotypic tolerance is likely to have occurred by chance.
Figure 2. Proportion of phenotypically salt-tolerant (SES Score < 6) rice genotypes from Eastern South African segregated into landraces and improved cultivars (n = 201). The collection included 102 landraces and 99 improved genotypes from Eastern and Southern Africa. Phenotypic tolerance is not significantly different between the two types of genotypes (χ2 = 1.06, df = 1, p-value = 0.30).
Comparison of genotypic and phenotypic screening results
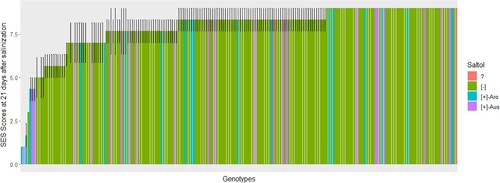
The study revealed that not all genotypes that phenotypically showed tolerance had the Saltol allele. We identified two genotypes, K5 from Uganda and Intsindagira bigega from Rwanda, that were both phenotypically salinity tolerant and in which the salinity-tolerant Saltol allele is present. This suggests that phenotypic screening is necessary to confirm the salinity tolerance of genotypes that possess the Saltol allele. Moreover, the salinity-tolerant Saltol allele was absent in some of the genotypes (16) which were considered phenotypically tolerant; of these, one genotype (ZX 117) was considered as tolerant while 15 genotypes were moderately tolerant (Jaribu, Kijicho, Nerica 4, SATO 1, TXD 88 Improved, Moshi wa sigara, Mpaka wa bibi, Sukari, BR, Rumbuka, Nemeyubutaka, Terimbere, Chupa, Line 16 and Rumbuka bug 2013A) (). This result highlights the need for further genotypic analysis to understand their mode of salt tolerance. Interestingly, the study also found that some of the Saltol-possessing genotypes (34 genotypes) were phenotypically susceptible to salt. This result suggests that Saltol alone may not provide sufficient salinity tolerance and that perhaps there are other QTLs and/or factors that may be contributing to their level of salinity tolerance.
Figure 3. Saltol alleles and visual scores for the genotypes selected from rice-growing areas of Eastern and Southern Africa, screened for 21 days at 12 dS m−1 salt concentration. The scores are the average of three replication of which 1 represents (highly tolerant), 3–4.3 (tolerant), 5–5.7 (moderate tolerant), 6–8.3 (susceptible), and 9 (highly susceptible). Saltol alleles were determined by 1K-RiCA Single nucleotide polymorphism (SNP) assay and the bar colors indicate the Saltol allele. + and − indicate the presence and absence of the Saltol allele respectively; ? indicates genotypes that were not called. Aro refers to aromatic rice and Aus refers to aus rice subgroups.
Geographic distribution of Tanzanian genotypes in relation to Saltol alleles and SES scores
Geographical maps ( and ) were produced to study the spatial distribution of the Tanzanian rice genotypes that have undergone phenotypic and genotypic screening for salinity tolerance. The spatial coverage of sampling locations included seven agro-climatic zones of the country, namely, the Central plateau, Coastal Zone, Eastern plateaux and Mountain blocks, Northern rift zone and Volcanic highland, Rukwa-Ruaha rift zone, Southern highland and Ufipa plateau.
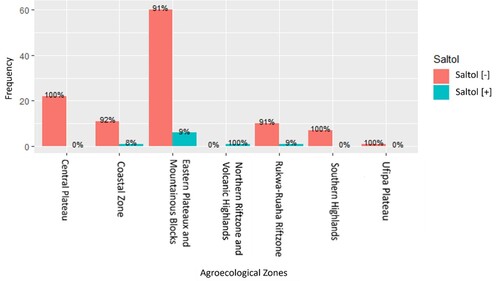
The salinity-tolerant Saltol allele was present in nine genotypes (7.5%) out of 120 genotypes from the sampled Tanzanian rice-growing areas across eight agro-ecological zones. One out of 12 (8%) Saltol-possessing genotypes were found in the Coastal Zone. The salinity-tolerant Saltol allele was present in six out of 66 genotypes (9%) from the Eastern plateaux and Mountain blocks, in one genotype (100%) from the Northern rift zone and volcanic highlands, and in one out of 11 genotypes (9%) from Rukwa-Ruaha rift zone. The salinity-tolerant Saltol allele was absent in the 22 genotypes, 7 genotypes, and 1 genotype from the Central plateau, Southern highlands, and Ufipa plateau, respectively ( and ).
Figure 4. Spatial distribution of rice genotypes showing the presence and absence of Saltol in the genotypes collected from Tanzania. The Saltol allele was identified after genotyping through 1K-Rice Custom Amplicon (1K-RiCA assay), as indicated by the symbol color. Aro refers to aromatic rice and Aus refers to aus rice subgroups.
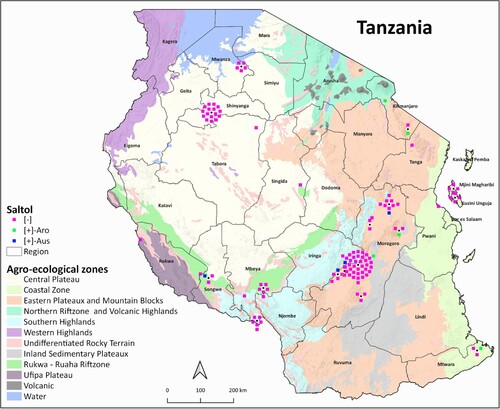
Figure 5. The percentages of rice genotypes possessing the salinity-tolerant Saltol allele in different agro-climatic zones of Tanzania. The percentages are calculated based on the number of genotypes in which the Saltol allele was present out of the total number of genotypes studied from each agro-ecological zone.
Phenotypically, 11 genotypes (9.2%) out of 120 genotypes from the sampled Tanzanian rice-growing areas across eight agro-ecological zones showed phenotypic salinity tolerance (SES scores less than 6). Out of 66 genotypes in the Eastern plateaux and Mountain blocks, 8 genotypes (12.1%) showed SES scores of less than 6. Two out of 12 genotypes (16.7%) were from the Coastal Zone and one of the 22 genotypes (4.5%) was from the Central plateau and showed phenotypic salinity tolerance (SES scores less than 6). None of the genotypes from the Southern Highlands, Northern rift zone Volcanic highlands, Rukwa-Ruaha rift zone and Ufipa plateau showed phenotypic salinity tolerance despite some of them possessing the Saltol allele ( and ).
Figure 6. The spatial distribution of the screened rice genotypes indicating the lowest to highest Standard evaluation system (SES) scores from rice-growing areas of Tanzania screened for 21 days at 12 dS m−1 salt concentration. The red, purple, and blue colored dots highlight the genotypes with low visual scores indicating tolerance while green, gray and yellow highlight genotypes with high visual scores indicating susceptibility (1: highly tolerant, 3–4.3: tolerant, 5–5.7: moderate tolerant, 6–8.3: susceptible, 9: highly susceptible).
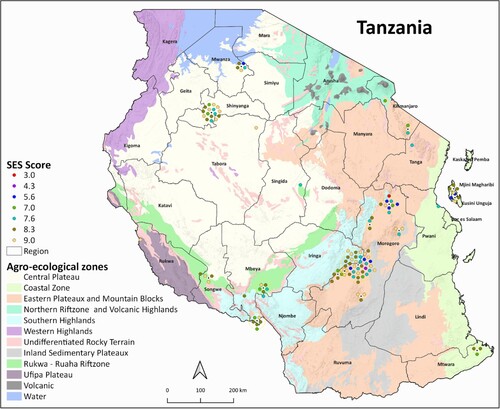
Figure 7. The distribution of rice genotypes categorized as tolerant (scoring <6 under phenotypic screening) in various agro-climatic zones of Tanzania. The number of genotypes studied varied across different zones.
Spatial population structure analysis of Tanzanian genotypes
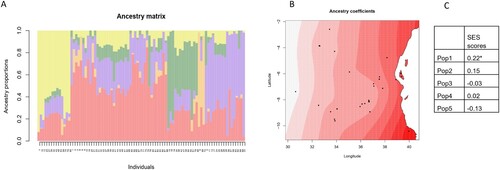
Using the TESS3 package for spatial population structure analysis, we determined the proportion of each of the five ancestral populations represented by each Tanzanian landrace genotype in this study ((A)). Spatial visualization of the ancestry coefficients indicated that, among populations, representation by Pop 1 was greatest in areas including the Coastal Region ((B), Supp. Fig. 1). However, the proportion of Pop 1 in each Tanzanian genotype was significantly correlated with higher SES scores from the phenotypic screening, indicating a decreased level of salinity tolerance ((C)). The representation of Pop 1 and its related SES scores were highly influenced by the genotypes collected in Mtwara (as indicated by the shading in the map), which did not include any salt-tolerant genotypes (as indicated in ).
Figure 8. Spatial population structure analysis generated using the TESS3 package in R. (A) Proportions of different ancestral populations within each genotype (K = 5, shown on the y-axis), with the genotype number shown on the x-axis (as indicated in Table 1). (B) Spatial visualization of Pop1 ancestry coefficients. Each point shows one accession, with darker shades indicating greater representation of the population. (C) Correlation coefficients between ancestry coefficients and SES scores from the phenotypic screening (*: p < 0.05).
Discussion
The screening of rice genotypes at the seedling stage for salinity tolerance has gained widespread acceptance as a method for selecting rice genotypes that exhibit tolerance to salt stress (Tahjib-Ul-Arif et al. Citation2018; Tabassum et al. Citation2021). This study employed both phenotypic and genotypic screening methods to assess the salinity tolerance of a collection of landraces and improved cultivars from Eastern and Southern Africa. Genotypic screening using 1K-Rica SNP markers checked for the presence of the Saltol allele, a major allele responsible for salinity tolerance at the seedling stage (Marè et al. Citation2023). The Standard Evaluation System (SES) was used to evaluate genotypes for phenotypic tolerance to salinity.
Since the results indicated that the salinity-tolerant Saltol allele was significantly more frequently present in improved cultivars than in the landraces we screened, we suggest that the Saltol allele may have been selectively bred or introduced in the improved genotypes to confer certain desirable traits. We attribute the observed variability to either intentional or unintentional introgression of salinity-tolerant Saltol allele during the breeding process. While genotypic screening indicated that improved varieties are more likely to possess the Saltol allele, the phenotypic screening indicated non-significant differences in phenotypic tolerance between the landrace and improved genotypes. This suggests that the cultivar type may not be a major factor influencing phenotypic tolerance in this study. Other genetic or environmental factors might play a more significant role in determining the phenotypic tolerance of Eastern and Southern African rice genotypes.
The genotypes K5 and Intsindagira bigega were identified as salinity-tolerant at the seedling stage exhibiting both phenotypic tolerance to salinity and the presence of the salinity-tolerant Saltol allele. Genetic background and breeding history of these cultivars have been indicated in literature as they were bred as varieties with high yield traits and have been tested and performed well in multi-environment trials, and the genotypes have been involved in breeding for resistance to bacterial blight (Nyongesa Citation2023). However, specific data on these cultivars source of Saltol are limited. We suggest that in these genotypes, the observed tolerance may be due to low Na+ absorption, high K+ absorption, and a low Na+/K+ ratio in rice shoots under salinity stress as reported by Krishnamurthy et al. (Citation2020). The Saltol allele functions by controlling the rate of sodium ion exclusion from the roots and their subsequent transport to the shoots. It helps to maintain a low sodium concentration in the leaves, which is vital for preventing cellular damage and maintaining proper physiological processes (Singh et al. Citation2021; Tabassum et al. Citation2021). Previous results also indicated that certain rice genotypes, despite carrying the Saltol allele, were phenotypically susceptible to salinity. Thomson et al. (Citation2010) found that the presence of the Saltol allele did not ensure a high degree of tolerance, and multiple QTLs are necessary for significant tolerance. The findings of Thomson et al. (Citation2010) strengthen the understanding of the Saltol locus. Their detection of multiple Pokkali alleles at the Saltol locus within a recombinant inbred line (RIL) population and between backcross lines provide compelling evidence for the presence of allelic variation within the Saltol locus. Exceptions were observed in a few genotypes, such as ZX 117, SATO 1, Terimbere, Nemeyebutaka, and Rumbuka which were tolerant in the phenotypic screening but were categorized as not having Saltol (). The ZX117 rice cultivar from Tanzania is known for its high grain yield potential and stability in its areas of adaptation, showing early maturity and tolerance to drought. As for the mechanisms of salinity tolerance in genotypes without the Saltol gene, research indicates that salt-tolerant genotypes may utilize various mechanisms, particularly in sensing and signaling of salt stress, regulation of transcription, ionic homeostasis, and Reactive Oxygen Species (ROS) scavenging in response to salt stress. These mechanisms are complex and involve multiple genes and pathways, which are still being explored to fully understand their role in conferring salt tolerance in rice (Mansuri et al. Citation2020). Results of this study also suggest that perhaps other QTLs apart from Saltol could be affecting the salinity tolerance at the seedling stage in these genotypes. Studies have indicated that mechanisms for salt tolerance are complex since many genes are involved in salt tolerance (Singh et al. Citation2021). A study conducted by Nguyen et al. (Citation2022) on Mekong River Delta landrace ‘Doc Phung’ indicated its tolerance to be independent of the Saltol allele as opposed to other varieties such as Pokkali. Therefore, the genotypes identified in this study could represent new sources of salinity tolerance and be used to develop new breeding lines with high levels of salinity tolerance at the seedling stage. The identification of moderately tolerant landraces in our study opens several avenues for further research including comprehensive genetic analysis involving genome-wide association studies (GWAS) to identify specific genes or quantitative trait loci (QTLs) associated with salinity tolerance other than Saltol and detailed mechanistic and physiological studies to determine the specific traits contributing to salinity tolerance in these landraces.
Understanding the distribution of salt-tolerant genotypes in different zones provide insights into rice plants’ adaptive capabilities under varying environmental conditions. This study analyzed a panel of 120 georeferenced Tanzanian genotypes and highlighted the presence and distribution of the salinity-tolerant Saltol allele in various genotypes across different agro-ecological zones in Tanzania. The results revealed that the Saltol allele was present in some genotypes from the sampled rice-growing areas, with varying frequencies in different agro-ecological zones. Despite a low number of sampled genotypes in certain areas, a high percentage of genotypes with the Saltol allele was observed. Additionally, the study ranked the agro-climatic zones based on phenotypic salinity tolerance, with the Coastal Zone exhibiting the highest proportion of tolerant genotypes. Among the 12 genotypes analyzed from the Coastal Zone, 2 (16.7%) exhibited the salinity tolerance trait, which was the highest observed phenotypic tolerance among the sampled genotypes. The observed tolerance in genotypes from the Coastal Zone may be due to local farmers and breeders selections since they have historically prioritized the cultivation of rice varieties with known or observed salinity tolerance.
Some genotypes with lower SES scores under salinity stress and those having the Saltol allele were found in regions known for their salt-prone environment (Meliyo et al., Citation2016; Kashenge-Killenga et al., Citation2016; Omar et al. Citation2022). Emphasizing the impact of the environment on salinity tolerance as elaborated by Manohara et al. (Citation2021), who described several genotypes including Pokkali that are geographically found in low-lying areas with soil salinity. According to Bin Rahman and Zhang (Citation2018), the tolerance could have been acquired through recurrent exposure to the salt stress in a specific geographic area and directional selection by rice farmers in these areas. Studies have indicated that adaptive selection can explain why varieties with tolerance to stress are found in places where that particular stress is found Nguyen et al. (Citation2022) proposed that adaptive selection for salinity tolerance might have influenced the salinity-tolerant rice accessions originating from the salinity-affected Ca Mau coastal region, similar to the indigenous varieties Nona Bokra and Pokkali, which are known for their salinity tolerance and originated from Bangladesh and coastal India where salinity stress is common, respectively. Given that certain genotypes with the Saltol allele and lower SES scores under salinity stress were found in regions known for their salinity-prone environments, future selection efforts should prioritize these specific geographic areas. These regions are more likely to harbor genotypes that have adapted to salinity stress.
Although the spatial population structure analysis () did not indicate the Coastal Zone to be correlated with increased salinity tolerance, this is likely due to the strong effect of salinity-susceptible genotypes from Mtwara influencing the ancestral population clustering. Given that the genotypes characterized in this study are landraces whose evolution and geographic distribution are affected by many environmental and sociological factors, the results from this study reflect the complex influences on landrace composition. Future studies including greater numbers of genotypes may be able to provide increased resolution among ancestral populations.
Conclusion and recommendations
In this study, we evaluated 201 rice genotypes from Eastern and Southern Africa to assess their phenotypic tolerance to salinity (12 dS m−1) and the presence of the Saltol allele. The results of our study revealed that the existence of the Saltol allele does not necessarily confer salinity tolerance during phenotypic screening. Notably, it was observed that a subset of genotypes showed salinity tolerance, despite the absence of the Saltol allele. This observation implies the potential existence of novel QTL that confer salinity tolerance to these genotypes. Furthermore, some genotypes possessed the Saltol allele and did not exhibit phenotypic tolerance, suggesting the possibility of functional polymorphism at the Saltol locus. We examined the spatial distribution of phenotypically salinity-tolerant genotypes and the presence of the Saltol allele across Tanzania. The variations in the distribution of Saltol allele-possessing genotypes suggest that specific regions may hold greater potential for the selection of salinity-tolerant rice genotypes. In conclusion, this study establishes an important foundation for future research aimed at improving the breeding of salinity-tolerant rice genotypes in Tanzania and Africa as a whole. The findings suggest that African rice genotypes may possess novel QTLs or variations in the Saltol allele that may be responsible for differences in salinity tolerance, which can be harnessed to develop new salinity-tolerant rice varieties in Africa. To enhance future research in this area, several recommendations should be considered. Firstly, it would be beneficial to increase the number of accessions tested and ensure a homogeneous representation across different agro-ecological zones. Additionally, underrepresented areas should be carefully analyzed to ensure a comprehensive understanding of the distribution and prevalence of salinity-tolerant genotypes. Analysis of novel QTLs and or functional polymorphisms at the Saltol locus among different genotypes would be a valuable direction for future research. Such an analysis could provide further insights into the genetic basis of salinity tolerance in rice and could help to explain the mixed results observed in our study. It is also important to assess the salinity tolerance of these genotypes during reproductive stages to assess their potential for enriching the gene pool of salt-tolerant rice. By addressing the recommendations outlined above, we can advance our understanding and application of salinity tolerance traits in rice breeding programs, ultimately contributing to increased resilience and productivity in salinity-affected rice-growing areas across Africa.
Acknowledgements
This study was made possible by the funding provided for the Climate Smart African Rice Research Project by the Danish International Development Agency (DANIDA), to whom we express our gratitude. Our appreciation also goes to TARI, IRRI, and farmers for generously sharing their seed collection and Mawazo Shitindi, Newton Kilasi and Susan Nchimbi-Msolla for collecting the seeds from farmers. We are especially thankful to Juma Omary, Hussein Abdallah, and Witness Luoga from Sokoine University of Agriculture for their unwavering support during the phenotypic screening. Additionally, we would like to acknowledge James Egdane, Marinell Ramirez, Rochelle Zantua, Caesar Arloo Centeno, Cornelia Garcia and Steve Klassen from IRRI HQ for their invaluable assistance in screenhouse, laboratory work, data analysis and GIS work. We would like to give a special mention to Damien Platten and Maria Ymber Reveche for their guidance in genotyping. K. K. L. designed the study, conducted the screening work, collected data, and drafted the manuscript. K. K. L., M. O., and D. C. conducted the data analysis. A. H., M. O., D. C., O. P., S. N., and N. L. K. reviewed and edited the manuscript.
Additional information
Funding
Notes on contributors
Kefrine Kennedy Lutambi
Kefrine Kennedy Lutambi is an assistant scientist at Sokoine University of Agriculture, Tanzania, specializing in the breeding of rice varieties that are tolerant to abiotic stresses, with a particular focus on salinity.
Amelia Henry
Amelia Henry is a senior researcher at IRRI, leading efforts to develop drought-resistant rice. Her work involves identifying new drought and direct-seeded rice breeding accessions, dissecting major- QTLs related to drought tolerance in rice and understanding rice root water uptake under drought.
Marjorie De Ocampo
Marjorie De Ocampo, an associate scientist at IRRI in Los Banos, Philippines, concentrates her efforts on the genotypic screening of rice genotypes for tolerance to salinity and drought stress.
Dmytro Chebotarov
Dmytro Chebotarov is a scientist at IRRI, based in Los Banos, Philippines. His work focuses on computational science and bioinformatics.
Ole Pedersen
Prof. Ole Pedersen, from the Department of Biology at the University of Copenhagen, Denmark, researches the eco-physiology of crops and wetland plants. His work emphasizes on traits that confer tolerance to flood and salinity.
Susan Nchimbi-Msolla
Susan Nchimbi-Msolla is a professor at the Sokoine University of Agriculture with over 30 years of experience in plant breeding and genetics. She has supervised numerous graduate students and researched various crops, primarily common beans and rice.
Newton L. Kilasi
Newton L. Kilasi is a senior scientist at the Sokoine University of Agriculture. His research interest lies in the molecular breeding of rice genotypes for tolerance to various abiotic stresses, including heat and salinity.
References
- Abbas A, Khan S, Hussain N, Hanjra MA, Akbar S. 2013. Characterizing soil salinity in irrigated agriculture using a remote sensing approach. Physics and Chemistry of the Earth. 55-57:43–52. doi:10.1016/j.pce.2010.12.004.
- Adak S, Datta S, Bhattacharya S, Ghose TK, Lahiri Majumder A. 2020. Diversity analysis of selected rice landraces from West Bengal and their linked molecular markers for salinity tolerance. Physiol Mol Biol Plants. 26(4):669–682. doi:10.1007/s12298-020-00772-8.
- Arbelaez JD, Dwiyanti MS, Tandayu E, Llantada K, Jarana A, Ignacio JC, Platten JD, Cobb J, Rutkoski JE, Thomson MJ, et al. 2019. 1k-RiCA (1K-rice custom amplicon) a novel genotyping amplicon-based SNP assay for genetics and breeding applications in rice. Rice. 12:1. doi:10.1186/s12284-019-0311-0.
- Arzani A, Rezai AM, Singh RK, Gregorio GB. 2008. Assessment of rice genotypes for salt tolerance using microsatellite markers associated with the saltol QTL. Afr J Biotechnol. 7(6):730–736.
- Bin Rahman ANMR, Zhang J. 2018. Preferential geographic distribution pattern of abiotic stress tolerant rice. Rice. 11(1):1–16. doi:10.1186/s12284-018-0202-9.
- Caye K, Deist T, Martins H, Michel O, Francois O. 2016. TESS3: fast inference of spatial population structure and genome scans for selection. Mol Ecol Resour. 16(2):540–548. doi:10.1111/1755-0998.12471.
- Caye K, Francois O. 2016. tess3r: inference of spatial population genetic structure. R package version. 1(1):0.
- Chen T, Zhu Y, Chen K, Shen C, Zhao X, Shabala S, Shabala L, Meinke H, Venkataraman G, Chen ZH, et al. 2020. Identification of new QTL for salt tolerance from rice variety Pokkali. J Agron Crop Sci. 206(2):202–213. doi:10.1111/jac.12387.
- Dar MH, Bano DA, Waza SA, Zaidi NW, Majid A, Shikari AB, Ahangar MA, Hossain M, Kumar A, Singh US. 2021. Abiotic stress tolerance-progress and pathways of sustainable rice production. Sustainability. 13:2078. doi:10.3390/su13042078.
- Eswar D, Karuppusamy R, Chellamuthu S. 2021. Drivers of soil salinity and their correlation with climate change. Curr Opin Environ Sustain. 50(January):310–318. doi:10.1016/j.cosust.2020.10.015.
- Gregorio G, Islam R, Vergara G, Thirumeni S. 2013. Recent advances in rice science to design salinity and other abiotic stress tolerant rice varieties. SABRAO J Breed Genet. 45:31–41.
- Gregorio GB, Senadhira D, Mendoza RD. 1997. Screening rice for salinity tolerance. Los Baños: IRRI. IRRI Discussion Paper Series No. 22; p. 1–30.
- Gregorio GB, Senadhira D, Mendoza RD, Manigbas NL, Roxas JP, Guerta CQ. 2002. Progress in breeding for salinity tolerance and associated abiotic stresses in rice. Field Crops Res. 76(2–3):91–101. doi:10.1016/S0378-4290(02)00031-X.
- GSL IRRI. 2021. International rice research institute genotyping service laboratory. [accessed 2021 September 12]. https://isl.irri.org/services/genotyping/rica.
- Kashenge-Killenga S, Meliyo J, Urassa G, Kongo V. 2016. Extent of salt-affected soils and their effects in irrigated and lowland rain-fed rice growing areas of Southwestern Tanzania. In: Lal ETALO, Kraybill R, Hansen D, Singh O, Mosogoya BR, editors. Climate Change and Multi-Dimensional Sustainability in Agriculture: Climate Change and Sustainability in Agriculture. Springer; p. 97–126. doi:10.1007/978-3-319-41238-2_3.
- Kawahara Y, Bastide MD, Hamilton JP, Kanamori H, Mccombie WR, Ouyang S, Schwartz DC, Tanaka T, Wu J, Zhou S, et al. 2013. Improvement of the Oryza sativa Nipponbare reference genome using next generation sequence and optical map data. Rice. 6(1):1–10.
- Krishnamurthy SL, Pundir P, Warraich AS, Rathor S. 2020. Introgressed saltol QTL lines improves the salinity tolerance in rice at seedling stage. Front Plant Sci. 11(June):1–13. doi:10.3389/fpls.2020.00833.
- Linh LH, Linh TH, Xuan TD, Ham LH, Ismail AM, Khanh TD. 2012. Molecular breeding to improve salt tolerance of rice (Oryza sativa L.) in the Red river delta of Vietnam. Int J Plant Genomics. 2012. doi:10.1155/2012/949038.
- Manohara KK, Morajkar S, Shanbhag Y, Phadte P, Singh NK. 2021. Haplotype analysis of Saltol QTL region in diverse landraces, wild rice and introgression lines of rice (Oryza sativa L.). Plant Genet Resour Characterisation Util. 19(4):1–10. doi:10.1017/S1479262121000320.
- Mansuri RM, Shobbar ZS, Babaeian Jelodar N, Ghaffari M, Mohammadi SM, Daryani P. 2020. Salt tolerance involved candidate genes in rice: an integrative meta-analysis approach. BMC Plant Biol. 20:452. doi:10.1186/s12870-020-02679-8.
- Marè C, Zampieri E, Cavallaro V, Frouin J, Grenier C, Courtois B, Brottier L, Tacconi G, Finocchiaro F, Serrat X, et al. 2023. Marker-assisted introgression of the salinity tolerance locus Saltol in temperate Japonica rice. Rice. 16:1. doi:10.1186/s12284-023-00619-2.
- Meliyo JL, Kashenge-killenga S, Victor KM, Mfupe B, Hiza S, Kihupi L, Boman BJ, Dick W. 2016. Evaluation of salt affected soils for rice (Oryza sativa) production in Ndungu irrigation scheme same district, Tanzania. Sustain Agric Res. 6(1):24–38. doi:10.5539/sar.v6n1p24.
- Nguyen TT, Dwiyanti MS, Sakaguchi S, Koide Y, Le DV, Watanabe T, Kishima Y. 2022. Identification of a saltol-independent salinity tolerance polymorphism in rice Mekong delta landraces and characterization of a promising line, Doc Phung. Rice. 15:1. doi:10.1186/s12284-022-00613-0.
- Nhamo N, Rodenburg J, Zenna N, Makombe G, Luzi-Kihupi A. 2014. Narrowing the rice yield gap in East and Southern Africa: using and adapting existing technologies. Agricultural Systems. 131:45–55. doi:10.1016/j.agsy.2014.08.003.
- Nyongesa O. 2023. Genotypes x environment interaction and effects of soil nutrients variability on rice yield for irrigated and rainfed ecologies in Eastern and Southern Africa. Paper presented at the International Rice Congress; Oct 16–19; Manila, Philippines.
- Omar MM, Shitindi MJ, Massawe BHJ, Fue KG, Pedersen O. 2022. Exploring farmers’ perception, knowledge, and management techniques of salt-affected soils to enhance rice production on small land holdings in Tanzania. Cogent Food Agric. 8(1):1–20. doi:10.1080/23311932.2022.2140470.
- Pray C, Nagarajan L, Li L, Huang J, Hu R, Selvaraj KN, Napasintuwong O, Babu R. 2011. Potential impact of biotechnology on adaption of agriculture to climate change: The case of drought tolerant rice breeding in asia. Sustainability. 3:1723–1741. doi:10.3390/su3101723.
- Rasheed A, Li H, Nawaz M, Mahmood A, Hassan MU, Shah AN, Hussain F, Azmat S, Gillani SFA, Majeed Y, et al 2022. Molecular tools, potential frontiers for enhancing salinity tolerance in rice: a critical review and future prospective. Front Plant Sci. 13:966749. doi:10.3389/fpls.2022.966749.
- R Core Team. 2023. R (4.3.1): a language and environment for statistical computing. Vienna: R Foundation for Statistical Computing. https://www.R-project.org.
- Reddy INBL, Kim SM, Kim BK, Yoon IS, Kwon TR. 2017. Identification of rice accessions associated with K+/Na+ ratio and salt tolerance based on physiological and molecular responses. Rice Science. 24(6):360–364. doi:10.1016/j.rsci.2017.10.002.
- Schneider P, Asch F. 2020. Rice production and food security in Asian mega deltas – a review on characteristics, vulnerabilities and agricultural adaptation options to cope with climate change. J Agron Crop Sci. 206(4):491–503. doi:10.1111/jac.12415.
- Singh RK, Kota S, Flowers TJ. 2021. Salt tolerance in rice: seedling and reproductive stage QTL mapping come of age. Theor Appl Genet. 134(11):3495–3533. doi:10.1007/s00122-021-03890-3.
- Sun B, Fu C, Fan Z, Chen Y, Chen W, Zhang J, Jiang L, Lv S, Pan D, Li C. 2019. Genomic and transcriptomic analysis reveal molecular basis of salinity tolerance in a novel strong salt-tolerant rice landrace Changmaogu. Rice. 12(99):1–15. doi:10.1186/s12284-019-0360-4.
- Tabassum R, Tahjib-Ul-Arif M, Hasanuzzaman M, Sohag AAM, Islam MS, Shafi SMSH, Islam MM, Hassan L. 2021. Screening salt-tolerant rice at the seedling and reproductive stages: an effective and reliable approach. Environ Exp Bot. 192(June):104629. doi:10.1016/j.envexpbot.2021.104629.
- Tahjib-Ul-Arif M, Sayed MA, Islam MM, Siddiqui MN, Begum SN, Hossain MA. 2018. Screening of rice landraces (Oryza sativa L.) for seedling stage salinity tolerance using morpho-physiological and molecular markers. Acta Physiol Plant. 40:4. doi:10.1007/s11738-018-2645-4.
- Thomson MJ, de Ocampo M, Egdane J, Rahman MA, Sajise AG, Adorada DL, Tumimbang-Raiz E, Blumwald E, Seraj ZI, Singh RK, et al. 2010. Characterizing the saltol quantitative trait locus for salinity tolerance in rice. Rice. 3:148–160. doi:10.1007/s12284-010-9053-8.
- Vu HTT, Le DD, Ismail AM, Le HH. 2012. Marker-assisted backcrossing (MABC) for improved salinity tolerance in rice (Oryza sativa L.) to cope with climate change in Vietnam. Aust J Crop Sci. 6(12):1649–1654. https://search.informit.org/doi/epdf/10.3316informit.143457801731758
- Wani SH, Kumar V, Khare T, Guddimalli R, Parveda M, Solymosi K, Suprasanna P, Kavi Kishor PB. 2020. Engineering salinity tolerance in plants: progress and prospects. Planta. 251(4):1–29. doi:10.1007/s00425-020-03366-6.
- Waziri A, Kumar P, Purty RS. 2016. Saltol QTL and their role in salinity tolerance in rice. Austin J Biotechnol Bioeng. 3(3):1–5.
- Yoshida S. 1976. Routine procedure for growing rice plants in culture solution. In: Yoshida S, Forno DA, Cock JH, editors. Laboratory manual for physiological studies of rice. Los Baños: International Rice Research Institute; p. 61–66.
- Zeng L, Poss JA, Wilson C, Draz ASE, Gregorio GB, Grieve CM. 2003. Evaluation of salt tolerance in rice genotypes by physiological characters. Euphytica. 129(3):281–292. doi:10.1023/A:1022248522536.