
 ?Mathematical formulae have been encoded as MathML and are displayed in this HTML version using MathJax in order to improve their display. Uncheck the box to turn MathJax off. This feature requires Javascript. Click on a formula to zoom.
Abstract
Inroads have been made in our understanding of the risks posed to human health and the environment by nanoparticles (NPs) but this area requires continuous research and monitoring. Machine learning techniques have been applied to nanotoxicology with very encouraging results. This study deals with bridging physicochemical properties of NPs, experimental exposure conditions and in vitro characteristics with biological effects of NPs on a molecular cellular level from transcriptomics studies. The bridging is done by developing and implementing Bayesian Networks (BNs) with or without data preprocessing. The BN structures are derived either automatically or methodologically and compared. Early stage nanotoxicity measurements represent a challenge, not least when attempting to predict adverse outcomes and modeling is critical to understanding the biological effects of exposure to NPs.
The preprocessed data-driven BN showed improved performance over automatically structured BN and the BN with unprocessed datasets. The prestructured BN captures inter relationships between NP properties, exposure condition and in vitro characteristics and links those with cellular effects based on statistic correlation findings. Information gain analysis showed that exposure dose, NP and cell line variables were the most influential attributes in predicting the biological effects. The BN methodology proposed in this study successfully predicts a number of toxicologically relevant cellular disrupted biological processes such as cell cycle and proliferation pathways, cell adhesion and extracellular matrix responses, DNA damage and repair mechanisms etc., with a success rate >80%. The model validation from independent data shows a robust and promising methodology for incorporating transcriptomics outcomes in a hazard and, by extension, risk assessment modeling framework by predicting affected cellular functions from experimental conditions.
Introduction
The term nanoparticles (NPs) covers particulates with one or more dimensions in the sub-100 nm size range which can differ widely in composition, size, shape and solubility as well as other physicochemical properties. They are not a single entity and the diversity in properties is only matched by the range of possible biological interactions associated with such NP properties. This creates a significant challenge for pro-active risk characterization for the adequate prevention of human and/or environmental health effects whilst still reaping the societal benefits of nanotechnology. This is further compounded by the rate of development in nanotechnologies and their increasingly widespread use in commercial products such as electronic devices, food packaging and health care.
Human and environmental exposure to NPs is a current issue and can be both incidental (e.g. occupational exposure) or deliberate (e.g. cosmetics). NPs can enter the human body via a number of routes including inhalation, ingestion or skin absorption where they themselves can become modified and may also cause biological perturbations. The toxicity of different NPs has already been documented by a number of studies (Ajdary et al. Citation2018; Cao Citation2018; Gerber et al. Citation2013; Stensberg et al. Citation2011) utilizing both in vitro and in vivo models showing a broad range of property dependent effects from relatively minor (e.g. oxidative stress) to the more serious (e.g. mutagenicity). This variation in toxicity demonstrates that not all NPs are toxic and not all NPs are nontoxic, thereby stressing the need for efficient and predictive approaches to hazard characterization of different NPs.
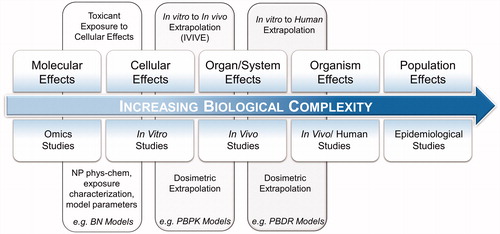
Systems toxicology () extrapolates short-term observations to long-term outcomes, integrating information from experimental systems (molecular, cellular and macroscopic) with potential risks to humans (phenotypic and population level studies) (Belcastro et al. Citation2018; Boué et al. Citation2017). Omics technologies ( left) study the changes in epigenome, transcriptome, proteome and metabolome induced by a substance. Integration of omics with the toxicity of a substance is called toxicogenomics and bridges molecular and cellular effects (NRC Citation2005; Sahu et al. Citation2015; George et al. Citation2010). Capturing dysfunctions at a molecular level allows omics technologies to trace adverse effects at low doses including early and sub-clinical effects that traditional in vitro and in vivo studies may overlook (Kawata, Osawa and Okabe Citation2009; Bai et al. Citation2017). Toxicokinetics models (, center) such as Physiologically Based Pharmaco-Kinetic models (PBPK) and Physiologically Based Dose Response (PBDR) models enable in vitro-to-in vivo and in vivo-to-human extrapolation of observations (Judson et al. Citation2011; Li and Reineke Citation2012; Raies and Bajic Citation2016; Carlander et al. Citation2016). Findings from human exposure and epidemiological studies ( right), supplemented by experimental studies, provide the information needed for substance safety regulation.
Figure 1. A systems toxicology paradigm. The pathway aims to extrapolate all available toxicological information to humans using a combination of in silico methods and toxicokinetics modeling. Molecular level analysis provides toxicological information preceding cellular and physiological manifestation of effects. In vitro methods investigate cellular effects of direct exposure to a substance. In vivo studies provide an examination of a variety of tissues in controlled environments. Human studies require biomonitoring, sampling and tissues/fluids analysis. Population level effects is the culmination of this extrapolation with supporting evidence typically requiring longitudinal observations and large-scale data gathering.
Adverse outcome pathways (AOPs) systematically address the organization and gathering of systems of toxicology information for specific substances. AOPs have been developed as identifiable event chains that link the effects at molecular level to human level (OECD Citation2017). Although recent trends in toxicology focus on toxicity pathways, mode of actions and AOPs (Raies and Bajic Citation2016; NRC Citation2007; Shukla et al. Citation2010; Nel et al. Citation2013), definite AOPs have not yet been established for specific NPs or classes of NPs (e.g. poorly soluble, low toxicity NPs) due to toxicity data gaps (Gerloff et al. Citation2017), although there are areas of advancement (Vietti, Lison and van den Brule Citation2016). Increasingly, omics data have become more widely available given the increase in high-throughput and high content screening methods. However, the development of state-of-the-art knowledge that integrates such data from these various methods with more traditional animal and epidemiological information, is still a developing process (Stagljar Citation2016; Labib et al. Citation2016; Buesen et al. Citation2017; Sauer et al. Citation2017).
Although toxicity has been observed with a variety of NPs to variable extents and outcomes, how the specific physicochemical properties of different NPs and cellular properties of exposed systems relate to adverse effects is not comprehensively understood. The availability of data surrounding the interaction between biological systems and NPs is still relatively limited as compared to other chemical compounds (Bai et al. Citation2017). Dealing with the variety of NPs physicochemical properties, routes of exposures, dosimetry, and their multiple effects on biological systems means that Machine Learning (ML) tools are particularly well suited toward the prediction of biological effects based on NPs properties (Winkler et al. Citation2013; Marvin et al. Citation2017; Sizochenko et al. Citation2014). Furthermore, computational models are fast and cheap and as they rely on information inputs rather than physical test materials, they can be used to predict the impact of materials not yet synthesized, thereby contributing to the development process, particularly in relation to safe-by-design approaches. This efficient approach assists in the development of safer Nanomaterials (NMs) without stifling their commercial development (Winkler et al. Citation2014) in the way that iterative processes of physical material development and in vitro/in vivo safety testing can through constraints of cost and time. Most modeling efforts have thus far been based on Quantitative Structure-Activity Relationships models (QSAR or nano-QSAR) using nano-descriptors and physicochemical properties (Napierska et al. Citation2010; Choi et al. Citation2018; Chen et al. Citation2017). QSAR models do not provide insights into the toxicity pathways, but instead predict endpoints from in vivo or in vitro studies (e.g. carcinogenic or noncarcinogenic) (Jagiello et al. Citation2016). Recently, novel models called RASARs (Read-Across Structure Activity Relationships) are being used to define chemical similarity (Luechtefeld et al. Citation2018). Another emerging recent approach, Quantitative Structure-Toxicity Relationships (QSTR) perturbation models, have been applied to estimate toxicity and ecotoxicity of NPs for different endpoints and experimental conditions with remarkable performance (Kleandrova et al. Citation2014a; Luan et al. Citation2014; Kleandrovaet al. Citation2014b, González-Durruthy et al. Citation2017). QSTR-perturbation models apply moving average analysis to reconstruct the case descriptors and perturbation theory to get the final optimization function based on differences of case pair combinations. Whether based on data fusion or approximate methods such approaches are promising in the field of nanotoxicology.
Bayesian networks (BNs) are ML probabilistic graphical models that merge automated probabilistic analysis and human insight for a wide range of problem solving. BNs have been used in a plethora of studies for forecasting complex system outputs, including risk evaluation, medical diagnosis, skin sensitization and clinical decision-making (Morgan Citation2005; Jaworska, Gabbert and Aldenberg, Citation2010; Jaworska et al. Citation2013). They are increasingly relied upon on the modern, data rich society we find ourselves in and unsurprisingly are finding a significant role in nanosafety and have been used to support risk assessment and prioritize NMs hazard assessment (Marvin et al. Citation2017; Murphy et al. Citation2016; Sheehan et al. Citation2018).
The aim of this study is to develop and apply a BN classifier that predicts NP-induced cellular effects using data inputs addressing NP physicochemical properties, experimental exposure conditions in vitro characteristics and transcriptomics outcomes. The study data gathered for output use functional analysis of the altered genes; investigating which biological pathways are most disrupted after exposure to a test substance (Römer et al. Citation2014; McDermottet al. Citation2013; Lin and Lane Citation2017). This represents a growing field within toxicology because of its capacity to improve risk assessment (Shukla et al. Citation2010; Buesen et al. Citation2017; Tsiliki, Nymark, Kohonen, Grafström and Sarimveis Citation2017; Franceschi et al. Citation2017). Using this approach, we seek to predict disruption of biological processes owing to genetic perturbations generated by physicochemical properties of NPs. The focus of this study is to determine the predictive capability of a modeling approach focused on biological pathways in vitro which align with AOPs relevant to nanotoxicity.
Materials and methods
Approach
BNs were constructed and evaluated as outlined in with the input data derived through a review of the peer reviewed, scientific literature. The extracted data were then applied either in its unprocessed, raw form (Raw Dataset, RD) or processed to address imbalance, data gaps, and discretization of values to form the Processed Dataset (PD). Imbalance issues in the dataset occurs when one of the outputs has more counts than the other which in turn can limit classifiers performance (Choi et al. Citation2018; Wang et al. Citation2018).
Figure 2. Workflow of BN construction and evaluation.
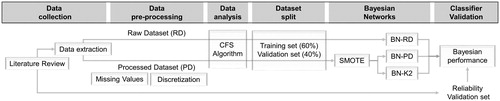
Data were then analyzed using a Correlation Feature Selector (CFS) algorithm, which provides some initial insight into the relationships among the attributes (inputs and outputs). Based on these relationships, the BNs were manually crafted into prestructured networks with the two datasets, RD and PD, randomly split into training (60%) and validation (40%) sets. The training PD set was enriched by applying a Synthetic Minority Technique (SMOTE) to address imbalance issues. For each dataset, different BNs were constructed; a BN based on the RD (BN-RD) and another based on the PD (BN-PD). A third BN with a structure learned from the data using the K2 algorithm was also applied for the PD (BN-K2). The K2 algorithm uses a greedy search with no restriction on the number of parents a node can have (Lerner and Malka Citation2011) while BN-RD and BN-PD have maximum four parents in each node. All BNs are trained and applied as binary classifiers individually for each of the nine outcomes (Furxhi et al. Citation2018). At the final stage, all BNs were validated against the training and validation sets with an additional validation, using a reliability set, finally used to evaluate the BN performance when data from new studies are introduced.
Data collection and curation
Toxicity outcomes of the studies gathered
Data from in vitro differential gene expression analysis studies were gathered from peer-reviewed scientific literature. Omics methods in nanotoxicology is advocated due their ability to capture different outcomes. Whole-genome transcriptomics studies were selected since the use of existing standardized tests might miss, in principle, novel endpoints Marchese Robinson et al. (Citation2016). In targeted analysis, such as targeted genes sequencing using polymerase chain reaction (PCR) only the regions of select set of genes are analyzed. Unexpected changes outside the examining genes are not observed such as in whole-genome analysis (Boon and Faas Citation2013; Hrdlickova, Toloue and Tian, Citation2017). We collected non-targeted analyses carried out for the complete genome (whole-genome analysis) in human cell lines using a systematic search strategy using Boolean logic operators (AND, OR and NOT) combined with key search terms (e.g. nanoparticle, nanomaterial, transcriptomics, gene expression, whole-genome) to form defined search strings. These search strings were applied to various publicly available search engines and databases (Google Scholar, ScienceDirect, PubMed, NCBI GEO Datasets, NanoMiner and ArrayExpress). A summary of the retrieved literature is available at (Furxhi Citation2019).
Data completeness is a measure of the extent to which the data which serve to address a specific need are available (Marchese Robinson et al. Citation2016). In our case, the focus was studies that extract enriched Gene Ontology analysis terms from the most significant dysregulated expressed genes that are associated with biological processes. Almost all studies selected had, as a first minimum requirement, to have validated quality and integrity of RNA extraction prior to microarray analysis. In addition, most of the studies further validate the results by applying real-time quantitative PCR analysis. Furthermore, in order to maintain high relevance for human health effects, all studies gathered here analyze human cell lines after exposure to NPs (Marchese Robinson et al. Citation2016).
The studies gathered had a considerably variety of different human cell models including both primary cells and immortalized cell lines which exhibit varying responses. In addition, the cellular models were restricted to human cells to limit uncertainties related to species-specific biological mechanisms (Judson et al. Citation2011; Shukla et al. Citation2010; Jaworska, Gabbert and Aldenberg Citation2010). The use of a broad variety of cell models was to breadth of biological interactions arising from a variety of possible NP exposure routes. For example, the use of type-II alveolar epithelial (A549) cells and macrophage cells (e.g. differentiated monocyte derived macrophages) to represent inhalation exposure, intestinal cells (e.g. Caco-2) to represent ingestion route and gastrointestinal exposure, endothelial cells to reflect cardiovascular exposure, either deliberate (intravenous delivery) or incidental (translocation).
Toxicity determinants in the studies gathered
Numerous factors can determine the relative toxicity of substances compounds, such as the route of exposure (e.g. inhalation, oral, dermal), external exposure, tissue dose, persistence in the biological environment (duration of biological interaction), as well as physicochemical properties of NPs (shape, core size, coating etc.). Furthermore, different tissue types, cell models and experimental parameters (e.g. particle dispersion and cell culture conditions) add further data variables.
A challenge associated with defining information criteria for NPs is that the current understanding of independent variables, such as physicochemical properties and other experimental variables, which contribute most to the outputs of assays is arguably insufficient (Marchese et al. Citation2016). The lack of harmonization in toxicological analysis, NP characterization and preparation as well analysis and reporting within the nanotoxicological literature, driven in part lack of standard protocols for NP in vitro toxicity studies (Drasler et al. Citation2017; Warheit Citation2018) generates significant heterogeneity of the literature data.
In this study, we collected all available information on NP characterization from each study keeping a minimum requirements check list in order to identify in silico the physicochemical properties and other experimental variables that significantly affect the outputs of transcriptomics studies. The studies selected include “priority” properties of interest for NP characterization during toxicological assessment as reported in (Hackley et al. Citation2013). Besides RNA extraction quality check, the second minimum requirement for a study to be considered was reporting NP size and a traceable origin, i.e., either the synthesis method of the NP, or product name and manufacturer for commercially available NPs. Additional physicochemical parameters (such as surface area) are deemed important for the data to be considered complete (Hackley et al. Citation2013; Marchese Robinson et al. Citation2016). Studies missing information for such attributes were also included when this information could be retrieved from the NP manufacturing or synthesis information.
Within nanoscience, less attention has been paid to the question of which additional experimental details used, need to be recorded ((Marchese Robinson et al. Citation2016). In this study, we gathered experimental and in vitro characteristics, such as exposure dose and duration and cell line, cell type and microarray protocol. A third minimum requirement for a study to be considered was to report exposure dose and duration, with one exception, (Peng et al. Citation2010) where it was not relevant. Cell line would have been a fourth requirement but it was, in any case, always reported.
In general, information on physicochemical properties was scarce but traceable, whereas, exposure (dose and duration) and in vitro conditions were always reported. Supplementary online material provides a classification of information given in the selected studies (Furxhi Citation2019). All studies provide information for the majority of the toxicity determinants/methods/outputs classes.
For each of the studies reviewed, the combination of experimental exposure conditions, in vitro characteristics, such as cell line, cell type and tissue, physicochemical properties and outcomes are recorded separately in a datasheet, resulting in many extractions per study. If, for instance, another dose is administered during an experiment with all the other conditions unchanged, this was inserted as new instance within the dataset.
Biological effects comprising a number of cellular responses (see outputs) were extracted and used as the outcome of interest to be simulated by the BN model. Effect occurrence was expressed in binary manner (Triggered, No effect). The NP is said to have a toxic effect (Triggered) based on the conclusions of the relevant study from which the data was derived. The studies analyzed dysregulated genes filtered with a cutoff criteria (p-value or log2 fold change) in order to identify the most significant perturbed genes at in vitro systems after exposure to NPs. Gene Ontology analysis was then performed to functionally annotate the candidate genes with the related biological effect. Triggered output is defined as the biological effect that correspond to cellular responses of disturbed gene functions after NP exposure. While ‘No effect’ was determined were cellular processes were not significantly disturbed after exposure to a NP.
Table 1. Processed Dataset (PD) inputs and outputs extracted from literature review and their states (categories)/numerical ranges and abbreviations used in this study.
Data preprocessing
As such, missing values in the compiled dataset were not uncommon, with several physicochemical properties not reported in most of the studies, most notably composition (presence of impurities in bulk and coatings) and surface area.
Filling the missing values from articles ‘Supplementary information’, as well as information gathered directly from the manufacturers’ (e.g. material safety data sheets) which resulted in a second dataset (PD). Density values derived from manufactures information combined with particle size distribution data (assuming spherical shape and smooth surface) can be used to calculate the Specific Surface Area (SSA) (Ha et al. Citation2018). Furthermore, as well as data gap filling, discretization was also performed during preprocessing. The range of the numeric input attributes in the PD is discretized and expressed as nominal equal frequented bins with some input ranges obtained from literature, such as core size and zeta potential (Hristozov et al. Citation2014).
Data analysis
Correlation Feature Selection algorithm (CFS) was applied to the data to remove irrelevant and redundant information allowing a classifier to operate more effectively (Kohavi and John Citation1997; Doshi and Chaturvedi Citation2014). WEKA (Waikato Environment for Knowledge Analysis, version 3.8.2), an open-source Machine Learning workbench was used for the CFS application and BNs construction. We used the algorithm to investigate associations between the variables individually for the two datasets (Hall and Smith Citation1998). CFS was applied in 10-fold cross-validation (out-of-sample testing) which randomly selects ten equal size subsamples of the dataset for validation. Of the ten subsamples, a single one is used as validation set to test the remaining nine, combining the results to an overall average metric. We used CFS to estimate correlation between subset of attributes and outcomes, as well as inter-correlations between the attributes (Karegowda, Manjunath and Jayaram Citation2010). Distinguishing the most important associations provided the basis of constructing the BN graphical models.
Data split and balancing
The datasets are split into training (60%) and validation sets (40%) randomly. Most instances in the training dataset correspond to no effect outcomes for the majority of the endpoints. Imbalanced datasets can limit the performance of most classification algorithms, making the prediction biased to the dominant class value (Ha et al. Citation2018). To avoid this, we adjusted the relative frequency of triggered/no effect instances by resampling the second dataset by applying SMOTE (Synthetic Minority Oversampling Technique), a supervised instance algorithm that oversamples the minority instances using the k-nearest neighbors algorithm (Chawla et al. Citation2002).
Bayesian networks
A BN is a directed acyclic graphical model that represents variables as ‘nodes’ and their connections as arrows. Each arrow signifies a conditional dependence of the child node to a parent node. The network as a whole represents the joint probability distribution of included variables and use Bayes’ Rule to update conditional probabilities given new data (Zabinski et al. Citation2016; Zabinski, Pieper and Gibson, Citation2017; Friedman et al. Citation2000). The network is practically defined by its graphical structure and the corresponding trained conditional probabilities of the included variables. The probability distribution of all nodes is specified by the product of all conditional probability tables (CPTs) in the BN model as shown in EquationEquation (1)
(1)
(1) , where
is parent of node
and
a conditional probability distribution.
(1)
(1)
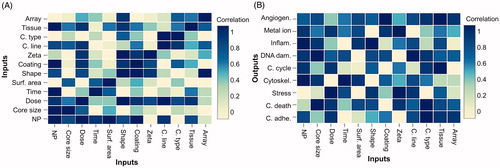
CFS results between all variables in the dataset (input and output) included inter-relationships between the outputs. A model that would have outcome-to-outcome links would fail to predict the outcomes only from new inputs and therefore would be biased to the prediction of other effects. Applying CFS for each biological effect of the PD dataset separately reveals the association (predictive ability) of each input attribute (all cases of the final PD dataset) for the specific effect (). Based on that, we constructed the links that associate input features as parents to the cellular effects enabling the BN model to predict the effects solely from the inputs.
Figure 3. Results of 10-fold cross-validation Correlation Feature Selection algorithm applied in processed dataset. (A) Inter-relationship of input variables, (B) relationship between the input and output variables.
Another BN structure is derived automatically by WEKA using the K2 algorithm (Gámez, Mateo and Puerta Citation2011). Bayesian rules, such as the K2 algorithm, build a different BN structure for each output by changing both probabilities and links between the inputs and the outputs. K2 algorithm is a score-based algorithm in BN which finds the structure that maximizes the score (Lerner and Malka Citation2011).
Model validation
Training sets were used for the internal validation of the BNs. The internal validation was performed using a 10-fold cross-validation process which valuated the predictive classifiers by partitioning the original dataset into a ‘training set’ and a ‘test set’. Cross-validation is a standard way to obtain unbiased estimates of a model's goodness of fit. In our case we used 10 subsamples as training data where a single subsample is retained as the validation data. The external validation set (40% of the whole dataset) was used to evaluate the predictive performance ability of the trained model (Raies and Bajic Citation2016). In addition to the external validation dataset, a reliability validation set (four studies) was used with data from studies that were not included in the previous training and validation datasets. Matthews Correlation Coefficient metric is also calculated (Matthews Citation1975).
Important attribute analysis
Variable (attribute) importance can be measured relatively, based on information obtained from the model (Choi et al. Citation2018). We quantified the importance of a feature for classification using information entropy (Doshi and Chaturvedi Citation2014; Nguyen, Petrović and Franke Citation2010; Fan et al. Citation2011) which is a measure of uncertainty of a random variable and defined as:
(2)
(2)
where,
is the entropy of variable X and
is the prior probabilities for the ith value of X. The entropy of X after observing values of another variable Y is defined as
(3)
(3)
where,
is the posterior probabilities of X when values of Y are given.
The amount by which the entropy of X decreases reflects an addition of information about X provided by Y. The reduction of entropy is called information gain and can be defined as:
(4)
(4)
where,
is the information gain of variable X due to entropy decrease provided by variable Y.
In order to evaluate the relevant importance of every input to each output we normalized IG for each effect using min-max normalization (Priddy and Keller Citation2005). The input with the lowest IG, that is, the one with the least influence on the model outcome prediction is zeroed and the most influential attribute scores 1.
Results
Data pre-processing
Information in raw dataset (RD) on the specific surface area (SSA) was not available in 98% of the 245 cases (rows at the datasheet); the presence of impurities in the bulk form or in the coating was not defined in approximately 88%. In 29% of cases, no information about the zeta potential was given, and in 75% of cases, there were no shape descriptors included. Of the various attributes relevant to particle toxicity, primary particle size was the only value consistently reported. More generally, information on physicochemical properties was scarce whereas, exposure (dose and duration) and in vitro conditions, such as cell line, cell type and microarray protocol, were always reported. In relation to the NPs evaluated in the studies extracted, the most common were: Ag (16.3%), Au (18.2%), TiO2 (17.1%) and ZnO (47.2%). Other NPs appeared (CuO, SiO2, Fe2O3, etc.) in less than 2%.
The PD consisted of 245 instances (rows) of 12 inputs and 9 outputs as columns (). Processed Dataset (PD) had 8% (RD: 75%) of shape missing, 9% (RD: 29%) of zeta potential missing and 5% (RD: 98%) of SSA missing. Reliability dataset was comprised of 19 instances. The PD and reliability datasets are available at (Furxhi Citation2019).
Data analysis
The relationships between the inputs in the PD dataset are shown in and the relationships of each outcome individually to the inputs are shown in . In both cases, attributes showing the most robust correlation (association 0.9–1) are selected as parents to the respective variable (node).
These input relationships allow us to manually construct the part of the model that is fixed for all outcomes. We build the prediction model by relating each output to the fixed input structure, excluding inter-relationship of outputs that would interfere with the results, which enables the ability to obtain various toxicological outcomes using one prediction model.
Bayesian structure
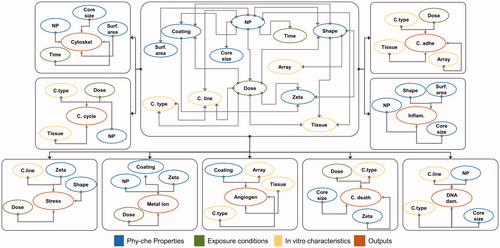
Two BN graphs were constructed on the basis of the results of the Correlation Feature Selection (CFS) algorithm which reveals significantly associated variables that as nodes, can be linked in a parent–child relationship. We constructed BNs nodes and links that represent the associations only between the inputs based on the results of CFS ( center). Each output is linked with the input nodes ( peripheral).
Figure 4. Graphical structure of the BN-PD model. Center: Structure based on correlation between the inputs. Perimeter: BN-PD structures based on output prediction ability of inputs.
Validation of the BNs
The classification performance of the three models, BN-PD, BN-RD and BN-K2, are shown in as the classifier accuracy, sensitivity and Matthewss correlation coefficient (MCC). Accuracy shows how many instances are correctly classified by the model compared to the total number of instances. Sensitivity demonstrates the classifiers’ ability to predict the triggered instances. MCC is a correlation coefficient between target and predictions. It varies between −1 and +1, lowest values indicating disagreement between actuals and prediction. It is frequently used to measure quality of binary classifications.
Figure 5. Accuracy of the classifiers. The validation of the models is carried out for each cellular effect separately. (A) Internal validation using a 10-fold cross-validation process with the training 60% datasets. (B) External validation using the validation 40% datasets. (C) Reliability validation using the reliability dataset. BN-PD: BN constructed from pre-processed dataset; BN-K2: BN automated constructed using K2-algorithm; BN-RD: BN constructed from raw dataset.
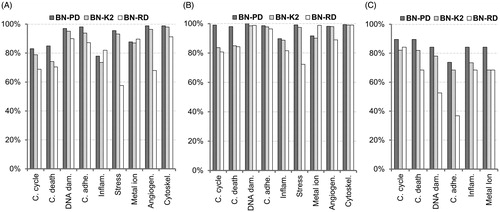
Figure 6. Sensitivity of the classifiers. The validation of the models is carried out for each cellular effect separately. (A) Internal validation using a 10-fold cross-validation process with the training 60% datasets. (B) External validation using the validation 40% datasets. (C) Reliability validation using the reliability dataset. BN-PD: BN constructed from pre-processed dataset; BN-K2: BN automated constructed using K2-algorithm; BN-RD: BN constructed from raw dataset.
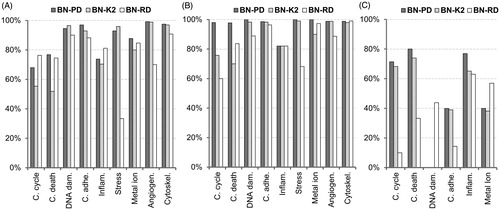
Figure 7. Matthews correlation coefficient of the classifiers. The validation of the models is carried out for each cellular effect separately. (A) Internal validation using a 10-fold cross-validation process with the training 60% datasets. (B) External validation using the validation 40% datasets. (C) Reliability validation using the reliability dataset. BN-PD: BN constructed from pre-processed dataset; BN-K2: BN automated constructed using K2-algorithm; BN-RD: BN constructed from raw dataset.
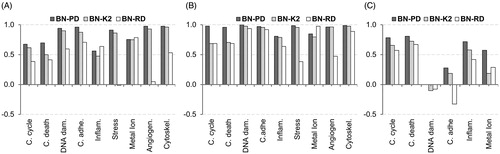
MCC is a correlation coefficient between target and predictions. It generally varies between −1 and +1. −1 when there is perfect disagreement between actuals and prediction, 1 when there is a perfect agreement. It can be more appropriate when negatives actually mean something and it is frequently used to measure quality of binary classifications.
BN-PD showed the highest accuracy for all but one of the cellular effects in internal, external and reliability validation (). Model performance improved when data preprocessing was implemented in the second dataset (BN-PD versus BN-RD). BN-PD also had higher performance compared to the automatically structured BN (BN-K2) in all of the cases. BN-RD had a higher accuracy in the case of inflammation (Inflam.) and metal ion responses in internal validation compared to the other two classifiers (). In addition, it had higher accuracy in the external validation in the case of metal ion responses (). Regarding the reliability dataset, BN-PD showed higher predictive capability than the other classifiers (). In general, data-driven approach structure performed better compare to BN-RD and BN-K2.
BN-PD showed the highest sensitivity for most of the cellular effects in internal, external and reliability validation () with model performance improved when data pre-processing was implemented in the second dataset (BN-PD). BN-PD also had higher performance compared to the automatically structured BN (BN-K2) in almost all of the cases. BN-RD had better sensitivity in cell cycle and inflammatory responses at internal validation, whilst BN-K2 had better sensitivity in DNA damage (DNA dam.), unfolded protein and endoplasmatic reticulum (Stress) responses (). BN-RD sensitivity scored higher compared to BN-K2 in predicting cell death (C. death), metal ion and cytoskeleton organization (Cytoskel.) responses in the external validation process (). Regarding the reliability dataset, BN-PD showed higher predictive capability than the other classifiers (). However, as shown in the sensitivity reliability graph (C), BN-RD predicted the triggered instances for DNA damage (DNA dam.) responses, while the other BNs failed to predict any.
BN-PD data-driven approach structure also had higher MCC performance compared to the BN-K2 and BN-RD (). BN-PD outperformed the other classifiers in MCC metric in internal, external and reliability validation. BN-RD model had higher MCC score in the case of inflammation (Inflam.) and metal ion responses in internal validation () compared to the other two classifiers and higher MCC in metal ion responses in external validation (). Regarding the reliability dataset, BN-PD showed higher predictive capability than the other classifiers (). Even for DNA damage (DNA dam.) responses BN-PD is zero compared to negative (worse) performance of BN-RD and BN-K2.
In summary, BN-PD that fully accounts for the CFS correlations had an aggregate predictive performance of >80% in most of the cases and outperformed the BNs that do not used either predefined structure, gap filling or data balancing.
Important attribute analysis
In conducting the important attribute analysis, it was found that exposure dose was the most influential attribute (IG = 1) that affected all outcomes significantly. Unfolded protein and endoplasmatic reticulum stress responses (Stress) were most influenced by NP which, given the classification of some NPs, relates to composition. Attributes such as NP and cell line ranked after dose as important attributes (0.25–0.82) while coating (0.59) strongly effected cytoskeleton organization (Cytoskel.) responses although coating appeared influential in most of the outcomes. Array and tissue occurred in top five determinants in four out of nine outcomes. Exposure duration (time) was influential on cytoskeleton organization, angiogenesis (Angiogen.) and DNA damage and repair (DNA dam.) responses. (0.14–0.31). Zeta potential appeared only in metal ion and unfolded protein (Stress) responses scoring 0.12 and 0.44, respectively. Surface area appeared solely in angiogenesis responses (0.27). Similarly, cell type occurred only in DNA damage and repair responses (0.25). Shape had the smallest information gain to the outcomes compared to the other four most influential input attributes. The input data represented low aspect ratio NPs therefore cannot address fibre-type NP effects nor can be used yet to perform a proper evaluation of how shape differentiates toxicological outputs. Primary particle size showed relatively insignificant influence to the prediction of the outcomes.
In summary, dose, NP composition and cell line had the foremost influences. Array, coating, exposure duration and tissue had notable influences. Zeta, cell type and surface area influenced some outcomes distinctively. Shape and core size in the given set of attributes had the least influence in discriminating the outcome classes. The results of normalized information gain analysis are presented in .
Table 2. Normalized information gain for each model outcome (bold) by input attributes. Only the top five most influential attributes are shown.
Discussion
In this study, we describe the application of a BN approach to assess the relationship between in vitro wide-genome transcriptomic outcomes in various cellular models and exposure to different NPs. This requires the integration of biological outcomes (possible markers of toxicity) with physicochemical NP properties, exposure conditions and in vitro model characteristics. The BN model predicts a number of biological effects at cellular level with a predictive capability exceeding 80% based on data derived solely from the literature. Given the vagaries of reporting within the literature, this predictive capability is noteworthy and may be improved further with greater harmonization.
Bayesian network constructs can combine expert knowledge and data-driven modeling (Seixas et al. Citation2014; Velikova et al. Citation2013). Using an intermediate feature selection step before constructing and applying the BN model provides insight into the dataset under investigation and guides model development. Feature selection as a classifier prestep analysis has been implemented in several studies (Hall and Smith Citation1998; Drugan and Wiering Citation2010; Chormunge and Jena Citation2018; Cinicioglu and Büyükuğur Citation2014). In this study, we derive and compare two pre-structure BN based on CFS results (BN-PD and BN-RD) and show that using pre-processed data enhances the classifier accuracy (BN-PD). We compare the CFS-based BN-PD to an automatically derived BN structure using the K2-algorithm (BN-K2); the former performs better suggesting, manual BN structuring based on statistical correlation is optimum. In conclusion, predefined discretized ranges, gap filling and class balancing improves classifier prediction ability.
Previous studies have listed characteristics for aggregated hazard ranking of NMs to investigate the relationship between NMs properties and adverse effects (Marvin et al. Citation2017; Choi et al. Citation2018; Sheehan et al. Citation2018). In this study, artificial nodes of cumulative indices, such as hazard node derived from all the outputs were not included in the BN structure. This allows analysis and validation of the model for each cellular effect individually. In agreement with our findings, Marvin et al. (Citation2017) found that coating plays a significant role in most biological effects such as inflammation and genotoxicity (DNA dam.). From a biological perspective, this would be expected as coating may serve to modify surface properties (e.g. charge, hydrophobicity) and biological interactions with poorly soluble particles occurs at the surface interface. Sheehan et al. (Citation2018) performed a comparative study investigating the efficacy of quantitative Weight of Evidence and Bayesian methodologies in ranking the potential hazard and found particle size, surface coating, administration route and surface charge to have significant influence on the toxicological outcomes depending on the NP. These are all contributors also found to have significant impact on the relative toxicity of particles in a pulmonary inflammation review of in vivo studies (Braakhuis et al. Citation2014). In our study, zeta potential (surface charge) and tissue (administration route) have a significant influence, but size does not significantly affect the prediction of the molecular biological effects compared to the other attributes. The former is expected as zeta-potential is associated with respiratory toxicity (Cho et al. Citation2012) and different tissues show different senstivities towards NPs. In a study of 15 different metal oxide NPs, Cho et al. (Citation2012) found that zeta potential was a key physicochemical influencer of respiratory toxicity in vivo. How size variation alone affects the prediction of outcomes can only be seen if the other effects are filtered out by means of a sensitivity analysis (out of the scope of this study). Studies report the effect of particle size on whole-genome gene expression (Bouwmeester et al. Citation2011; van der Zande et al. Citation2016; Grzincic et al. Citation2015). Particle size in terms of agglomeration state and/or primary particle size may change during a toxicity test (biological matrices) or during the life cycle due to dissolution or interaction with test media (Worth et al. Citation2017). In principle, the approach presented here can correlate different set of properties, quantitative exposure metrics, including in vitro characteristics with the toxicity pathways that NPs may trigger and accounting also for secondary effects.
Including exposure conditions, such as dose and duration, can improve the classification quality as this information is always reported in toxicological studies. Aggregating exposure features not readily comparable in one attribute, for example, exposure doses for different tissues, could reduce the biological accuracy of the model. This is compensated in our study by including tissue as an extra model input attribute. Exposure dose was identified as the most important determinant for most effects in the model, which is in concordance with the cornerstone of toxicology, the dose–response relationship. Such findings were also commensurate with QSAR as Choi et al. (Citation2018) found that dose was the most important attribute when looking at cell viability using neural network QSARs. They reported formation entropy as the second most important attribute which strongly relates to NP in our model. Exposure dose here was clearly an important determinant for toxicity as it is used as a surrogate of delivered (tissue) dose. Tissue dose data from in vitro and in vivo studies could be equivalently combined in the dataset. However, tissue doses are widely overlooked in both in vivo and in vitro studies (Schmid and Cassee Citation2017), and thus, data from both approaches cannot be readily integrated in one toxicity classification dataset. Reporting and use of delivered dose will refine outputs, particularly where in vitro and in vivo data form base datasets for wider use in risk assessment.
The relative information gain (IG) analysis also showed a variety of other output categories which show agreement in terms of attribute importance with in vitro and in vivo studies as summarized below:
Angiogenesis regulation responses (e.g. disruption in vascular endothelial growth factor, sprouting or angiopoietins) depend strongly on NP, exposure dose and duration (Bartczak et al. Citation2013; Mukherjee Citation2018);
Cell adhesion and extracellular matrix responses (e.g. disrupted genes involved in cell–cell junction, morphology, movement, migration or structure) are determined by the exposure dose as also described in (Septiadi et al. Citation2018), NP and tissue (Ahmad Khalili and Ahmad Citation2015; Engin et al. Citation2017).
Cell cycle and proliferation pathway responses (e.g. disrupted genes involved in cell differentiation, division, growth, mitosis progression or cytokinesis perturbation) are influenced by NP, exposure dose and cell line (0.32), in agreement with other studies (Huang, Cambre and Lee, Citation2017; Hussain et al. Citation2014).
Cell death and apoptosis (e.g. mitochondrial fragmentation/apoptosis, phosphorylation of p53, death receptor, cleavage of caspase and PARP pathways) processes are highly determined by exposure dose and in vitro characteristics such as cell line and tissue (Ma and Yang Citation2016; De Stefano, Carnuccio and Maiuri Citation2012).
Cytoskeleton organization (e.g. disrupted genes involved in cell matrix, microtubule, actin polymerization, cytokinesis or signal transduction) responses depend on NP and exposure dose (Kang et al. Citation2016; Soenen et al. Citation2010).
In vitro characteristics (cell line and cell type) influence DNA damage and repair (e.g. disrupted genes involved in oncogenesis, histone or chromatin binding, replication, base excision, mismatch, chromosome damage or segregation) responses that depend strongly on exposure dose (Singh et al. Citation2017).
In terms of accuracy of prediction, BN-PD had marginally lower accuracy predicting metal ion responses compared to BN-RD in internal and external validation. CFS with the RD revealed that metal ion response is strongly associated with in vitro characteristics (data not shown), whereas it has poor correlation in the PD case (). PD CFS and information gain agree with regards to metal ion dependencies where NP and zeta inputs have strong influence whilst BN-RD has higher accuracy with none of these attributes as parent-inputs to the class (Furxhi et al. Citation2018). Biologically one would anticipate NP to be of primary importance as metal ion responses are dependent on the presence of metal ions (i.e. metal or metal oxide NPs) (Saliani, Jalal and Kafshdare Goharshadi Citation2016; Poynton et al. Citation2012). Moreover, cell line/type and tissue would be expected to show strong associations owing to varying expression of, for example thiol rich, binding proteins.
BN-PD had zero MCC score concerning DNA dam. responses and BN-K2, BN-RD had negative scores. Reliability dataset has three triggered cases for DNA dam., corresponding to ZnONPs and A549 cell line. On the contrary, training dataset has no triggered cases, to either ZnONPs or A549 cell lines. In BN-PD () DNA dam. is apparently affected from cell line, cell type, dose and NP. Cell line and NP information gain score was 0.59 and 0.43, respectively (). There is no link of the values of these two significant attributes to triggered DNA dam. in the training dataset that makes the reliability dataset triggered cases impossible to predict from BN-PD. More data would compensate this issue.
Several microarray protocols were followed in the studies considered yet despite this, intra-laboratory microarray results are comparable (Bammler et al. Citation2005; Schneider and Orchard Citation2011). Microarray protocol (Array node) in a real scenario does not contribute to the change of the toxicity. However, the classifier precisely predicts the outcomes of cell adhesion and extracellular matrix responses or angiogenesis responses based on array information gain (0.14 and 0.37, respectively) interrelating dose and NP with array through shape at the Bayesian structure ().
A further challenging issue relates to inflammatory and immune responses. Within the analysis, these outcomes depended strongly on exposure dose and in vitro characteristics consequently masking the role of physicochemical properties in inflammation. This is expected when considering that different cell types (e.g. glioblastoma vs. keratinocyte) and cell lines (e.g. primary vs. immortalized) exposed to the same NP can express markedly different cytokine levels and inflammatory profiles.
NPs can cause very overt signs of toxicity (e.g. cell death), especially at higher and often non-physiological doses, that are easy to detect yet they may also cause much more muted disruption of cellular functions at the molecular level. Such small perturbations do not necessarily result in adverse effects in vitro or in vivo (Sauer et al. Citation2017) or may be part of a wider sequence of events whereby small perturbations can produce large, non-linear effects on a complex system such as an organ or whole organism (Gonzalez-Diaz et al. Citation2013). By their very nature, small perturbations require targeted forms of analysis to detect, that in itself requires knowledge of the wider adverse outcome pathway(s) for which there are still relatively few in nanotoxicology. Alternatively, high content analysis such as omics can provide the breadth and sensitivity to detect small early changes although again identifying and understanding the link between small perturbations and complex disease endpoints remains a challenge for NP. Future studies expanding BN applicability may incorporate differentiated expression gene values (fold change) to predict the NP hazard in a quantitative manner by linking genes probabilistically with apical endpoint (diseases) such as Alzheimer’s (Alexiou et al. Citation2017), cancer (Achcar, Brookmeyer and Hunter Citation1985) or diabetes (Sangi et al. Citation2015). Inclusion of molecular events, defining states, association assessment and integration in the BN graph are steps to be considered in future model development. To date, limited data exist for proteomics and metabolomics for NPs. Transcriptomics is a well-established technique with high intra-array reproducibility (Fröhlich Citation2017) but provides only a list of genes associated with a pathway. Future integration of other omics data (multi-omics) will elucidate the potential causative changes that lead to an adverse effect and will lead to an advance in the field of nanotoxicology (Hasin, Seldin and Lusis, Citation2017, Shin et al. Citation2018).
The flexibility of BNs to missing or additional generated data allows the increase of predictive ability as the data become available or data quality increases. In addition, BNs are used in data-poor environments which fits in our case of a small set of publicly available microarray gene expression human in vitro studies. Another advantage is that BNs are understandable as a result of their graphical representation, thus they are used both as predictive and descriptive models allowing a great accessibility to the tool (Murphy et al. Citation2016). A detailed comparison of BN advantages with other modeling approaches in performing classification may be found in (Zabinski Citation2017). In this study we include exposure conditions and in vitro characteristics as model inputs, integrating quantitative metrics and study characteristics to biological effects. As more experimental data becomes available, the model can be extended to provide additional predictions. Biological phenotypic outcomes, for example based on in vitro or/and in vivo testing could be incorporated to the model to link inputs with perturbations (Key Events) and phenotypic changes (apical effects) (Hasin, Seldin and Lusis, Citation2017; Bañares et al. Citation2017). Such prediction can be used to prioritize NPs for further toxicological testing (Chepelev et al. Citation2015; Labib et al. Citation2016). Our data focus on human cell lines to minimize the loss of relevant biological information. The use of cell lines does not represent the biological complexity and thereby cannot represent the full response in the whole organism (Sahu et al. Citation2015). However, the complexity of the in vitro model can be enhanced by using co-cultures reducing the need for in vivo models (Bouwmeester et al. Citation2011, Snyder-Talkington et al. Citation2015) or use of organo-typic models such as precision cut lung slices (Hess et al. Citation2016) which combines the complexity of in vivo systems with the efficiency of in vitro models and reduced animal number. It is worth to mention that in vitro models can efficiently capture the complex molecular functions altered in vivo as demonstrated in (Kinaret et al. Citation2017; Zhang et al. Citation2016).
The model proposed here could benefit from studies that report ‘no observed transcriptomics adverse effect level’ (NOTEL). For example, Bajak et al. (Citation2015) found that exposure of 5 and 30 nm Au NPs to Caco-2 cell line for 24 and 72 h respectively did not disturb any gene. Such numeric attributes, used as a benchmark of effects, would provide a valuable output in the established model increasing the model precision and applicability to different stakeholders. Information on physicochemical properties was scarce as seen above, thus future studies should include a detail characterization of the NPs physicochemical properties that are considered relevant to hazard identification such as surface properties, chemical composition, shape, aggregation status etc. Most of the studies gathered tested NPs at an exposure duration of 24 to 48 hours. A longer exposure may show the adaptive mechanisms at the molecular level and allow the determination of adverse versus the reversible effects. Detailed considerations for in vitro testing of NPs which should increase reliability and relevance is mentioned elsewhere (Drasler et al. Citation2017). The integration of in vitro and in vivo studies in one dataset poses challenges beyond this study. In vivo studies were excluded from this study because a harmonized exposure metric system is needed to transpose in vivo exposure dose to a quantity compatible to the target tissue dose (biologically effective dose) of in vitro studies (Riviere Citation2009; Li and Huang Citation2008). A PBPK model can be used to estimate the concentration of NPs in target tissue (Judson et al. Citation2011; Li and Reineke Citation2012), and therefore, incorporating a PBPK model to the BN model framework described here could be investigated to combine data from in vivo and in vitro studies (in vitro-to-in vivo extrapolation). Furthermore, using PBPK model can permit the route-to-route and species-to-species (e.g., animal-to-human) extrapolations (Raies and Bajic Citation2016). A detailed review of available PBPK models can be found at the supplementary material in the final technical report of Nanocomput project (Worth et al. Citation2017).
QSTR-perturbation models have dealt also with relatively small datasets of cases, while combining multiple endpoints, experimental conditions and toxicities/activities (Concu et al. Citation2017; Speck-Planche Citation2015). There are three ways that approach could be fused to our study: The dataset in this study can be preprocessed and modeled using the QSTR-perturbation model of Concu et al. (Citation2017); the Concu et al. (Citation2017) dataset can go through the CFS and BN construction and preprocessing stages to be modeled by BNs; finally, a BN can be used to model the QSTR final classification function, instead of the ANN used (Concu et al. Citation2017).
The BN model approach, as demonstrated here has enormous potential for the advancement of prescreening of NPs as part of risk characterization as well as the wider materials development process. In a broad context, improved screening can be foreseen as the ability to screen large candidate data sets based on physicochemical data to identify possible concerns. Considering this approach, BN models may be employed to screen combination of attributes to identify which values of the attributes lead to toxicity. This could be in the form of physicochemical data generated through testing of actual materials such as is required during regulatory activities (e.g. REACH registration) or screening of candidate designs prior to the development of prototype materials. The ultimate goal here is to reduce the burden of toxicological testing, especially in higher organisms to align with the 3R’s of toxicological evaluations and improve efficiency (time and money) between concept and commercial product.
Conclusions
NPs have entered mainstream production supply chains, while at the same time the risks of these new materials for humans and for the environment remains to be fully understood, not least when considering the long term effects of chronic exposure. Early-stage nanotoxicity measurements represent a challenge, not least when attempting to predict adverse outcomes and modeling is critical to understanding the biological effects of exposure to NPs. In this study, we demonstrate a novel approach to predict the molecular effects of NPs on human cells by using a variety of inputs such as physicochemical properties, exposure conditions and in vitro characteristics. To this end, we employ a machine learning algorithm, Bayesian networks, to afford a better understanding of how these inputs can predict normal cell function disturbance after exposure to NPs in vitro. The BN successfully predicted a number of disrupted biological pathways associated with NP properties which reflect drivers of toxicity determined also experimentally, such as zeta-potential and surface coating, in vitro and in vivo. Model structure based on statistical associations between input attributes and outputs has considerable biological relevance. The results show that appropriate pre-processing techniques should be applied before implementing a BN. It allows researchers to obtain various toxicological outcomes through one prediction concept and prioritize in vitro experimental set-ups. In summary, BN-PD that fully accounts for the CFS correlations has an aggregate predictive performance of >80%, in most of the cases and outperforms the BNs that do not use either predefined structure, gap filling or data balancing. The biggest challenge in any model development is the lack of sufficient homogenous experimental data. BNs predictability improves with additional data over time. Future integration of data confirming molecular events with phenotypic changes will allow the model presented to quantitatively determine the risk posed from exposure to NPs which can then be extrapolated to humans. The model validation shows a robust and promising methodology for incorporating transcriptomic findings in hazard and risk assessment modeling framework.
Supplemental Material
Download MS Excel (59.3 KB)Acknowledgements
Not applicable.
Disclosure statement
No potential conflict of interest was reported by the authors
Data availability statement
The data that support the findings of this study are available at (Furxhi Citation2019).
Additional information
Funding
Related Research Data
References
- Achcar, J. A., R. Brookmeyer, and W. G. Hunter. 1985. “An Application of Bayesian Analysis to Medical Follow-up data.” Statistics in Medicine 4 (4): 509–520.
- Ahmad Khalili, A., and M. R. Ahmad. 2015. “A Review of Cell Adhesion Studies for Biomedical and Biological Applications.” International Journal of Molecular Sciences 16 (8): 18149–18184. doi:10.3390/ijms160818149.
- Ajdary, M., M. Moosavi, M. Rahmati, M. Falahati, M. Mahboubi, A. Mandegary, S. Jangjoo, R. Mohammadinejad, and R. Varma. 2018. “Health Concerns of Various Nanoparticles: A Review of Their in Vitro and in Vivo Toxicity.” Nanomaterials 8 (9): 634.
- Alexiou, A.,. V. D. Mantzavinos, N. H. Greig, and M. A. Kamal. 2017. “A Bayesian Model for the Prediction and Early Diagnosis of Alzheimer's Disease.” Frontiers in Aging Neuroscience 9 (77).
- Bai, X., F. Liu, Y. Liu, C. Li, S. Wang, H. Zhou, W. Wang, H. Zhu, D. A. Winkler, and B. Yan. 2017. “Toward a Systematic Exploration of Nano-Bio Interactions.” Toxicology and Applied Pharmacology 323: 66–73. doi:10.1016/j.taap.2017.03.011.
- Bajak, E., M. Fabbri, J. Ponti, S. Gioria, I. Ojea-Jiménez, A. Collotta, V. Mariani, D. Gilliland, F. Rossi, and L. Gribaldo. 2015. “Changes in Caco-2 Cells Transcriptome Profiles upon Exposure to Gold Nanoparticles.” Toxicology Letters 233 (2): 187–199. doi:10.1016/j.toxlet.2014.12.008.
- Bammler, T., R. P. Beyer, S. Bhattacharya, G. A. Boorman, A. Boyles, B. U. Bradford, R. E. Bumgarner, et al. 2005. “Standardizing Global Gene Expression Analysis between Laboratories and across Platforms.” Nature Methods 2: 351–356.
- Bañares, M. A., A. Haase, L. Tran, V. Lobaskin, G. Oberdörster, R. Rallo, J. Leszczynski, et al. 2017. “CompNanoTox2015: novel Perspectives from a European Conference on Computational Nanotoxicology on Predictive Nanotoxicology.” Nanotoxicology 11 (7): 839–845. doi:10.1080/17435390.2017.1371351.
- Bartczak, D., O. L. Muskens, T. Sanchez-Elsner, A. G. Kanaras, and T. M. Millar. 2013. “Manipulation of in Vitro Angiogenesis Using Peptide-Coated Gold Nanoparticles.” ACS Nano 7 (6): 5628–5636. doi:10.1021/nn402111z.
- Belcastro, V., C. Poussin, Y. Xiang, M. Giordano, K. P. Tripathi, A. Boda, A. T. Balci, et al. 2018. “The Sbv IMPROVER Systems Toxicology Computational Challenge: Identification of Human and Species-Independent Blood Response Markers as Predictors of Smoking Exposure and Cessation Status.” Computational Toxicology 5: 38–51. doi:10.1016/j.comtox.2017.07.004.
- Boon, E. M. J., and B. H. W. Faas. 2013. “Benefits and Limitations of Whole Genome versus Targeted Approaches for Noninvasive Prenatal Testing for Fetal Aneuploidies.” Prenatal Diagnosis 33 (6): 563–568. doi:10.1002/pd.4111.
- Boué, S., T. Exner, S. Ghosh, V. Belcastro, J. Dokler, D. Page, A. Boda, et al. 2017. “Supporting Evidence-Based Analysis for Modified Risk Tobacco Products through a Toxicology Data-Sharing Infrastructure [Version 1; Referees: 1 Approved, 1 Approved with Reservations.” F1000Research 6.
- Bouwmeester, H., J. Poortman, R. J. Peters, E. Wijma, E. Kramer, S. Makama, K. Puspitaninganindita, et al. 2011. “Characterization of Translocation of Silver Nanoparticles and Effects on Whole-Genome Gene Expression Using an in Vitro Intestinal Epithelium Coculture Model.” ACS Nano 5 (5): 4091–4103. doi:10.1021/nn2007145.
- Braakhuis, H. M., M. V. Park, I. Gosens, W. H. De Jong, and F. R. Cassee. 2014. “Physicochemical Characteristics of Nanomaterials That Affect Pulmonary Inflammation.” Particle and Fibre Toxicology 11 (1): 18. doi:10.1186/1743-8977-11-18.
- Buesen, R., B. N. Chorley, B. da Silva Lima, G. Daston, L. Deferme, T. Ebbels, T. W. Gant, et al. 2017. “Applying 'omics Technologies in Chemicals Risk Assessment: Report of an ECETOC Workshop.” Regulatory Toxicology and Pharmacology 91: S3–S13. doi:10.1016/j.yrtph.2017.09.002.
- Cao, Y. 2018. The Toxicity of Nanoparticles to Human Endothelial Cells. In Cellular and Molecular Toxicology of Nanoparticles, edited by Q. Saquib, M. Faisal, A. A. Al-Khedhairy and A. A. Alatar. 59–69. Cham: Springer International Publishing.
- Carlander, U., D. Li, O. Jolliet, C. Emond, and G. Johanson. 2016. “Toward a General Physiologically-Based Pharmacokinetic Model for Intravenously Injected Nanoparticles.” International Journal of Nanomedicine 11: 625–640.
- Chawla, N. V., L. O. Hall, K. W. Bowyer, and W. P. Kegelmeyer. 2002. “SMOTE: Synthetic Minority Oversampling TEchnique.” Journal of Artificial Intelligence Research 16: 321–357. doi:10.1613/jair.953.
- Chen, G., M. G. Vijver, Y. Xiao, and W. J. G. M. Peijnenburg. 2017. “A Review of Recent Advances towards the Development of (Quantitative) Structure-Activity Relationships for Metallic Nanomaterials.” Materials 10 (9): 1013. doi:10.3390/ma10091013.
- Chepelev, N. L., I. D. Moffat, S. Labib, J. Bourdon-Lacombe, B. Kuo, J. K. Buick, F. Lemieux, et al. 2015. “Integrating Toxicogenomics into Human Health Risk Assessment: Lessons Learned from the Benzo[a]Pyrene Case Study.” Critical Reviews in Toxicology 45 (1): 44–52. doi:10.3109/10408444.2014.973935.
- Cho, W. S., R. Duffin, F. Thielbeer, M. Bradley, I. L. Megson, W. Macnee, C. A. Poland, C. L. Tran, and K. Donaldson. 2012. “Zeta Potential and Solubility to Toxic Ions as Mechanisms of Lung Inflammation Caused by Metal/Metal-Oxide Nanoparticles.” Toxicological Sciences 126 (2): 469–477. doi:10.1093/toxsci/kfs006.
- Choi, J. S., M. K. Ha, T. X. Trinh, T. H. Yoon, and H.-G. Byun. 2018. Towards a generalized toxicity prediction model for oxide nanomaterials using integrated data from different sources. Scientific Reports 8: 6110.
- Chormunge, S., and S. Jena. 2018. “Correlation Based Feature Selection with Clustering for High Dimensional Data.” Journal of Electrical Systems and Information Technology 5 (3): 542–549. doi:10.1016/j.jesit.2017.06.004.
- Cinicioglu, E. N., and G. Büyükuğur. 2014. How to Create Better Performing Bayesian Networks: A Heuristic Approach for Variable Selection. Cham: Springer International Publishing, 527–535.
- Concu, R., V. V. Kleandrova, A. Speck-Planche, and M. N. D. S. Cordeiro. 2017. “Probing the Toxicity of Nanoparticles: A Unified in Silico Machine Learning Model Based on Perturbation Theory.” Nanotoxicology 11 (7): 891–906. doi:10.1080/17435390.2017.1379567.
- De Stefano, D.,. R. Carnuccio, and M. C. Maiuri. 2012. “Nanomaterials Toxicity and Cell Death Modalities.” Journal of Drug Delivery 2012: 167896doi:10.1155/2012/167896.
- Doshi, M., and S. Chaturvedi. 2014. “Correlation Based Feature Selection (CFS) Technique to Predict Student Performance.” International Journal of Computer Networks & Communications 6: 197–206. doi:10.5121/ijcnc.2014.6315.
- Drasler, B., P. Sayre, K. G. Steinhäuser, A. Petri-Fink, and B. Rothen-Rutishauser. 2017. “In Vitro Approaches to Assess the Hazard of Nanomaterials.” NanoImpact 8: 99–116. doi:10.1016/j.impact.2017.08.002.
- Drugan, M. M., and M. A. Wiering. 2010. “Feature Selection for Bayesian Network Classifiers Using the MDL-FS Score.” International Journal of Approximate Reasoning 51 (6): 695–717. doi:10.1016/j.ijar.2010.02.001.
- Engin, A. B., D. Nikitovic, M. Neagu, P. Henrich-Noack, A. O. Docea, M. I. Shtilman, K. Golokhvast, and A. M. Tsatsakis. 2017. “Mechanistic Understanding of Nanoparticles’ Interactions with Extracellular Matrix: The Cell and Immune System.” Particle and Fibre Toxicology 14 (22).
- Fan, R., M. Zhong, S. Wang, Y. Zhang, A. Andrew, M. Karagas, H. Chen, C. I. Amos, M. Xiong, and J. H. Moore. 2011. “Entropy-Based Information Gain Approaches to Detect and to Characterize Gene-Gene and Gene-Environment Interactions/Correlations of Complex Diseases.” Genetic Epidemiology 35 (7): 706–721. doi:10.1002/gepi.20621.
- Franceschi, N., K. Paraskevopoulos, E. Waigmann, and M. Ramon. 2017. “Predictive Protein Toxicity and Its Use in Risk Assessment.” Trends in Biotechnology 35 (6): 483–486. doi:10.1016/j.tibtech.2017.03.010.
- Friedman, N., M. Linial, I. Nachman, and D. Pe'er. 2000. “Using Bayesian Networks to Analyze Expression Data.” Journal of Computational Biology: a Journal of Computational Molecular Cell Biology 7 (3-4): 601–620. doi:10.1089/106652700750050961.
- Fröhlich, E. 2017. “Role of Omics Techniques in the Toxicity Testing of Nanoparticles.” Journal of Nanobiotechnology 15 (1): 84doi:10.1186/s12951-017-0320-3.
- Furxhi, I. 2019. Literature transcriptomics review and data of Nanoparticle Induced Cellular Outcomes. Journal [Online] Available at: https://nanohub.org/resources/30099.
- Furxhi, I., F. Murphy, B. Sheehan, M. Mullins, and P. Mantecca. 2018. Predicting Nanomaterials toxicity pathways based on genome-wide transcriptomics studies using Bayesian networks. 2018 IEEE 18th International Conference on Nanotechnology (IEEE-NANO). 1–4.
- Gámez, J. A., J. L. Mateo, and J. M. Puerta. 2011. “Learning Bayesian Networks by Hill Climbing: efficient Methods Based on Progressive Restriction of the Neighborhood.” Data Mining and Knowledge Discovery 22 (1-2): 106–148. doi:10.1007/s10618-010-0178-6.
- George, J., R. Singh, Z. Mahmood, and Y. Shukla. 2010. “Toxicoproteomics: New Paradigms in Toxicology Research.” Toxicology Mechanisms and Methods 20 (7): 415–423. doi:10.3109/15376511003667842.
- Gerber, A., M. Bundschuh, D. Klingelhofer, and D. A. Groneberg. 2013. “Gold Nanoparticles: recent Aspects for Human Toxicology.” Journal of Occupational Medicine and Toxicology 8 (1): 32. doi:10.1186/1745-6673-8-32.
- Gerloff, K., B. Landesmann, A. Worth, S. Munn, T. Palosaari, and M. Whelan. 2017. “The Adverse Outcome Pathway Approach in Nanotoxicology.” Computational Toxicology 1: 3–11. doi:10.1016/j.comtox.2016.07.001.
- Gonzalez-Diaz, H., S. Arrasate, A. Gomez-SanJuan, N. Sotomayor, E. Lete, L. Besada-Porto, and J. M. Ruso. 2013. “General Theory for Multiple Input-Output Perturbations in Complex Molecular Systems. 1. Linear QSPR Electronegativity Models in Physical, Organic, and Medicinal Chemistry.” Current Topics in Medicinal Chemistry 13 (14): 1713–1741. doi:10.2174/1568026611313140011.
- González-Durruthy, M., L. C. Alberici, C. Curti, Z. Naal, D. T. Atique-Sawazaki, J. M. Vázquez-Naya, H. González-Díaz, and C. R. Munteanu. 2017. “Experimental–Computational Study of Carbon Nanotube Effects on Mitochondrial Respiration: In Silico Nano-QSPR Machine Learning Models Based on New Raman Spectra Transform with Markov–Shannon Entropy Invariants.” Journal of Chemical Information and Modeling 57 (5): 1029–1044. doi:10.1021/acs.jcim.6b00458.
- Grzincic, E. M., J. A. Yang, J. Drnevich, P. Falagan-Lotsch, and C. J. Murphy. 2015. “Global Transcriptomic Analysis of Model Human Cell Lines Exposed to Surface-Modified Gold Nanoparticles: The Effect of Surface Chemistry.” Nanoscale 7 (4): 1349–1362. doi:10.1039/C4NR05166A.
- Ha, M. K., T. X. Trinh, J. S. Choi, D. Maulina, H. G. Byun, and T. H. Yoon. 2018. Toxicity Classification of Oxide Nanomaterials: Effects of Data Gap Filling and PChem Score-based Screening Approaches. Scientific Reports 8: 3141.
- Hackley, V. A., G. Roebben, K. Ehara, S. Hankin, M. T. Postek, I. Lynch, W.-E. Fu, T. P. J. Linsinger, and A. F. Thünemann. 2013. “Nanoscale Reference Materials for Environmental, Health and Safety Measurements: needs, Gaps and Opportunities AU - Stefaniak, Aleksandr B.” Nanotoxicology 7: 1325–1337. doi:10.3109/17435390.2012.739664.
- Hall, M. A., and L. A. Smith. 1998. Feature Subset Selection: A Correlation Based Filter Approach. Department of Computer Science. Hamilton, New Zealand: University of Waikato.
- Hasin, Y., M. Seldin, and A. Lusis. 2017. “Multi-omics approaches to disease.” Genome Biology 18 (1): 83doi:10.1186/s13059-017-1215-1.
- Hess, A., L. Wang-Lauenstein, A. Braun, S. N. Kolle, R. Landsiedel, M. Liebsch, L. Ma-Hock, et al. 2016. Prevalidation of the ex-vivo model PCLS for prediction of respiratory toxicity. Toxicology in vitro: an international journal published in association with BIBRA 32: 347–361. doi:10.1016/j.tiv.2016.01.006.
- Hrdlickova, R., M. Toloue, and B. Tian. 2017. RNA-Seq methods for transcriptome analysis. Wiley interdisciplinary reviews RNA 8:10.1002/wrna.1364.
- Hristozov, D. R., A. Zabeo, C. Foran, P. Isigonis, A. Critto, A. Marcomini, and I. Linkov. 2014. “A Weight of Evidence Approach for Hazard Screening of Engineered Nanomaterials.” Nanotoxicology 8 (1): 72–87. doi:10.3109/17435390.2012.750695.
- Huang, Y. W., M. Cambre, and H. J. Lee. 2017. “The Toxicity of Nanoparticles Depends on Multiple Molecular and Physicochemical Mechanisms.” International Journal of Molecular Sciences 18 (12): 2702. doi:10.3390/ijms18122702.
- Hussain, S., S. Garantziotis, F. Rodrigues-Lima, J.-M. Dupret, A. Baeza-Squiban, and S. Boland. 2014. “Intracellular Signal Modulation by Nanomaterials.” Advances in Experimental Medicine and Biology 811: 111–134.
- Jagiello, K., M. Grzonkowska, M. Swirog, L. Ahmed, B. Rasulev, A. Avramopoulos, M. G. Papadopoulos, J. Leszczynski, and T. Puzyn. 2016. “Advantages and Limitations of Classic and 3D QSAR Approaches in nano-QSAR Studies Based on Biological Activity of Fullerene Derivatives.” Journal of Nanoparticle Research 18: 256.
- Jaworska, J.,. S. Gabbert, and T. Aldenberg. 2010. “Towards Optimization of Chemical Testing under REACH: A Bayesian Network Approach to Integrated Testing Strategies.” Regulatory Toxicology and Pharmacology 57 (2-3): 157–167. doi:10.1016/j.yrtph.2010.02.003.
- Jaworska, J.,. Y. Dancik, P. Kern, F. Gerberick, and A. Natsch. 2013. “Bayesian Integrated Testing Strategy to Assess Skin Sensitization Potency: From Theory to Practice.” Journal of Applied Toxicology 33: 1353–1364
- Judson, R. S., R. J. Kavlock, R. W. Setzer, E. A. Cohen Hubal, M. T. Martin, T. B. Knudsen, K. A. Houck, et al. 2011. “Estimating Toxicity-Related Biological Pathway Altering Doses for High-Throughput Chemical Risk Assessment.” Chemical Research in Toxicology 24 (4): 451–462. doi:10.1021/tx100428e.
- Kang, Y., J. Liu, B. Song, X. Feng, L. Ou, L. Wei, X. Lai, and L. Shao. 2016. “Potential Links between Cytoskeletal Disturbances and Electroneurophysiological Dysfunctions Induced in the Central Nervous System by Inorganic Nanoparticles.” Cellular Physiology and Biochemistry 40 (6): 1487–1505. doi:10.1159/000453200.
- Karegowda, A. G., A. S. Manjunath, and M. A. Jayaram. 2010. “Comparative Study of Attribute Selection Using Gain Ratio and Correlation Based Feature Selection.” International Journal of Information Technology and Knowledge Management 2: 271–277.
- Kawata, K., M. Osawa, and S. Okabe. 2009. “In Vitro Toxicity of Silver Nanoparticles at Noncytotoxic Doses to HepG2 Human Hepatoma Cells.” Environmental Science & Technology 43: 6046–6051. doi:10.1021/es900754q.
- Kinaret, P., V. Marwah, V. Fortino, M. Ilves, H. Wolff, L. Ruokolainen, P. Auvinen, et al. 2017. “Network Analysis Reveals Similar Transcriptomic Responses to Intrinsic Properties of Carbon Nanomaterials in Vitro and in Vivo.” ACS Nano 11 (4): 3786–3796. doi:10.1021/acsnano.6b08650.
- Kleandrova, V. V., F. Luan, H. González-Díaz, J. M. Ruso, A. Melo, A. Speck-Planche, and M. N. D. S. Cordeiro. 2014a. “Computational Ecotoxicology: Simultaneous Prediction of Ecotoxic Effects of Nanoparticles under Different Experimental Conditions.” Environment International 73: 288–294. doi:10.1016/j.envint.2014.08.009.
- Kleandrova, V. V., F. Luan, H. González-Díaz, J. M. Ruso, A. Speck-Planche, and M. N. D. S. Cordeiro. 2014b. “Computational Tool for Risk Assessment of Nanomaterials: Novel QSTR-Perturbation Model for Simultaneous Prediction of Ecotoxicity and Cytotoxicity of Uncoated and Coated Nanoparticles under Multiple Experimental Conditions.” Environmental Science & Technology 48: 14686–14694. doi:10.1021/es503861x.
- Kohavi, R., and G. H. John. 1997. “Wrappers for Feature Subset Selection.” Artificial Intelligence 97 (1-2): 273–324. doi:10.1016/S0004-3702(97)00043-X.
- Labib, S., A. Williams, C. L. Yauk, J. K. Nikota, H. Wallin, U. Vogel, S. Halappanavar. 2016. “Nano-Risk Science: application of Toxicogenomics in an Adverse Outcome Pathway Framework for Risk Assessment of Multi-Walled Carbon Nanotubes.” Particle and Fibre Toxicology 13: 15.
- Lerner, B., and R. Malka. 2011. “Investigation of the K2 Algorithm in Learning Bayesian Network Classifiers.” Applied Artificial Intelligence 25 (1): 74–96. doi:10.1080/08839514.2011.529265.
- Li, M., and J. Reineke. 2012. Physiologically Based Pharmacokinetic Modeling for Nanoparticle Toxicity Study. In: Nanotoxicity: Methods and Protocols, edited by J. Reineke. 369–382. Totowa, NJ: Humana Press.
- Li, S.-D., and L. Huang. 2008. “Pharmacokinetics and Biodistribution of Nanoparticles.” Molecular Pharmaceutics 5 (4): 496–504. doi:10.1021/mp800049w.
- Lin, E., and H. Y. Lane. 2017. “Machine Learning and Systems Genomics Approaches for Multi-Omics Data.” Biomarker Research 5: 2. doi:10.1186/s40364-017-0082-y.
- Luan, F., V. V. Kleandrova, H. González-Díaz, J. M. Ruso, A. Melo, A. Speck-Planche, and M. N. D. S. Cordeiro. 2014. “Computer-Aided Nanotoxicology: assessing Cytotoxicity of Nanoparticles under Diverse Experimental Conditions by Using a Novel QSTR-Perturbation Approach.” Nanoscale 6 (18): 10623–10630. doi:10.1039/C4NR01285B.
- Luechtefeld, T., D. Marsh, C. Rowlands, and T. Hartung. 2018. “Machine Learning of Toxicological Big Data Enables Read-Across Structure Activity Relationships (RASAR) Outperforming Animal Test Reproducibility.” Toxicological Sciences 165 (1): 198–212. doi:10.1093/toxsci/kfy152.
- Ma, D. D., and W.-X. Yang. 2016. “Engineered Nanoparticles Induce Cell Apoptosis: potential for Cancer Therapy.” Oncotarget 7: 40882–40903.
- Marchese Robinson, R. L., I. Lynch, W. Peijnenburg, J. Rumble, F. Klaessig, C. Marquardt, H. Rauscher, et al. 2016. “How Should the Completeness and Quality of Curated Nanomaterial Data Be Evaluated?.” Nanoscale 8: 9919–9943. doi:10.1039/C5NR08944A.
- Marvin, H. J. P., Y. Bouzembrak, E. M. Janssen, M. van der Zande, F. Murphy, B. Sheehan, M. Mullins, et al. 2017. “Application of Bayesian Networks for Hazard Ranking of Nanomaterials to Support Human Health Risk Assessment.” Nanotoxicology 11 (1): 123–133. doi:10.1080/17435390.2016.1278481.
- Matthews, B. W. 1975. “Comparison of the Predicted and Observed Secondary Structure of T4 Phage Lysozyme.” Biochimica et Biophysica Acta (BBA) - Protein Structure 405 (2): 442–451. doi:10.1016/0005-2795(75)90109-9.
- McDermott, J. E., J. Wang, H. Mitchell, B.-J. Webb-Robertson, R. Hafen, J. Ramey, K. D. Rodland, et al. 2013. “Challenges in Biomarker Discovery: Combining Expert Insights with Statistical Analysis of Complex Omics Data.” Expert Opinion on Medical Diagnostics 7 (1): 37–51. doi:10.1517/17530059.2012.718329.
- Morgan, K. 2005. “Development of a Preliminary Framework for Informing the Risk Analysis and Risk Management of Nanoparticles.” Risk Analysis : An Official Publication of the Society for Risk Analysis 25 (6): 1621–1635. doi:10.1111/j.1539-6924.2005.00681.x.
- Mukherjee, S. 2018. “Recent Progress toward Antiangiogenesis Application of Nanomedicine in Cancer Therapy.” Future Science OA 4 (7): FSO318. doi:10.4155/fsoa-2018-0051.
- Murphy, F., B. Sheehan, M. Mullins, H. Bouwmeester, H. J. P. Marvin, Y. Bouzembrak, A. L. Costa, R. Das, V. Stone, and S. A. M. Tofail. 2016. “A Tractable Method for Measuring Nanomaterial Risk Using Bayesian Networks.” Nanoscale Research Letters 11: 503–503.
- Napierska, D., L. C. Thomassen, D. Lison, J. A. Martens, and P. H. Hoet. 2010. “The Nanosilica Hazard: another Variable Entity.” Particle and Fibre Toxicology 7 (1): 39. doi:10.1186/1743-8977-7-39.
- Nel, A., T. Xia, H. Meng, X. Wang, S. Lin, Z. Ji, and H. Zhang. 2013. “Nanomaterial Toxicity Testing in the 21st Century: Use of a Predictive Toxicological Approach and High-Throughput Screening.” Accounts of Chemical Research 46 (3): 607–621. doi:10.1021/ar300022h.
- Nguyen, H. T., S. Petrović, and K. Franke. 2010. A Comparison of Feature-Selection Methods for Intrusion Detection. Berlin, Heidelberg: Springer Berlin Heidelberg, 242–255.
- NRC. 2005. Committee on Communicating Toxicogenomics Information to Nonexperts. Communicating Toxicogenomics Information to Nonexperts: A Workshop Summary. Washington (DC): National Academies Press (US).
- NRC. 2007. Toxicity Testing in the 21st Century: A Vision and a Strategy. Washington, DC: The National Academies Press.
- OECD. 2017. Revised Guidance Document on Developing and Assessing Adverse Outcome Pathway. Series on testing and assessment. Environment Directorate of the OECD, Paris.
- Peng, L., A. J. Barczak, R. A. Barbeau, Y. Xiao, T. J. LaTempa, C. A. Grimes, T. A. Desai, et al. 2010. “Whole Genome Expression Analysis Reveals Differential Effects of TiO2 Nanotubes on Vascular Cells.” Nano Letters 10 (1): 143–148. doi:10.1021/nl903043z.
- Poynton, H. C., J. M. Lazorchak, C. A. Impellitteri, B. J. Blalock, K. Rogers, H. J. Allen, A. Loguinov, J. L. Heckman, and S. Govindasmawy. 2012. “Toxicogenomic Responses of Nanotoxicity in Daphnia Magna Exposed to Silver Nitrate and Coated Silver Nanoparticles.” Environmental Science & Technology 46: 6288–6296. doi:10.1021/es3001618.
- Priddy, K. L., and E. P. Keller. 2005. Artificial Neural Networks: An Introduction.
- Raies, A. B., and V. B. Bajic. 2016. “In Silico Toxicology: computational Methods for the Prediction of Chemical Toxicity.” Wiley Interdisciplinary Reviews: Computational Molecular Science 6 (2): 147–172. doi:10.1002/wcms.1240.
- Riviere, J. E. 2009. “Pharmacokinetics of Nanomaterials: An Overview of Carbon Nanotubes, Fullerenes and Quantum Dots.” Wiley Interdisciplinary Reviews: Nanomedicine and Nanobiotechnology 1: 26–34. doi:10.1002/wnan.24.
- Römer, M., J. Eichner, U. Metzger, M. F. Templin, S. Plummer, H. Ellinger-Ziegelbauer, A. Zell, et al. 2014. “Cross-Platform Toxicogenomics for the Prediction of Non-Genotoxic Hepatocarcinogenesis in Rat.” PLoS One 9 (5): e97640. doi:10.1371/journal.pone.0097640.
- Sahu, S. C., J. Zheng, J. J. Yourick, R. L. Sprando, and X. Gao. 2015. “Toxicogenomic Responses of Human Liver HepG2 Cells to Silver Nanoparticles.” Journal of Applied Toxicology 35 (10): 1160–1168. doi:10.1002/jat.3170.
- Saliani, M., R. Jalal, and E. Kafshdare Goharshadi. 2016. Mechanism of oxidative stress involved in the toxicity of ZnO nanoparticles against eukaryotic cells. Nanomedicine Journal.
- Sangi, M., K. T. Win, F. Shirvani, M.-R. Namazi-Rad, and N. Shukla. 2015. “Applying a Novel Combination of Techniques to Develop a Predictive Model for Diabetes Complications.” PLoS One 10 (4): e0121569. doi:10.1371/journal.pone.0121569.
- Sauer, U. G., L. Deferme, L. Gribaldo, J. Hackermüller, T. Tralau, B. van Ravenzwaay, C. Yauk, et al. 2017. “The Challenge of the Application of 'omics Technologies in Chemicals Risk Assessment: Background and Outlook.” Regulatory Toxicology and Pharmacology 91: S14–S26. doi:10.1016/j.yrtph.2017.09.020.
- Schmid, O., and F. R. Cassee. 2017. “On the Pivotal Role of Dose for Particle Toxicology and Risk Assessment: exposure Is a Poor Surrogate for Delivered dose.” Part Fibre Toxicology 14 (1): 52doi:10.1186/s12989-017-0233-1.
- Schneider, M. V., and S. Orchard. 2011. Omics Technologies, Data and Bioinformatics Principles. In: Bioinformatics for Omics Data: Methods and Protocols, edited by B. Mayer. 3–30. Totowa, NJ: Humana Press.
- Seixas, F. L., B. Zadrozny, J. Laks, A. Conci, and D. C. Muchaluat Saade. 2014. “A Bayesian Network Decision Model for Supporting the Diagnosis of Dementia, Alzheimer's Disease and Mild Cognitive Impairment.” Computers in Biology and Medicine 51: 140–158. doi:10.1016/j.compbiomed.2014.04.010.
- Septiadi, D., F. Crippa, T. L. Moore, B. Rothen-Rutishauser, and A. Petri-Fink. 2018. “Nanoparticle–Cell Interaction: A Cell Mechanics Perspective.” Advanced Materials 30 (19): 1704463. doi:10.1002/adma.201704463.
- Sheehan, B., F. Murphy, M. Mullins, I. Furxhi, A. Costa, F. Simeone, and P. Mantecca. 2018. “Hazard Screening Methods for Nanomaterials: A Comparative Study.” International Journal of Molecular Sciences 19 (3): 649. doi:10.3390/ijms19030649.
- Shin, T. H., D. Y. Lee, H.-S. Lee, H. J. Park, M. S. Jin, M.-J. Paik, B. Manavalan, J.-S. Mo, and G. Lee. 2018. “Integration of Metabolomics and Transcriptomics in Nanotoxicity studies.” BMB Report 51 (1): 14–20.
- Shukla, S. J., R. Huang, C. P. Austin, and M. Xia. 2010. “The Future of Toxicity Testing: A Focus on in Vitro Methods Using a Quantitative High-Throughput Screening Platform.” Drug Discovery Today 15 (23–24): 997–1007. doi:10.1016/j.drudis.2010.07.007.
- Singh, N., B. Nelson, L. Scanlan, E. Coskun, P. Jaruga, and S. Doak. 2017. “Exposure to Engineered Nanomaterials: Impact on DNA Repair Pathways.” International Journal of Molecular Sciences 18 (7): 1515. doi:10.3390/ijms18071515.
- Sizochenko, N., B. Rasulev, A. Gajewicz, V. Kuz'min, T. Puzyn, and J. Leszczynski. 2014. “From Basic Physics to Mechanisms of Toxicity: The “Liquid Drop” Approach Applied to Develop Predictive Classification Models for Toxicity of Metal Oxide Nanoparticles.” Nanoscale 6 (22): 13986–13993. doi:10.1039/C4NR03487B.
- Snyder-Talkington, B. N., C. Dong, X. Zhao, J. Dymacek, D. W. Porter, M. G. Wolfarth, V. Castranova, et al. 2015. “Multi-Walled Carbon Nanotube-Induced Gene Expression in Vitro: concordance with in Vivo Studies.” Toxicology 328: 66–74. doi:10.1016/j.tox.2014.12.012.
- Soenen, S. J. H., N. Nuytten, S. F. De Meyer, S. C. De Smedt, and M. De Cuyper. 2010. “High Intracellular Iron Oxide Nanoparticle Concentrations Affect Cellular Cytoskeleton and Focal Adhesion Kinase-Mediated Signaling.” Small 6 (7): 832–842. doi:10.1002/smll.200902084.
- Speck-Planche, A., V. Kleandrova, V. F. Luan, and M. N. D. S. Cordeiro. 2015. “Computational Modeling in Nanomedicine: prediction of Multiple Antibacterial Profiles of Nanoparticles Using a Quantitative Structure–Activity Relationship Perturbation Model.” Nanomedicine 10 (2): 193–204. doi:10.2217/nnm.14.96.
- Stagljar, I. 2016. “The Power of OMICs.” Biochemical and Biophysical Research Communications 479 (4): 607–609. doi:10.1016/j.bbrc.2016.09.095.
- Stensberg, M. C., Q. Wei, E. S. McLamore, D. M. Porterfield, A. Wei, and M. S. Sepúlveda. 2011. “Toxicological Studies on Silver Nanoparticles: challenges and Opportunities in Assessment, Monitoring and Imaging.” Nanomedicine (London, England) 6 (5): 879–898. doi:10.2217/nnm.11.78.
- Tsiliki, G., P. Nymark, P. Kohonen, R. Grafström, and H. Sarimveis. 2017. “Enriching Nanomaterials Omics Data: An Integration Technique to Generate Biological Descriptors.” Small Methods 1 (11): 1700139. “n/a.” doi:10.1002/smtd.201700139.
- van der Zande, M., A. K. Undas, E. Kramer, M. P. Monopoli, R. J. Peters, D. Garry, E. C. Antunes Fernandes, et al. 2016. “Different Responses of Caco-2 and MCF-7 Cells to Silver Nanoparticles Are Based on Highly Similar Mechanisms of Action.” Nanotoxicology 10 (10): 1431–1441. doi:10.1080/17435390.2016.1225132.
- Velikova, M., P. J. F. Lucas, M. Samulski, and N. Karssemeijer. 2013. “On the Interplay of Machine Learning and Background Knowledge in Image Interpretation by Bayesian Networks.” Artificial Intelligence in Medicine 57 (1): 73–86. doi:10.1016/j.artmed.2012.12.004.
- Vietti, G., D. Lison, and S. van den Brule. 2016. “Mechanisms of Lung Fibrosis Induced by Carbon Nanotubes: Towards an Adverse Outcome Pathway (AOP).” Particle and Fibre Toxicology 13 (11)
- Wang, S.-H., Y.-D. Zhang, Z. Dong, and P. Phillips. 2018. Classification Methods for Pathological Brain Detection. Pathological Brain Detection. Singapore: Springer Singapore, 119–147.
- Warheit, D. B. 2018. “Hazard and Risk Assessment Strategies for Nanoparticle Exposures: how Far Have we Come in the past 10 years?” F1000Research 7: 376. doi:10.12688/f1000research.12691.1.
- Winkler, D. A., E. Mombelli, A. Pietroiusti, L. Tran, A. Worth, B. Fadeel, and M. J. McCall. 2013. “Applying Quantitative Structure–Activity Relationship Approaches to Nanotoxicology: Current Status and Future Potential.” Toxicology 313 (1): 15–23. doi:10.1016/j.tox.2012.11.005.
- Winkler, D. A., F. R. Burden, B. Yan, R. Weissleder, C. Tassa, S. Shaw, and V. C. Epa. 2014. “Modelling and Predicting the Biological Effects of Nanomaterials.” SAR and QSAR in Environmental Research 25 (2): 161–172. doi:10.1080/1062936X.2013.874367.
- Worth, A., K. Aschberger, A. B. David, et al. 2017. Evaluation of the availability and applicability of computational approaches in the safety assessment of nanomaterials: Final report of the Nanocomput project. Luxembourg: Publications Office of the European Union: JRC.
- Zabinski, J. W. 2017. Advancing environmental human health risk assessment through bayesian network analysis. Department of Environmental Sciences and Engineering. University of North Carolina at Chapel Hill 172.
- Zabinski, J. W., G. Garcia-Vargas, M. Rubio-Andrade, R. C. Fry, and J. M. Gibson. 2016. “Advancing Dose-Response Assessment Methods for Environmental Regulatory Impact Analysis: A Bayesian Belief Network Approach Applied to Inorganic Arsenic.” Environmental Science & Technology Letters 3: 200–204. doi:10.1021/acs.estlett.6b00076.
- Zabinski, J. W., K. J. Pieper, and J. M. Gibson. 2017. A Bayesian Belief Network Model Assessing the Risk to Wastewater Workers of Contracting Ebola Virus Disease During an Outbreak. Risk analysis: an official publication of the Society for Risk Analysis.
- Zhang, W.D., Y. Zhao, H. F. Zhang, S. K. Wang, Z. H. Hao, J. Liu, Y. Q. Yuan, et al. 2016. “Alteration of Gene Expression by Zinc Oxide Nanoparticles or zinc sulfate in vivo and comparison with in vitro data: A harmonious case.” Theriogenology 86 (3): 850–861. doi:10.1016/j.theriogenology.2016.03.006.