
P-curve analysis is a tool to assess whether published studies provide evidence for a true underlying effect and to determine selective reporting in the literature (p-hacking and publication bias; Simonsohn, Nelson, & Simmons, Citation2014). This is accomplished by plotting the distribution of published significant p-values for a specific set of studies. When an effect is non-existent, under the null hypothesis the distribution should be uniform (e.g., p-values around .05 should be as likely as p-values around .02). The distribution is right-skewed when there is a true effect (i.e., p-values below .025 are more likely than p-values between .025 and .05), and in the case of selective reporting, the distribution will be left-skewed (i.e., p-values between .025 and .05 are more likely than p-values lower than .025).
In a recent study, Carbine and Larson (Citation2019) plotted the distribution of p-values for the effects of so-called inhibitory control training (ICT)Footnote1 on eating behaviour and food choice. During such training, participants perform simple motor responses to some food items, or control items (go items), and withhold their responses for other food items (no-go food items). After the training, consumption of no-go food items or choices for no-go food items are compared to consumption of or choices for go items or control food. Carbine and Larson performed several p-curve analyses with different p-value inclusion criteria, and consistently found a u-shaped distribution of p-values. This finding suggests both evidence for selective reporting and evidential value for the effect. However, this evidential value appeared very weak as a robustness test indicated this evidential value was dependent on the inclusion of a single low p-value. Accordingly, they concluded the observed effect sizes are likely inflated in the literature and higher powered preregistered studies are therefore needed to test for the presence of ICT effects.
In our lab we recently conducted a series of seven preregistered well-powered experiments where we assessed effects of the go/no-go training, a widely used inhibitory control training, on food choice (Chen, Holland, Quandt, Dijksterhuis, & Veling, Citation2019). The aim of this research project was to obtain a high-quality data set of effects of go/no-go training on food choice. In all studies, participants first performed responses to some food items and withhold responses to other items in a go/no-go training, and afterwards received a series of binary consequential choices between go and no-go food items for real consumption. Results from these experiments were very consistent: Participants preferred go items over no-go food items when choosing with limited decision time in five studies, and this effect was not found without a limit on decision time in two other studies. Note that limited decision time was also imposed in studies on food choice in work included in the p-curve analysis by Carbine and Larson (Citation2019) and Veling, Aarts, and Stroebe (Citation2013).
We understand that this recent work was not included in any p-curve analysis reported by Carbine and Larson (Citation2019) as the Chen et al. (Citation2019) study was only recently published. Nevertheless, we do think it is useful to examine whether and how adding these data to a p-curve analysis reported by Carbine and Larson would change any conclusions for two reasons. First, the original p-curve was computed on 11 p-values, and an update with five new p-values is thus substantial. Second, to the best of our knowledge, Chen et al. published the only preregistered ICT experiments on food choice to date. Hence, adding the p-values from this work allows for a first test of whether including experiments that adhere to the recommendations of Carbine and Larson would change the results of such a p-curve analysis. This may not only shed light on the absence or presence of the evidential value for ICT on eating behaviour, but also further emphasise the value of preregistering experiments.
It was a-priori decided (see preregistration; https://osf.io/dhzuf/files/) to update the p-curve analysis from the updated search analysis as reported by Carbine and Larson (Citation2019), which included 11 p-values focusing on main effects of the training on eating behaviour and choice. See for the results of this original p-curve analysis. Chen et al. (Citation2019) have reported seven experiments on effects of go/no-go training on food choice. Two experiments revealed statistically non-significant results (Experiments 1 and 3 where participants chose with unlimited decision time) and were therefore unsuitable for the updated p-curve analysis. The selected statistical test for each of the remaining five experiments was the effect of go/no-go training on choices between go versus no-go items where the values of both items were matched. Note that in Experiment 2 we did not have a directional prediction prior to conducting the experiment, whereas in all the remaining experiments (i.e., Experiments 4–7), we predicted a preference for go items over no-go items after training in the preregistrations. Excluding Experiment 2 leads to comparable results as reported below. For each experiment, the selected test was the first reported test of the training on choice. Thus, in case there was a retest of the effect after some days, the first test was selected only. As a result, the following tests of the effect of the training on the probability of choosing go over no-go food items were selected (see for the p-curve disclosure table with additional information for these experiments; Simonsohn, Simmons, & Nelson, Citation2015):
Experiment 2: mean proportion 56.6%, OR 1.32, 95% CI [1.06, 1.64], p = .013
Experiment 4: mean proportion 55.7%, OR 1.28, 95% CI [1.08, 1.52], p = .005
Experiment 5: mean proportion 61.8%, OR 1.74, 95% CI [1.40, 2.16], p < .001
Experiment 6: mean proportion 57.0%, OR 1.37, 95% CI [1.13, 1.65], p = .001
Experiment 7: mean proportion 61.5%, OR 1.69, 95% CI [1.41, 2.03], p < .001
Figure 1. The original updated search p-curve analysis by Carbine and Larson (Citation2019).
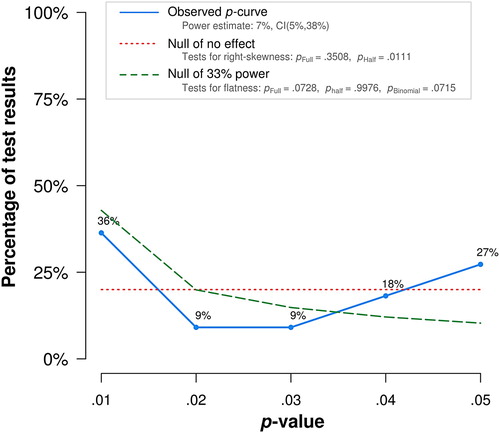
Table 1. P-curve disclosure table.
The p-curve analysis was conducted in exactly the same way as the updated search analysis reported by Carbine and Larson by using http://www.p-curve.com/app4/ (version 4.06). Because this app does not accept odds ratios, the odds ratios from the tests above were first converted into z-scores. For this, the OR and the lower 95% confidence interval of the OR score were log-transformed (i.e., logOR and logORL95). Then the difference score was computed (logOR−logORL95 = diff) and then divided by 1.96 (diff/1.96 = SEOR). Finally, z was computed by using the equation z = logOR/SEOR.
shows the updated p-curve. Compared to the p-curve reported in Carbine and Larson (Citation2019) (see ), this p-curve is less U-shaped and more right-skewed. As both the full and half p-curve tests for the null hypothesis of no effect are statistically significant, this analysis suggests the evidential value of the training. Furthermore, the p-curve tests for the null hypothesis of 33% power are not statistically significant. The p-curve thus does not indicate that the evidential value is inadequate or absent. The power is also substantially higher than the original analysis with an increase from 7% to 51%, with a 90% confidence interval from 22% till 76%. Although the increase in average statistical power is substantial, an average statistical power of 51% is still relatively low and would benefit from more higher powered preregistered studies in future work. Robustness checks now indicate evidential value for the effect even when excluding up to the lowest 4 p-values for the half p-curve and the lowest p-value for the full curve (see the OSF repository for this p-curve application output; https://osf.io/gtj7e/). There is no longer any statistical evidence of selective reporting, although descriptively the right skew should be going towards 0 instead of trending upwards in the absence of selective reporting.
Figure 2. The p-curve analysis when combining the updated search analysis by Carbine and Larson with five preregistered experiments by Chen et al. (Citation2019).
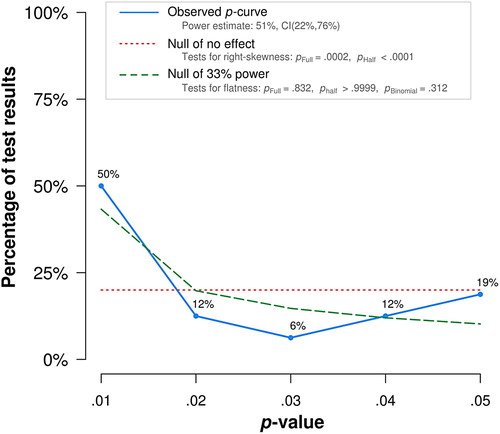
What have we learned? Of course, based on our prior knowledge, we anticipated that the new p-curve analysis would give more evidence for evidential value than the p-curve without these experiments. Nevertheless, the change in conclusion is quite substantial. Whereas the original analysis suggests selective reporting may be more likely than evidential value, adding the preregistered experiments suggests clear evidence for evidential value over selective reporting. The new p-curve analysis thus suggests that ICT does influence eating behaviour and food choice. The new analysis thereby reinforces the importance of conducting high quality preregistered experiments.
A final note seems in order. We agree with Carbine and Larson (Citation2019) that future work on food-related inhibitory control training would benefit from preregistered, high-powered studies. However, preregistration and high power are of course not magic spells leading up to evidential value. First, a good theory is needed. Second, discussions about the replication crisis in psychology (Open Science Collaboration, Citation2015) and research practices more generally have not only stimulated us to routinely preregister our studies with sample sizes determined by a priori power analyses, but also to develop experimental protocols that may lead to more reliable findings than previous work. For instance, instead of selecting suitable (e.g., attractive) food items based on pilot studies, we now select attractive food items for each participant based on his or her own ratings within each experiment. This way we can reduce variation across different individuals and use food items that are attractive to each participant. Furthermore, we have substantially increased the amount of measurements we collect from each participant (e.g., they make many food choices) and moved from between-subjects to within-subjects designs when possible. By applying such procedures, we are able to consistently find effects of executing or withholding simple motor responses on food evaluation (e.g., Chen, Veling, Dijksterhuis, & Holland, Citation2016; Quandt, Holland, Chen, & Veling, Citation2019) and choice (Chen et al., Citation2019). A challenge for future work is to develop reliable experimental procedures for other outcomes than food evaluation or choice (e.g., food intake or weight loss), which can further contribute to evaluating the evidential value of ICT. We use open-source statistical and experimental software and offer these materials online so that other researchers can easily replicate and extend our findings (e.g., for the Chen et al., Citation2019 work you can find this here, https://osf.io/zy9w3/). We hope with the wide adoption of preregistration and other good research practices, food ICT researchers (and other psychologists) will contribute to a scientific literature with relevant, accessible, and reliable findings.
Disclosure statement
No potential conflict of interest was reported by the authors.
Notes
1 Although we think this kind of training does not train inhibitory control (Veling, Lawrence, Chen, van Koningsbruggen, & Holland, Citation2017), we use this term in this paper to be consistent with the paper we are commenting on, and to avoid confusion.
References
- Carbine, K. A., & Larson, M. J. (2019). Quantifying the presence of evidential value and selective reporting in food-related inhibitory control training: A p-curve analysis. Health Psychology Review, 13, 318–353. doi: 10.1080/17437199.2019.1622144
- Chen, Z., Holland, R. W., Quandt, J., Dijksterhuis, A., & Veling, H. (2019). When mere action versus inaction leads to robust preference change. Journal of Personality and Social Psychology, 117(4), 721–740. doi: 10.1037/pspa0000158
- Chen, Z., Veling, H., Dijksterhuis, A., & Holland, R. W. (2016). How does not responding to appetitive stimuli cause devaluation: Evaluative conditioning or response inhibition? Journal of Experimental Psychology: General, 145, 1687–1701. doi: 10.1037/xge0000236
- Open Science Collaboration. (2015). Estimating the reproducibility of psychological science. Science, 349(6251), aac4716. doi: 10.1126/science.aac4716
- Quandt, J., Holland, R. W., Chen, Z., & Veling, H. (2019). The role of attention in explaining the no-go devaluation effect: Effects on appetitive food items. Journal of Experimental Psychology: Human Perception and Performance, 45, 1119–1133. doi: 10.1037/xhp0000659
- Simonsohn, U., Nelson, L. D., & Simmons, J. P. (2014). P-curve: A key to the file-drawer. Journal of Experimental Psychology: General, 143, 534–547. doi: 10.1037/a0033242
- Simonsohn, U., Simmons, J. P., & Nelson, L. D. (2015). Better p-curves: Making p-curve analysis more robust to errors, fraud, and ambitious p-hacking, a reply to Ulrich and Miller. Journal of Experimental Psychology: General, 144, 1146–1152. doi: 10.1037/xge0000104
- Veling, H., Aarts, H., & Stroebe, W. (2013). Using stop signals to reduce impulsive choices for palatable unhealthy foods. British Journal of Health Psychology, 18, 354–368. doi: 10.1111/j.2044-8287.2012.02092.x
- Veling, H., Lawrence, N. S., Chen, Z., van Koningsbruggen, G. M., & Holland, R. W. (2017). What is trained during food go/no-go training? A review focusing on mechanisms and a research agenda. Current Addiction Reports, 4, 35–41. doi: 10.1007/s40429-017-0131-5