
ABSTRACT
Robust indicators are important for identifying disadvantaged pupils in education, and for ensuring that they are rightly receiving relevant state-funded assistance. This paper compares the quality and completeness of data from England on student eligibility for free school meals (FSM) based on an administrative census, with more all-encompassing household income measures, from a smaller sample of young people. The first measure comes from the National Pupil Database (NPD), and the second from Next Steps (NS). The two datasets are linked at the individual student level. In this restricted group, FSM data is more complete (97%) than household income (47%). The bias created by missing data on income in NS calls into question its more general usefulness for analysts. FSM cannot be read neatly from income, such as referring to an income below a certain level, and vice versa. Many reportedly low-income children are not listed as FSM-eligible. However, the two values are linked, while each also provides unique information. Both measures predict attainment at school, to some extent. The paper concludes that FSM is the more practical measure at present, but also considers how access to limited income data could be made more widespread while maintaining individual data rights.
Introduction
There is an emerging body of research assessing the reliability, validity and access of key indicators which explain life-long outcomes of young people, and that can also be used for fair identification of disadvantaged students for targeted policy and interventions. Our new study provides additional insight on selected indicators in two national datasets and presents evidence on their usefulness as predictors for identifying disadvantaged pupils and their subsequent educational outcomes. The focus here is on comparison between gross household income and Free School Meal eligibility (FSM), which are overlapping indicators of disadvantage and, of these two, which are most suitable predictors of educational outcomes of young people at age 16.
There are many ways of defining disadvantage and the educational challenges that ensue. This paper focuses on economic disadvantage, as defined by students coming from a low income household. On average, students from disadvantaged backgrounds tend to have lower attainment at schools and worse opportunities in subsequent education and later life (Lessof et al. Citation2018). This is a worldwide phenomenon (Hanushek et al. Citation2019), and one that may be worsening over time at least in some countries (Chmielewskia Citation2019), but not necessarily in England (Gorard Citation2022). These students also tend to be clustered, to some extent, in particular economic regions, areas of housing, and schools (Gorard Citation2018). This socio-economic ‘segregation’ can be damaging by lowering aspiration and participation for individuals, and reducing national and regional social/ethnic cohesion (Hewstone et al. Citation2018, Bhattacharya Citation2021), and is perhaps more serious for lower-attaining and more disadvantaged students (Dickerson et al. Citation2018, Siddiqui Citation2017). This needs to be addressed by policy which requires accurate identification of disadvantage.
For these and other reasons, being able to identify disadvantaged students is important for both research and policy/practice purposes. Using robust indicators that define both the poverty attainment gap and school settings by socioeconomic status (SES) have implications for the objectives of policy (Gorard and Siddiqui Citation2019).
For example, the Pupil Premium (PP) policy in England provides condition-based funding to schools, based on their disadvantaged intakes, to spend on learning improvements for disadvantage pupils. Schools receive additional funding in proportion to their intake of FSM eligible pupils. Access to information on pupils’ FSM status is essential for procuring the state-funds and implementing the improved learning approaches for the targeted pupils. The role of indicators in identifying the right targets of the policy is therefore a key to achieve the policy objectives of narrowing the attainment gap and reducing SES segregation between schools (Gorard Citation2021). This new study considers the case for indicators that explain the poverty attainment gap in relation to their reliability, completeness and availability for a successful implementation of education policies and programmes.
Two sources of data on disadvantage
Evidence on the best available indicators can be drawn from existing large-scale study datasets which record data using standardized measures and scientific methods. Robust poverty indicators can further allow consideration of the types of poverty and their possible impact (Yang Citation2019, Gorard Citation2021). In general, the longer the duration of poverty, the more problematic any educational outcomes will be (Gorard Citation2022). The relationship between child poverty and educational outcomes has generated a large body of evidence on the measurement of poverty indicators. Using robust poverty indicators is necessary for fair implementation of the policy initiatives and evaluating their impact (Franck and Nicaise Citation2017, Boliver et al. Citation2021). Our new study refers to types of poverty but the main focus of the analysis is to determine the rigour and feasibility of the accessible poverty indictors.
Two quite different longitudinal datasets in England, providing information on young peoples’ disadvantage and the determinants of their educational outcomes, are the National Pupil Database (NPD) and Next Steps (NS). These two datasets have played an important role in education research, generating knowledge of the impact of disadvantage, and informing a number of educational policies such as the introduction of Pupil Premium funding in 2010, or raising the education and training participation age in 2013 (DfE Citation2013). This paper looks in some detail at how these datasets compare, and which indicators within them should be preferred when trying to encapsulate educational disadvantage.
The National Pupil Database (NPD) is a rich information resource that includes administrative census data obtained from all state-funded schools in England, held by the Department of Education (DfE), back to 2002. It contains pupil-level information concerning their academic attainment, and personal and school characteristics for every year that a pupil is at school in England. The information is updated and verified annually for around 600,000 pupils in each age cohort, in around 25,000 schools. Around 7% of pupils attend private schools, and the information relating to them is either weaker or missing altogether. A fair and timely provision of school funding is the key objective for collecting this information. However, the use of this information has become much wider, and currently NPD users are a diverse community of researchers, policy makers, and school service providers. The main available indicators of potential individual-level disadvantage are ethnicity, first language other than English, special education need and/or disability, and eligibility for free school meals (FSM). For the FSM indicator, for example, pupils/families must be registered as eligible, and their disadvantage is verified by official documents or records.
The Next Steps cohort study, funded by Department for Education, England, was formerly known as the Longitudinal Study of Young People in England (LSYPE). The study involved a sample of 15,570 young people, aged 13–14 in the year 2004. These were followed for 11 years, with data collected in waves, until they were aged 25–26. This is an important data resource that collected detailed and very varied information on young people’s life at home and school. It is much smaller than NPD and, of course, may be biased in terms of those agreeing to take part, but the range of variables it includes is much richer. There are details on young peoples’ circumstances including information from their parents such as their education, job status, income, aspirations and attitudes towards their children’s education. There are in-depth details such as the nature of disability, the age when a young person first identified as disabled, and how disability affected a young person’s school life. There are also indicators of changes in the attitudes and aspirations of young people during the years of secondary school, transition, access to higher education, and job destinations. The additional main indicators of potential disadvantage in NS are based on household income, and parental occupation and education. The former has been recorded by asking parents and carers in the household their actual monthly, weekly or hourly income, which is converted into an aggregated household income figure. Almost all of the information in NS is self-reported, and almost none is officially verified before inclusion (Siddiqui et al. Citation2019).
These two datasets have been linked, so that every record in NS has been matched where possible with the corresponding student record from NPD. The data linkage was performed by the Department of Education as the NS study was sponsored and conducted by the DfE, and NPD is also maintained by the DfE (Baker et al. Citation2015). Now there are both rich self-reported variables and officially verified descriptors, along with administrative data on attainment and other outcomes, for the smaller number of matched records. The linked dataset increases the potential for research and for assessing the reliability of comparable indicators.
This paper compares the quality and completeness of the data in both datasets, with a focus on indicators of income disadvantage, comparing FSM eligibility with household income where this is known. The completeness of datasets is an important issue that can change the substantive picture of any findings. Many studies in this area do not consider missing data and its impact at all (e.g. Byrne and Treanor Citation2020), effectively running complete case analyses with all of the attendant dangers (Gorard Citation2020).
The next section of the paper looks in more detail at how FSM eligibility is decided, and summarizes some of the prior evidence on its suitability as an indicator of disadvantage. Another section considers how household income is assessed in NS. This is followed by a description of the methods used in this new study, and a series of results based on comparing FSM and income, in terms of quality, completeness and the correlations between them. The last substantive section of this paper presents results from a logistic regression model predicting the Key Stage 4 (KS4, national assessments at age 16) outcomes for young people, based on income and FSM data. The paper concludes by considering the implications for the use of the NS or NPD indicators, and what can be done to increase the utility of the data sets for research analysis, policy targets and interventions.
The indicators discussed in this paper are assessed in relation to attainment outcomes because attainment is a standardized measure, accessible for analysis in the two datasets and an important determinant of life-long outcomes. Indicators such as school-attendance, exclusions health in general and mental-health are important correlates of FSM and household income but could not be used in this study for assessing the reliability of FSM and household incomes because this information was not linked from official records and between NPD and NS.
How good is free school meal (FSM) as an indicator of disadvantage?
For the NPD, FSM status has traditionally been indicated by school administrators or the relevant Local Authority. Until 2017, and the rollout of Universal Credit, the criteria for registering for FSM were relatively stable. FSM is intended to assist the children of families on state benefits or very low incomes (https://www.gov.uk/apply-free-school-meals). More specifically the criteria have included:
Income Support (for those earning below a certain level)
Income-based Jobseeker’s Allowance
Income-related Employment and Support Allowance
Support under Part VI of the Immigration and Asylum Act 1999
The guaranteed element of Pension Credit
Child Tax Credit (if not also entitled to Working Tax Credit, and have an annual gross income of no more than £13,480 in 2005)
Working Tax Credit run-on – paid for 4 weeks after you stop qualifying for Working Tax Credit
FSM is therefore clearly targeted at disadvantaged families, based on an officially verifiable status and its documentation. This indicator is available annually to analysts, with individual records back to 2002 and school-level records back to 1989, covering all pupils in all state-funded schools. In all of these respects it is an excellent measure of disadvantage. FSM has become a key indicator against which the academic performance of state-maintained schools and pupils has been judged (DfE Citation2018), intervention targets are set (The Sutton Trust Citation2015), and the evaluation outcomes of programmes and policies are demonstrated (Education Endowment Foundation Citation2017).
Nevertheless, FSM has some deficiencies as a measure of disadvantage, and these need to be taken into account in any new analysis. FSM-eligibility says nothing at all about the majority of pupils who are non-disadvantaged in this respect, and this makes it hard to say anything about those families just outside the threshold for FSM (Hobbs and Vignoles Citation2010). Nor can it tell us about the depth of poverty within the FSM-eligible group itself. There is the issue that some pupils, a decreasing proportion every year, are listed with an unknown FSM status, and this missing group of less than 4% of the total of all pupils are, on average, more disadvantaged than FSM-eligible pupils, according to what else is known about them (Gorard Citation2012). Partly this issue arises because parents have generally been required to register their children as FSM-eligible, and not all do so (Storey et al. Citation2011, Iniesta-Martinez and Evans Citation2012). Based on official HMRC (Her Majesty’s Revenues and Customs) household income figures, it is estimated that 11% of pupils in 2013 who would be entitled to FSM in terms of household income were not officially registered (Lord et al. Citation2013). Direct access to household income is controlled by HMRC which is responsible for checking FSM eligibility or other state entitlements upon request of Local Authorities (DfE Citation2018). This data is not generally available for researchers.
Pupils’ FSM status and attainment data can be gathered from the Department of Education (DfE). Access is granted for trained and screened individuals for research purposes under strict data security protocols. Individual FSM status is a sensitive variable covered by GDPR, but which can be requested for the fulfilment of a public task/research project with a public interest (DfE Citation2021).
One improved way of examining variation within the FSM group, accounting for pupils moving in and out of eligibility over time as the economic situation changes, and so being able to say at least something about some pupils near or further from the threshold for entitlement, is to look at the duration of their poverty. Using the proportion of years at school known to be eligible for free school meals is also a better predictor of subsequent attainment than either current eligibility or whether they have ever been eligible (Gorard and Siddiqui Citation2019). Unfortunately, this superior measure of chronic poverty cannot be used in the new analysis below, because the linked NS/NPD dataset has only snapshot measures of FSM.
How household income is measured in Next Steps (NS)?
Next Steps has a range of questions about parental income, and respondents are able to provide the figures as hourly, weekly, monthly or annually, and these are used to create derived variables about household income for the sole or ‘main’ partner, and gross income that includes benefits and other ‘unearned’ income. Respondents were asked about income at the outset (in wave 1), and again in wave 2. In subsequent waves the approach was changed (see below). All figures are self-reported.
There is some evidence that such self-reports lead to biased estimates of household income, perhaps under-stating the income for those at extreme ends of the income continuum (D’Aurizio et al. Citation2008, Fairfield and Jorratt Citation2016), those on benefits, or the less well-educated (Johnson and Scutella Citation2003), the self-employed (Jenkins Citation2010, Paulus Citation2015), and the elderly and retired (Bee and Mitchell Citation2017). According to an analysis of the Millennium Cohort Study, income non-response is not random but relates to parents’ self-employment status (Hawkes et al. Citation2008). On the other hand, a minority of researchers have suggested that the attrition and missing data in each wave is missing at random (Anders Citation2012b), meaning that missing income and other data can be compensated for by imputation (Anders Citation2012a). We do not believe that this is true. Our new analysis looks again at the nature of the missing data in NS.
Previous comparisons of NPD and cohort studies
Studies have previously examined longitudinal or cohort datasets linked with NPD, in order to try and assess the value of the FSM indicator available in NPD. An analysis of the linked Millennium Cohort Study (MCS) and NPD involved a small sub-sample of Welsh children and their families (Taylor Citation2018). FSM status from NPD was linked with 1590 Wales-domiciled children (57% of the initial sample from Wales achieved in the first data sweep). The educational outcomes of children were assessed at age 7 and 11, after controlling for personal characteristics, parental education, household income, family composition, geography (urban/rural), neighbourhood deprivation and FSM status. The findings suggest that FSM status does not fully capture the social disadvantage of children in educational contexts, while parental education, family size and area-level measures are more strongly linked to children’s educational attainment. However, a similar and larger study in the US based on comparative analysis of household income and free and reduced-price lunch, suggests that while the lunch measure only captures a small part of the income range, it nevertheless manages to convey key elements of relative disadvantage that income measures do not (Domina et al. Citation2018). Perhaps both variables are useful, separately and in combination.
Next Steps (NS) itself has been linked with NPD to help assess the quality of the FSM indicator relative to household and neighbourhood characteristics, based on predicting Key Stage 4 (KS4 at age 16) outcomes (Ilie et al. Citation2017). The FSM indicator used was EverFSM5 which captures disadvantaged socioeconomic status by flagging children in NPD if they have been deemed FSM-eligible at some point in the five years before their KS4 exams (Iniesta-Martinez and Evans Citation2012). The sample size was 12,678 (around 80% of all cases). Parental qualifications alone explained 26% of the variation in KS4 outcomes, parental occupation alone also explained 26%, while EverFSM5 explained 23%, and household income even less.
Methods used to compare NPD and NS
The dataset used in the following analyses is the linked version of Next Steps with the National Pupil Database 2005/06. The key variables from NPD are whether a pupil is or is not known to be eligible for free school meals (FSM), whether they achieved 5 or more GCSEs grade A*-C, or equivalent, including English and maths (the level 2 indicator of attainment according to the UK qualification framework), and their total KS4 capped points score. The key variable from NS is the gross household income for each young person, as collected in wave 1. Where this is missing, we have used their income from wave 2 if available. In total, there are only 7977 complete cases in terms of these four variables (and the reasons for this are discussed below).
We first look at the number of missing cases and values for key variables, and consider the bias that this missing data might cause. This is also exemplified by looking at the impact of dropout on the apparent average income in each wave of NS. We then compare the figures for income and FSM, via cross-tabulation and histogram. We use the set of linked cases that have data on KS4 outcomes, meaning that some cases are missing FSM-eligibility, so we add missing as a third category (over and above FSM- and not FSM-eligible).
We present Pearson’s R correlations between KS4 capped points and household income or FSM-eligibility. We also present a logistic regression model with the binary indicator of achieving Level 2 at KS4 (or not) as the outcome, and income and FSM status as the predictors. We add income in the first step and FSM in the second, but it makes no substantive difference if this order is reversed.
Missing data in Next Steps
There are 16,122 cases in total in Next Steps, but as may be imagined there is not complete data for all variables for all cases. For example, around 2% of cases in wave1 have an unknown employment status for the main parent, about 6% are missing data on the number of siblings, 20% are missing parental education, and a massive 58% are missing the figures needed for gross household income (). In wave 2, a further 5% of cases reported valid household income, and these are added to the cases from wave 1, so that for the ensuing analyses we have a total of 47% valid cases. This minimizes missing values somewhat by using actually reported income, but for a different year. The mean income for those reporting income in both waves 1 and 2 increased by an average of £1882, presumably a product of inflation among other factors. This means that using wave 2 data to supplement wave 1 may slightly exaggerate the overall income figures.
Table 1. Completeness of data on selected household variables in Next Steps.
In summary, income data is missing for over half of the cohort from the outset, and this creates immediate problems, such as the potential for serious bias in estimating average incomes. This level of missing data is too high even to attempt to correct by standard means. In later waves, household income was collected by using a household grid approach, in which income bands were presented to respondents as choices of where their gross annual income fell. This is less precise than in previous waves, but was thought to be easier for respondents to complete. But even so, in each wave there were fewer participants retained in total than in the previous one anyway, dropping to less than 50% of the original total by the final wave ().
Table 2. Percentage of wave 1 respondents in each successive wave of Next Steps.
It is interesting to see how different the average income of the original wave 1 respondents becomes as some cases drop out in successive waves (over and above the 58% who did not provide this information originally). This makes it look as though the average wage is increasing rapidly, but this is an illusion (). As cases drop out over time, the average of the wave 1 income for those remaining increases. This is because those dropping out in each year to 2010 have, on average, noticeably lower household incomes. A similar thing happens with the income figures from wave 2, and for parental education. Parental education is the variable with the second most missing data in , and this again creates a potential for bias. The cases dropping out over time are those with, on average, the lowest levels of education, and so the bias becomes stronger with every wave. The cases are not missing at random (Gorard Citation2020).
Figure 1. Participant dropout and changes in household income over time.
Note: In wave 8, after a gap of 5 years, monetary incentives were offered for dropout cases from the original sample to respond.
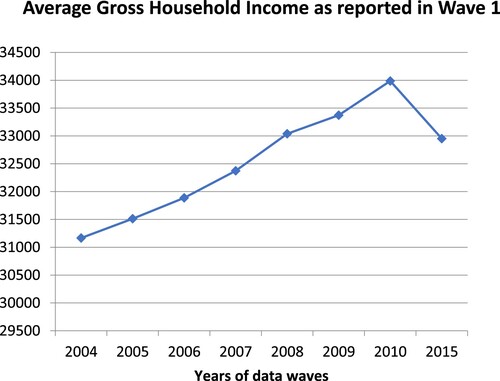
This is a demonstration of how far from random the missing data in NS is. Therefore no adjustment is possible (Gorard Citation2020), and for the analysis below we simply use the measure of household income from the complete wave 1 (and wave 2 where needed), and compare this with eligibility for FSM in the same year (2004/05).
Missing data in National Pupil Database (NPD) linked to Next Steps (NS)
The cases in NS have been linked to their equivalent records in NPD for 2005/06, in order to try and maximize the information available for each case, and to provide official administrative data on their attainment at KS4. The data in NPD is generally much more complete than in NS. For example, less than 4% of cases in NPD are missing FSM-eligibility values in any year. Yet, when linked to NS, the combined dataset has considerably more missing data – in effect combining the missing data from both datasets. Linkage to NPD was only permitted for those participants who agreed to it, under their data subject rights. For these, and perhaps other, reasons some of the NS cases do not have linked NPD cases (). Overall, 14,784 cases in NS were matched to a record in NPD. A small number of pupils in NS (3%) attended private schools, and these do not have a full NPD record (with FSM and other values), even where they can be linked, and so the analysis that follows is largely relevant for the vast majority of pupils in England who are in state-maintained schools. In addition, there will be some missing data for some variables even in the existing linked cases. All of these issues add to the missing data, the potential bias, and the difficulties for analysis.
Table 3. Completeness of data on selected individual variables in NPD 2005/06.
Comparison between gross household income (in NS) and FSM (in NPD)
Focusing on the 75% of cases with FSM status in the linked NS dataset, only 60% of these have a reported household income. It is these 7977 cases, where a direct comparison is possible, that are used in the ensuing analyses.
In 2004, full and additional benefits were payable by the state to families defined as being ‘low paid’ where their family income was up to £13,480, while tapered benefits were payable to families above this point up to £18,000 per annum (The Guardian Citation2003). Using the former figure as the definition of poverty for the present, 24% of cases in the linked dataset reported gross household incomes less than £13,480.
shows that the overwhelming majority of young people from families with incomes above this threshold are not identified as FSM-eligible in NPD, and proportionately more are identified as eligible with incomes below this threshold. There is, as expected, a clear link between income and eligibility. Given that income is self-reported and FSM is decided more officially, this result validates to some extent the income measures from NS, derived from a mixture of rates, sources and durations. It is not clear why 84% in the lowest income group are not eligible, but they would include those discussed above who have not registered, even though they would be entitled to FSM. This may be because the young people do not want the meal provided (perhaps for dietary reasons), the family have only recently moved into poverty, or to the area/school, or because the family has not provided the documentation needed. Perhaps they are travellers or recent immigrants, even if only from another home country of the UK. It may be that the income estimate does not account sufficiently for state benefits, and that the gross income after benefits of some families with an estimated earned income below £13,480 has been underestimated. Even so, the small proportion of FSM students coming from households with incomes below £13,480 is surprising, and this is discussed further below in relation to .
Figure 2. Percentage FSM eligibility (NPD) by decreasing household income band (NS).
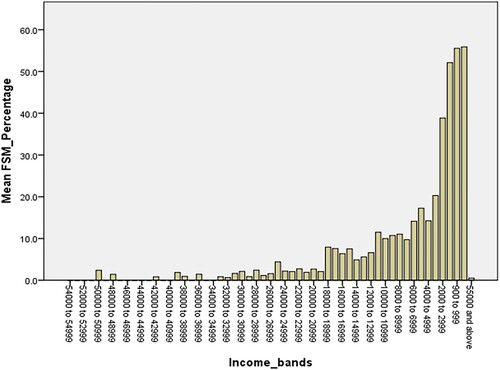
Table 4. Percentage of young people from poor families identified as FSM-eligible (2004).
The 2% of young people eligible for FSM but not living in a household below the officially recognized threshold for low income may be eligible for other valid reasons. Their household income may have improved recently, the benefit may still be available to them with incomes up to or even above £18,000, or they may be eligible on one of the other bases (such as the Immigration and Asylum Act). The respondent may even have mistakenly exaggerated their household income.
Around 33% of NS respondents come from a household with incomes below £18,000 (so about 9% have incomes between £13,480 and £18,000). The position for FSM-eligibility of this group is similar to above (). For both income levels, there are also the issues that the wave 1 incomes have been supplemented with 5% of values from wave 2 which are slight higher on average (see above), and the FSM measure comes from NPD 2005/06 which is the year after the wave 1 income data was collected. Given that incomes can go up and down, sometimes radically, we would not expect a perfect fit between income and FSM data. We must add to these cautions the facts that only 47% of incomes and 75% of eligibility are available anyway.
Table 5. Percentage of young people from poor families identified as FSM-eligible (2005).
In order to investigate the situation further, we put the individual income figures into equally-spaced bands with £1000 increments, and looked at what proportion of cases in each band is labelled as FSM-eligible (). The histogram is, and can only be, based on cases where both household income and FSM was available. Again, as expected, the sparsely populated but very low income households have high proportions of the young people eligible for FSM, although apparently never above 60%, and the very high income households have very few or even no FSM-eligible students. It is not clear why there is a small group of very high earners apparently labelled FSM-eligible, and this may be partly an indication of an error in responding or coding. Otherwise there is a slightly erratic exponential rise in FSM as income decreases.
There is the suggestion of a discontinuity at and above the £18,000 band. The clear majority of FSM-eligible students are from households with incomes up to the £18,000 band, and the clear majority of students from households above the £18,000 band are not eligible. This is presumably linked to the point at which tapered benefits stopped in 2004 (see above), and could be very useful for a future analysis, based on a ‘fuzzy’ regression discontinuity design (Lee and Lemieux Citation2010), to see whether there is an equivalent discontinuity in student attainment at school.
One reason why such a discontinuity is important is that FSM-eligibility/poverty is the major criterion for allocating Pupil Premium funding to schools in England. Pupil Premium is provided to schools in proportion to their number of disadvantaged pupils, and is intended to assist those pupils facing long-term challenges. The funding must be used to improve school outcomes for disadvantaged pupils, and so help reduce the ‘achievement gap’ between children coming from richer and poorer families (Gov.uk Citation2010). It is hard to assess whether the allocation of Pupil Premium since 2011 has led to a reduction in the poverty attainment gap, for reasons explained in Gorard and Siddiqui (Citation2019). One approach has been to identify a group of persistently disadvantaged pupils who would presumably have been considered disadvantaged in any era (Gorard Citation2021, Citation2022). But it would also be useful to estimate the impact of the funding policy on those young people whose schools received it, during the era since 2011, using Our Future (a subsequent cohort study based on Next Steps), and compare it to the situation for those above and below the income discontinuity in Next Steps. This Regression Discontinuity Design approach can help us to decide whether the treatment (Pupil Premium) is causally related to a reduction in the poverty attainment gap (Shadish et al. Citation2002). If the Pupil Premium funding has made a difference this should show up as a discontinuity in the link between attainment and income in Our Future but not in Next Steps. This will be the subject of a future paper.
There is less of a clear break at £13,480 or, put another way, there appears to be a bulge just above that point, where more young people are FSM-eligible perhaps for reasons not connected so directly to household income.
Which indicator is the best predictor of Key Stage 4 performance?
Achievement at KS4 is an important outcome of education in itself, a key predictor, and maybe a determinant, of future opportunities including conditional offers for admittance to higher education in the UK. There is widespread concern about a poverty attainment gap at KS4 (and other ages), and so it is useful to consider which indicators of disadvantage are the strongest predictors of KS4 attainment. Although models using the full NPD will clearly be stronger (based on 600,000 pupils per cohort), they can only use a narrow range of indicators of possible disadvantage including the threshold measure of FSM. No income data is provided. Using only the much small number of cases available in Next Steps though, to what extent does household income, improve the predictability of KS4 attainment, in comparison to FSM? provides the summary of cases with complete values for the variables included in the logistic regression analysis.
Table 6. Summary of the included cases.
Based on the cases with KS4 data, and looking at FSM-eligibility and household income separately, the correlations are relatively small. Attainment and income indicators have only around 6% variation in common (, the R value of 0.24 yields R-squared of 0.058). Being FSM-eligible is clearly negatively related to attainment, while income is positively related. More importantly for the purposes of this paper, the continuous variable household income is more strongly related to attainment scores than the binary FSM-eligibility variable is. Despite the cautions about bias caused by missing data, this suggests that were household income available for all pupils it could provide a better context variable than FSM. It could be used to help judge school performance, for inspection purposes, and in the allocation of Pupil Premium funding, for example. Of course, the relative strengths of these correlations may well be misleading, because of the different levels of originally missing data for each.
Table 7. Correlation between indicators of disadvantage and KS4 attainment.
However, FSM eligibility is a binary variable, and a correlation with a real number may not be the best way to present it. A fairer comparison might be based on logistic regression that handles real numbers like income and categorical variables like FSM-eligibility (including whether missing) equally well (Gorard Citation2021). Only just over 34% of students attained the Level 2 indicator at KS4, meaning that any prediction of student outcomes would be 65.7% accurate merely by guessing that any student did not attain Level 2 (). Adding household income from NS as a predictor in step 1 increases the model accuracy by a negligible amount to 65.8%. Then adding FSM status increases accuracy to 66.7%. The gains are small, but FSM-eligibility is a somewhat better predictor of this level of attainment than income is (even for complete cases).
Table 8. Percentage correctness of predicting KS4 Level 2, based on income and FSM.
This is confirmed by the coefficients from the model (). Compared to the majority base category not FSM-eligible, the student missing FSM data are less than half as likely to attain Level 2, and FSM-eligible students are less than one quarter as likely. On the other hand, income as such makes no discernible difference to the prediction (to two decimal places).
Table 9. Coefficient value.
The weak relationship between both predictors and attainment could be due to the biased and restricted nature of this dataset. The relationships are usually stronger (Gorard Citation2018). In summary, though, it is not clear here that income is a better predictor than FSM data, while FSM data is much more complete, long-term, and verified.
Conclusions
The NPD is an important resource for analysts in England, concerned with patterns of attainment and disadvantage at school. It is relatively complete, covers all pupils at state-funded schools, and is available for every cohort in every school grade back to 2002. The variables within NPD are largely verified administrative data. However, the main variable representing family income is being registered as eligible for FSM, and this simply divides pupils into a group of around 15% whose family are officially living in poverty and another group of around 85% who are not. The problems this threshold variable causes have been partly addressed by considering whether each pupil has ever been eligible, and also by considering the proportion of years at school a pupil has been known to be eligible. The latter approach has been shown to be very useful in both predicting and explaining subsequent attainment, and to be better than either current FSM or EverFSM (Gorard and Siddiqui Citation2019).
However, it is interesting to consider whether access to more nuanced family income data would be even more beneficial for policy, practice and research purposes. NS is an example of a single cohort dataset of only around 16,000 cases, based on largely self-reported values. It does have a range of wider variables for an analyst such as attitudes, parental education and occupation, and an estimate of household income. This paper has examined the extent to which income data, at a larger scale, could supplement or even supplant FSM when defining disadvantage at school.
A key empirical point is the extent of missing income data. Unless this were gathered and released via HMRC, self-reported income data will be incomplete and presumably less accurate. In addition, it is clear that the missing income data does not occur at random and must not be treated as missing at random by analysts. Not much can be done about this. Currently, FSM must be the preferred measure, being more complete and accurate, with a relatively simple legal definition. Using the largely missing and increasingly (over waves) biased measure of income in Next Steps as an example, our analysis calls into question the validity and so the usefulness of many analyses using income data based on these small cohort studies.
Another intriguing finding is how many children from families with reportedly low incomes are not listed as eligible for FSM. This may be due to other factors, or changes in status in the brief gap between the two data collections. It might be a real finding and an indictment of the FSM-eligibility registration process, or it could merely show the inaccuracy of self-reported income figures. This is an issue that would repay further investigation.
When the two measures of income are compared directly, they are obviously related, and so they are measuring some of the same variation in socioeconomic status between pupils. Both are (relatively weak) predictors of pupil attainment at school, and both could contribute additional accuracy to any prediction. Income is the better predictor for KS4 point scores, using the biased set of complete cases here. It is less relevant than FSM for predicting the threshold KS4 level 2 indicator.
The point is moot unless or until widespread individual/household income data is available. Until then FSM is a suitable and useful measure of disadvantage, especially when modified to represent the duration of poverty as we have suggested elsewhere (Gorard and Siddiqui Citation2019). Were income data to become more widely and freely available it would enhance the use of FSM without necessarily replacing it. And this could have beneficial implications for policy and practice judgements about school performance, school context, Ofsted inspections, the allocation of Pupil Premium funding, and contextualized admission to higher education, among others. However, linked income for individuals/households is an understandably sensitive issue for many citizens, and this is perhaps the greatest barrier to the use of income data for the purposes described. If FSM, taken to mean above or below a poverty line, is not accurate enough, and precise income details are too sensitive for widespread use, perhaps the next step for research is to decide on the best level of aggregation somewhere between these two extremes, that maximizes utility while minimizing risk.
Data citation
Centre for Longitudinal Studies. (2018). Next Steps: Sweeps 1–8, 2004–2016: Secure Access. 4th Edition. UK Data Service. SN: 7104, http://doi.org/10.5255/UKDA-SN-7104-4.
Acknowledgements
We acknowledge the support in accessing the data from UK Data Service. The use of these data does not imply the endorsement of the data owner or the UK Data Service at the UK Data Archive in relation to the interpretation or analysis of the data. This work uses research datasets which may not exactly reproduce National Statistics aggregates.
Disclosure statement
No potential conflict of interest was reported by the author(s).
Additional information
Funding
References
- Anders, J., 2012a. Using the longitudinal studies of young people in England for research into Higher Education access. DoQSS, Working Paper No.12-13, Institute of Education, University of London.
- Anders, J., 2012b. The link between household income, university applications and university admissions. Fiscal studies, 33 (2), 185–210.
- Baker, C., Wood, H., and Heptintsall, 2015. Matching the NPD to longitudinal studies (PPT presentation). Department for Education. Available from: https://www.bristol.ac.uk/media-library/sites/cmpo/migrated/documents/heptinstall12.pdf.
- Bee, A., and Mitchell, J., 2017. Do older Americans have more income than we think? (Vol. 39). SESHD Working Paper. Available from: https://www.census.gov/content/dam/Census/library/working-papers/2017/demo/SEHSD-WP2017-39.pdf.
- Bhattacharya, S., 2021. Intergroup contact and its effects on discriminatory attitudes evidence from India, WIDER Working Paper 2021/42, WIDER Working Paper 2021/42-Intergroup contact and its effects on discriminatory attitudes: evidence from India (unu.edu).
- Boliver, V., Gorard, S., and Siddiqui, N., 2021. Using contextual data to widen access to higher education. Perspectives: policy and practice in higher education, 25 (1), 7–13.
- Byrne, D., and Treanor, M., 2020. Income, poverty and deprivation among children – a statistical baseline analysis. Department of Children and Youth Affairs. https://www.gov.ie/en/publication/a1580-income-poverty-and-deprivation-among-children-a-statistical-baseline-analysis-july-2020/.
- Chmielewskia, A., 2019. The global increase in the socioeconomic achievement gap, 1964 to 2015. American sociological review, doi:10.1177/0003122419847165.
- D’Aurizio, L., et al., 2008. The under-reporting of households’ financial assets in Italy. IPM24 with IAOS: Measuring productivity, 415.
- Department for Education, 2013. Raising the participation age (RPA). London: DfE. Available from: http://webarchive.nationalarchives.gov.uk/20130321071322/https://www.education.gov.uk/publications/eOrderingDownload/01134-2009.pdf.
- Department for Education, 2018. Understanding school and college performance measures. Available from: https://www.gov.uk/government/publications/understanding-school-and-college-performance-measures [Accessed 17 Sept 2019].
- Department of Education (DfE), 2021. National Pupil Database-NPD debatable updates for October 2021. Available from: https://www.gov.uk/guidance/apply-for-department-for-education-dfe-personal-data#apply-to-dfe-for-access-to-dfe-personal-data-through-the-ons-srs.
- Dickerson, A., Maragkou, K., and McIntosh, S., Oct 2018. The causal effect of secondary school peers on educational aspirations, CVER Discussion Paper Series – ISSN 2398-7553. Available from: http://cver.lse.ac.uk/textonly/cver/pubs/cverdp017.pdf.
- Domina, T., et al., 2018. Is free and reduced-price lunch a valid measure of educational disadvantage? Educational researcher, 47 (9), 539–555.
- Education Endowment Foundation, 2017. The attainment gap, Available from: https://educationendowmentfoundation.org.uk/about/annual-reports/2011-2017/.
- Fairfield, T., and Jorratt De Luis, M., 2016. Top income shares, business profits, and effective tax rates in contemporary Chile. Review of income and wealth, 62 (S1). Available from: https://assets.publishing.service.gov.uk/media/57a089ed40f0b652dd000488/ICTD-WP17.pdf.
- Franck, E., and Nicaise, I., 2017. The effectiveness of equity funding in education in Western countries. Literature Review (Report no. 2/2017). Geraadpleegd via. Available from: http://nesetweb.eu/wp-content/uploads/NESETII_AHQ2.pdf.
- Gorard, S., 2012. Who is eligible for free school meals? Characterising free school meals as a measure of disadvantage in England. British educational research journal, 38 (6), 1003–1017.
- Gorard, S., 2018. Education policy: evidence of equity and effectiveness. Bristol: Policy Press.
- Gorard, S., 2020. Handling missing data in numeric analyses. International journal of social research methodology, 23 (6), 651–660.
- Gorard, S., 2021. How to make sense of statistics. London: SAGE.
- Gorard, S., 2022. Segregation and the attainment gap for permanently disadvantaged pupils in England. Educational review, doi:10.1080/00131911.2021.2007055.
- Gorard, S., and Siddiqui, N., 2019. How trajectories of disadvantage help explain school attainment. SAGE open, 9 (1), 1–14.
- Gov.uk, 2010. Government announces pupil premium to raise achievement. Available from: https://www.gov.uk/government/news/government-announces-pupil-premium-to-raise-achievement.
- Hanushek, E.A., et al., 2019. The achievement gap FAILS TO CLOSE: half century of testing shows persistent divide between haves and have-nots. Education next, 19 (3), 8.
- Hawkes, D., Plewis, I., and Verropoulou, G., 2008. Missing income data in the Millennium Cohort Study: Evidence from the first two sweeps. Available from: http://www.cls.ioe.ac.uk/library-media/documents/CLS_WP_2008_10_(1).pdf.
- Hewstone, M., et al., 2018. Influence of segregation versus mixing: intergroup contact and attitudes among White-British and Asian-British students in high schools in Oldham: England. Theory and research in education, doi:10.1177/1477878518779879.
- Hobbs, G., and Vignoles, A., 2010. Is children’s free school meal ‘eligibility’ a good proxy for family income? British educational research journal, 36 (4), 673–690.
- Ilie, S., Sutherland, A., and Vignoles, A., 2017. Revisiting free school meal eligibility as a proxy for pupil socio-economic deprivation. British educational research journal, 43 (2), 253–274.
- Iniesta-Martinez, S., and Evans, H., 2012. Pupils not claiming free school meals. Available from: http://dera.ioe.ac.uk/16039/1/DFE-RR235.pdf.
- Jenkins, S.P., 2010. The British household panel survey and its income data. Available from: https://www.iser.essex.ac.uk/files/iser_working_papers/2010-33.pdf.
- Johnson, D.T., and Scutella, R., 2003. Understanding and improving data quality relating to low-income households. Available from: https://www.dss.gov.au/sites/default/files/documents/05_2012/prp24.pdf.
- Lee, D., and Lemieux, T., 2010. Regression discontinuity designs in economics. Journal of economic literature, 48 (2), 281–355.
- Lessof, C., et al., 2018. Understanding KS4 attainment and progress: evidence from LSYPE2. Research report. DFE. Available from: https://assets.publishing.service.gov.uk/government/uploads/system/uploads/attachment_data/file/748514/Understanding_KS4_LSYPE2_research-report.pdf.
- Lord, A., Easby, J., and Evans, H., 2013. Pupils not claiming free school meals. DfE. Available from: https://assets.publishing.service.gov.uk/government/uploads/system/uploads/attachment_data/file/266339/DFE-RR319.pdf.
- Paulus, A., 2015. Income underreporting based on income expenditure gaps: Survey vs tax records (No. 2015-15). ISER Working Paper Series. Available at Paulus, A. (2015). Income underreporting based on income expenditure gaps: Survey vs tax records (No. 2015-15). ISER Working Paper Series.
- Shadish, W., Cook, T., and Campbell, D., 2002. Experimental and quasi-experimental designs for generalized causal inference. New York: Houghton Mifflin Company.
- Siddiqui, N., 2017. Socio-economic segregation of disadvantaged children between schools in Pakistan: comparing the state and private sector. Educational studies, 43 (4), 391–409.
- Siddiqui, N., Boliver, V., and Gorard, S., 2019. Reliability of longitudinal social surveys of access to higher education: the case of next steps in England. Social inclusion, 7 (1), 80–89.
- Storey, H., et al., 2011. A randomized controlled trial of the effect of school food and dining room modifications on classroom behaviour in secondary school children. European journal of clinical nutrition, 65, 32–38.
- Taylor, C., 2018. The reliability of free school meal eligibility as a measure of socio-economic disadvantage: evidence from the millennium cohort study in Wales. British journal of educational studies, 66 (1), 29–51.
- The Guardian, 2003. Extra £1bn pledged to cut child poverty, The Guardian, 11/12/2003. Available from: https://www.theguardian.com/society/2003/dec/11/socialexclusion.budget2004.
- The Sutton Trust-Education Endowment Foundation Teaching and Learning Toolkit, 2015. The pupil premium next steps. Pupil Premium: Next Steps - Sutton Trust.
- Yang, Z., 2019. Measurement of childhood poverty in the United States and its enduring influences. Journal of sociology and social welfare, 46 (2), 47–73.