
ABSTRACT
A dent is one of the main structural damages that may affect ultimate strength. In this paper, the residual ultimate strength of dented metallic pipes subjected to a bending moment is quantitatively investigated. The numerical model is developed accounting for the variation of the dent length (ld), dent depth (dd), dent width (wd), dent rotation angle (θd) and dent location based on ABAQUS Python. The numerical model is validated by test results from a four-point bending test. Subsequently, a parametric investigation is performed on the effects of wave-type initial imperfection, D/t and dent geometrical parameters. It is found that both ld and dd have a significant effect on the residual ultimate strength of dented metallic pipes, while the effect of wd is slight. Finally, an empirical formula with respect to ld and dd has been proposed for the prediction of bending moment, which can be deployed for practical purposes.
Nomenclature
| κ | = | the curvature of pipe (1/m) |
| κ0 | = | the referential curvature of pipe (1/m) |
| κcr | = | the critical curvature of pipe (1/m) |
| λl | = | normalised dent length |
| λw | = | normalised dent width |
| λcl | = | critical half-wavelength |
| ω | = | dent depth variation (mm) |
| σu | = | material ultimate tensile strength (MPa) |
| σy | = | material yielding strength (MPa) |
| σ11 | = | stress component in pipe axial direction (MPa) |
| σ22 | = | stress component in pipe hoop direction (MPa) |
| σeng | = | engineering stress of material (MPa) |
| θd | = | dent angle (deg) |
| ϵ0 | = | referential strain of pipe |
| ϵ11 | = | strain component in pipe axial direction |
| ϵ22 | = | strain component in pipe hoop direction |
| ϵeng | = | engineering strain of material |
| D | = | outer diameter of pipe (mm) |
| dd | = | dent depth (mm) |
| eu | = | the maximum elongation of material |
| l′d | = | dent length projected in pipe hoop direction (mm) |
| L0 | = | length of pipe under pure bending (mm) |
| ld | = | dent length (mm) |
| Mi | = | ultimate bending moment of intact pipe (kNm) |
| My | = | plastic bending moment (kNm) |
| Mcr | = | residual ultimate bending moment (kNm) |
| n | = | material constant |
| R | = | pipe outer radius (mm) |
| t | = | pipe thickness (mm) |
| Ulateral | = | the maximum lateral displacement of pipe (mm) |
| wd | = | dent width (mm) |
1. Introduction
Structural damage in terms of a dent, metal loss and/or a crack on metallic pipes is unavoidable in engineering structures (Yang et al. Citation2007; Manes et al. Citation2012; Ghaednia et al. Citation2015; Zhang et al. Citation2015; Cai, Jiang, & Lodewijks Citation2017). The occurrence of damage could undermine structural integrity and strength, which may induce detrimental consequences. Meanwhile, with the widely applied limit state-based design (Paik and Thayamballi Citation2006; DNV Citation2013; Gong et al. Citation2013), every foreseeable failure scenario should be accounted for so that structures have sufficient load carrying capacity to afford potential structural damage. Hence, the residual ultimate strength of damaged structures should be carefully investigated. As one of the major structural damage, a dent could be introduced by accidental scenarios such as collision with foreign objects including rocks, anchors and fishing trawl boards (Park and Kyriakides Citation1996; DNV Citation2010). It is a permanent plastic deformation on a pipe wall that produces a gross distortion (Cosham and Hopkins Citation2004).
The past few decades have seen a considerable amount of research on residual ultimate strength of dented metallic pipes. Park and Kyriakides (Citation1996) studied the collapse capacity of dented pipes under external pressure. The research found that the collapse capacity of pipes was relatively insensitive to the detailed geometry of a dent such as the shape and size, but was critically dependent on the maximum ovalisation of its most deformed cross-section. Orynyak et al. (Citation1999) developed an analytical equation to predict the bursting strength with respect to dimensionless length of dent (). Bjørnøy et al. (Citation2000) investigated the bursting capacity of dented pipes subjected to internal pressure through experiments. A plain dent was introduced through a quasi-static indentation. Test results showed that significant reduction of the bursting capacity could be caused by a dent. When pipes are subjected to bending moment, Bai and Bai (Citation2014b) proposed some empirical equations to predict the limit bending moment. Cai et al. (Citation2016) numerically investigated dented pipes under dominant bending moment with axial force and internal pressure. Additionally, standards such as BSI (Citation2005) and DNV (Citation2013) have proposed relevant information for dented pipes to guide the design. Other relevant research on dents and other types of damage can also be seen from Macdonald and Cosham (Citation2005), Gresnigt et al. (Citation2007), Mohd et al. (Citation2014), Ghaednia et al. (Citation2015), Mohd et al. (Citation2015), Lee et al. (Citation2017), etc.
However, few fundamental research have been found on residual ultimate strength of dented pipes with D/t between 20 and 50 subjected to bending moment, which is a typical loading condition during pipe installation and operational phases (Kyriakides and Corona Citation2007). Simple formulas for prediction of the residual ultimate strength of dented pipes subjected to pure bending are still rare (Paik and Thayamballi Citation2006). The effects of dent parameters such as dent length (ld) and dent depth (dd) have not been quantitatively clarified. Based on the previous experimental research from the authors Cai, Jiang, Lodewijks, and Pei, et al. (Citation2017), dented pipes with low D/t (around 21.3) have been studied. The aim of this paper is therefore to quantitatively investigate the residual ultimate strength of dented metallic pipes (D/t of 21.3) subjected to pure bending moment through nonlinear finite element method (FEM).
The structure of this paper is arranged as follows. In Section 2, geometric profile of dents is described in detail, while the finite element model is presented in Section 3. Then the model is validated based on tests in Section 4. The four-point bending test is first briefly reviewed, and the comparison results for dented specimens in terms of failure mode, strain distribution and bending-curvature diagram are presented. In Section 5, parametric investigation on the effects of initial imperfection, D/t, dent location and dent parameters on pipe strength is performed, and the corresponding strain distributions are presented. Based on these results, a prediction formula is proposed in Section 6. Finally, concluding remarks are made.
2. Damage description
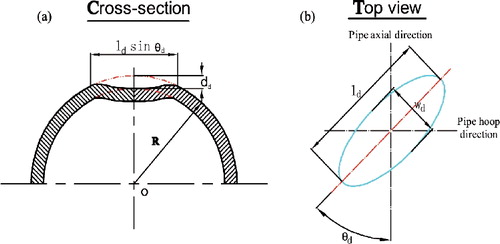
A dent is a permanent plastic deformation on pipe wall that produces a gross distortion. In this paper, only a plain dent with a smooth curvature variation is accounted for, including the dent parameters in terms of dent length (ld), dent width (wd), dent depth (dd), dent angle (θd) and dent location, as shown in . The location of a dent is the centre of pipe cross-section on either the compression side or the tensile side of the pipe surface. The dent shape is postulated as a cosinusoidal shape, as expressed in Equation (Equation1(1) ), where ω is the depth variation of the dent. In addition, the dent angle is defined as the angle between the dent axis in its length direction and the pipe axial direction, increasing along clockwise direction, as seen in (b). Hence, a dent with the angle of 0° runs in the pipe's longitudinal direction. The ld should be always larger than wd in order to avoid ambiguity in this paper. In spite of the existing of impact induced residual stress around the dent region in practice, it has not been accounted for in this research due to the lack of test data. Based on the former research from the authors in Cai et al. (Citation2016), its effect has been qualitatively investigated. Followed by a modelling of impact scenario between a pipe and a foreign object, residual ultimate strength of damaged pipes was then directly simulated through the import of residual stress. Only slight effect on pipe strength in terms of the bending moment has been observed.
(1)
Figure 1. Sketch of a plain dent on pipe surface: (a) dent cross-section; (b) top view. (This figure is available in colour online.)
There are two aspects that determine the selection of the dent size in this paper: On the one hand, a tiny dent could be considered as the initial imperfection. On the other hand, an extra large dent may induce sudden collapse of the structure, which is meaningless to take into account. Hence, the selected dd/t in the following research is between 0.13 and 2.0, and the normalised dent length is between 0.4 and 5.0.
3. Finite element model
A numerical model of a pipe with dent ( and ) is developed in ABAQUS/Standard (Abaqus6.13 Citation2013) through python for the simulation of dented pipes, accounting for the varying of dent length (ld), dent depth (dd), dent width (wd), dent rotation angle (θd) and dent location. Some simplifications have been made in this model compared with the test configuration (description in Section 4). For instance, only the pipe segment under pure bending is accounted for. Two reference nodes (O and O′) coupled with the respective pipe end cross-section have been introduced to represent the loading locations, exerting an equivalent forced-rotation with a uniform angle of 0.001 in every increment. In this way, a uniform bending moment is introduced, which can produce the same loading procedure as the four-point bending test. The dent is put on the central cross-section of pipes.
Figure 2. Sketch of dented pipe subjected to pure bending moment.
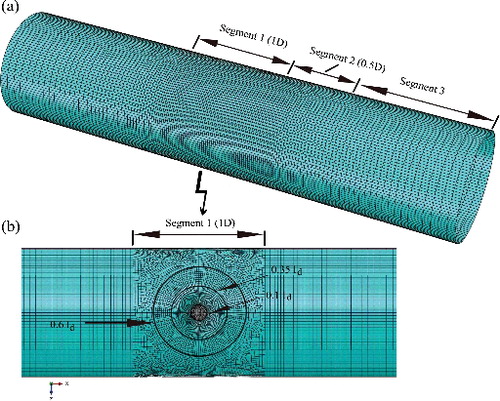
Figure 3. FEA model of dented pipe: (a) general mesh distribution; (b) refined dent region. (This figure is available in colour online.)
A simply supported boundary condition is deployed in this model. Rotations along X and Y axis at both pipe ends are restricted so that no torsion would be induced during simulation. All the translations are restricted in the pipe end O (), while the axial translation is set to free in the other end O′ so that no extra axial force would be induced. The symmetry of model has not been introduced due to the occurrence of dent. The principal dimensions of pipe model for the following parameter studies are summarised in . Initial imperfection in terms of a wave-type (wrinkling) is accounted for in this model based on a similar pipe research by Es et al. (Citation2016) and Vasilikis et al. (Citation2015). The imperfection is obtained from a standard eigenvalue simulation of a pipe, in the form of its first-order buckling mode with an amplitude of 0.01t (typical value from 0.01t to 0.12t as reported in Es et al. Citation2016).
Table 1. Principal dimension of pipe models for simulation.
The cylindrical shell is modelled with a curved three-dimensional shell element (S8R5), which is an 8-node, quadrilateral element with reduced integration and five degrees of freedom in each node (three displacement components and two in-surface rotation components), providing an accurate and economical simulation. The mesh strategy of the finite element analysis (FEA) model is shown in , partitioning the entire model into three different segments. The length of central segment (segment 1) is set to 1D (D is outer diameter of pipe) with the maximum element size of 3 and 4 mm in pipe longitudinal and hoop direction, respectively, i.e. less than 9% of the critical half-wave length ( (Prabu et al. Citation2010)). Segment 2 is a mesh transition region with a length of 0.5D, arranging with a biased mesh, while segment 3 has a coarse distribution of mesh with the maximum element size of 12 mm.
In the damaged region, as illustrated in the zooming in region in (b), mesh is largely refined. The geometry of this region is further partitioned into three concentric circular regions, with the radius of 0.1ld, 0.35ld, and 0.6ld, respectively. The aim of such mesh strategy is to fashion a well-organised mesh distribution so that the possible artificial local bending stress and stress concentration would be avoided. The maximum mesh size of inner circle is strictly limited within 2 mm with a structured mesh strategy, i.e. less than 4% of one half-wave length λcl of cylindrical shells. The maximum mesh size of outer regions is limited within 3 mm with a sweep mesh strategy, i.e. more than 14 elements in one critical-half wavelength.
3.1. Material properties
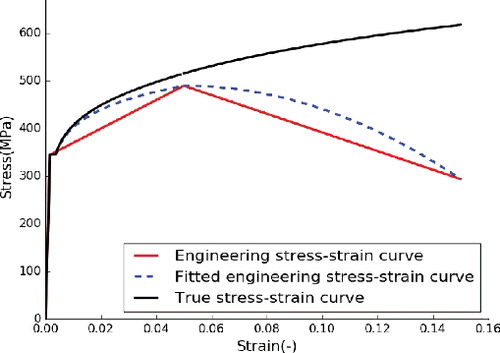
A typical pipe material Q345B (GB/T 1591 Citation2008) is deployed, which is a type of pipe structural steel with high strength and large ductility. An elastic–plastic property with Von Mises yielding criterion and isotropic hardening is deployed. The strain-hardening effect of material is developed by the Ramberg–Osgood equation (Ramberg and Osgood Citation1943) based on measured material parameters from the test, as seen in Equation (Equation2(2) ). Where n is the material constant, ϵeng and σeng are the engineering strain and stress, respectively. It should be noted that an assumption of 0.002 plastic strain for ductile material at yielding point is made in this equation.
(2)
The true stress–strain curve used in the numerical simulation is shown in , which is fitted through basic material properties including the material yielding strength σy, ultimate tensile strength σu and the maximum elongation eu with an assumption that σy, σu and material failure happen on the strain of 0.002, eu/3 and eu, respectively (Pakiding Citation2007; Cai et al. Citation2016). In the following research of dent parameters in Section 5, the σy, σu and eu are assumed as 345 MPa, 490 MPa and 0.15 (except the model validation by test in Section 4), respectively.
Figure 4. The fitted true stress-strain curve for numerical investigation. (This figure is available in colour online.)
4. Model validation
In this section, simulations for test specimens are carried out based on the developed numerical model in the previous section. The prediction model has been validated through the comparison between numerical results and test data.
4.1. Reference values
Generally, bending moment is normalised by the plastic bending moment My = 4R2tσy, while the curvature κ is normalised by a curvature-like expression κ0 = t/4R2. Only global curvature is used for comparison afterwards between the test and numerical simulation. The selected locations for calculation of global curvature in simulation are exactly the same with tests, while the bending moment is the resultant of all the node forces multiplying their corresponding force arms in the central cross-section of specimen in simulation. The bending moment Mi from intact pipe is used as the reference value for the proposed formula in Section 6.
4.2. Test description
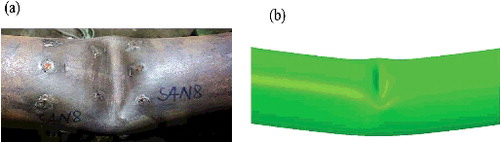
In order to investigate the residual ultimate strength of damaged pipes, a four-point bending test has been successfully designed and carried out. The configuration of test set-up is presented in , which consists of different structural segments. The overall length of the specimen is 2200 mm with the length of 800 mm under pure bending. The test results were measured and documented extensively. The structural damage was introduced properly on each specimen before the strength test, locating at the centre of specimen either on the compression side or on the tensile side. Different types of indentors were designed and fabricated to produce dents with varied shape. Through a quasi-static indentation, the dent was then introduced on the specimens with different rotation angle such as 90°, 45° and 0°. shows the introduced dent damage from both test and the corresponding numerical models, while lists the detailed information of the dented specimens.
Figure 5. Configuration of four-point bending test set-up in laboratory. (This figure is available in colour online.)

Figure 6. Dent damage from both test and numerical models: (a) artificial dent damage on specimen; (b) dent damage on numerical model. (This figure is available in colour online.)
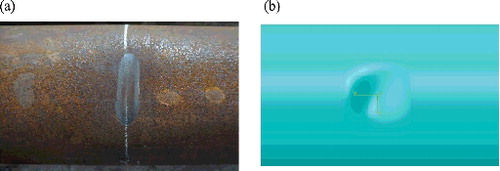
Table 2. Summary of both test and simulation results on dented specimens (dimension unit: mm; angle unit: degree; dents are on the compression side of specimens).
It should be noted that the developed numerical model in this paper is not exactly the same as the real test configuration, but is simplified in a reasonable way. For instance, the model has been simplified by only keeping the pure bending segment. An equivalent simply supported boundary condition is used to represent the real boundary, ignoring the real frictions between specimen and loading strips. A displacement-control loading strategy is employed instead of the load-control strategy in the test. The material that deployed is type ‘L7’ from the test.
4.2.1. Structural failure mode
The comparison of structural failure modes is illustrated in . The result shows that a similar failure mode from simulation has been induced in the local dented region. As a result of the increase of structural deformation in the form of ovalisation in pipe cross-sections, the specimen subjected to increasing bending moment fails. Under certain extent, such ovalisation can be counterbalanced by material yielding and further hardening of material so that structure keeps stable. When the ovalisation cannot be compensated for, the structure reaches its bending capacity with the largest ovalisation in a specific pipe cross-section. For the pipe with a dent, the failure initiates and propagates in the dent region in the form of an inward bulge.
Figure 7. Comparison of failure mode between test and simulation (S2N1). (This figure is available in colour online.)
The failure of the structure is also reflected by the variation of strain, as illustrated in . The test results from the measurement of strain gauges in specific points and corresponding stages are presented. It shows the evolution of both axial strain (ϵ11) and hoop strain (ϵ22) along the pipe longitudinal path and the hoop path across the dent centre (the chord length of CD is 120 mm), respectively. The strain here is normalised by ϵ0, which can be expressed as ϵ0 = κ0D/2. It is observed that the occurrence of a dent has changed the strain distribution from the beginning stage, and a localisation of strain happens in the dented region, concentrating on both the dent centre and the dent edge ((c,d)).
Figure 8. (a) Sketch of representative paths on specimen surface (S2N1); (b) four stages during the loading procedure; (c) strain along the longitudinal path AB; (d) strain along the hoop path CD. (This figure is available in colour online.)
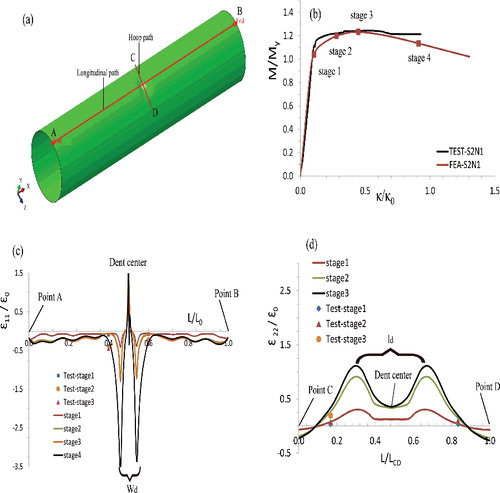
Most of the strains measured from test lie on or close to the prediction curves. However, discrepancy exists due to the limit measurement range of stain gauges (±3%), workmanship of gauge and the possible effect of shear force that was introduced by loading heads. For the hoop strain ϵ22, as shown in (d), it starts with a small compression value on point C in the beginning stage outside the dent region, and then turns to a large tensile value inside the dent region, decreasing all the way to the dent centre. This phenomenon implies the fashion of the inward bulge and the increasing tendency of the ovalisation in the dented cross-section.
4.2.2. Moment-curvature diagrams
The representative bending moment-curvature diagrams for the comparison between test data and numerical prediction are presented in . lists all the comparison results in terms of bending moment and critical curvature. Three specimens (S2N1, S2N2 and S2N5) contain dent in 90° on the compression side, while the specimen S2N3 contains dent in 45° on the compression side.
Figure 9. Comparison between numerical and test results in terms of bending moment-curvature diagram for specimens with dent: (a) specimen S2N2 with 90° dent on compression side; (b) specimen S2N3 with 45° dent on compression side; (c) specimen S2N5 with 90° dent on compression side. (This figure is available in colour online.)
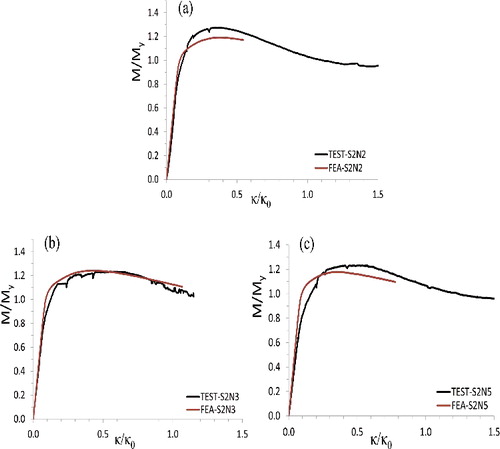
The diagrams show a satisfying prediction from the numerical simulations in terms of failure tendency and maximum bending moment, i.e. less than 6.5% discrepancy compared with the test. A relatively large scatter occurs on the critical curvature, i.e. the largest discrepancy of −38.42% in specimen S2N5. However, the prediction for curvature is conservative, which is due to the ignorance of frictions of test configuration in the simplified boundary condition of numerical model used in this paper. Moreover, factors such as material properties, as discussed in the experimental investigation (Cai, Jiang, Lodewijks, & Pei, et al. Citation2017), are also related to the discrepancies. Accounting for these reasons, it is safe to conclude that the developed simplified numerical model is capable of predicting the bending behaviour of pipes with a conservative prediction.
Additionally, both numerical predictions and test data indicate that the elastic–plastic failure pattern is dominant with a relative smooth failure of specimen, and significant plastic effect happens with the bending capacity (Mcr) exceeding plastic bending moment My. For the damaged specimen, Mcr is more than 1.12 times of My based on the simulation predictions. The occurrence of a dent has changed the variation tendency of bending moment-curvature diagrams, initiating a rapid failure of specimen and considerably reducing the critical bending curvature.
5. Parametric investigation
Through the validated numerical model, different parameters of pipes will be investigated in the present section. Specifically, the effects of diameter-to-thickness ratio (D/t), dent location, dent angle (θd), dent length (ld), dent depth (dd) and dent width (wd) are investigated. Numerical results in terms of residual ultimate bending moment (Mcr), critical curvature (κcr), lateral displacement (Ulateral) and stress distribution are presented and discussed. The principal dimensions of pipe model are summarised in .
5.1. Initial imperfection
In practice, the initial imperfection on pipe structures in terms of ovalisation or wrinkling exists due to constructions, external water, bending moment or other relevant causes. From the standpoint of the pipe design, the minimum value of 0.5% for pipe ovalisation is used in DNV (Citation2013). However, the initial imperfections normally allowed in pipeline design do not significantly influence the moment capacity under pure bending (Hilberink Citation2011; Bai and Bai Citation2014a), especially for the seamless pipes with lower D/t. Hence, the simulation results on the damaged pipes would not be affected by neglecting such imperfection.
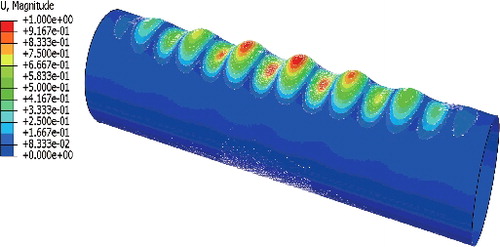
In spite of the insignificant effect, an investigation of the initial imperfection in terms of wrinkling is still conducted. Hence, five different amplitudes, varying among 0.1t, 0.05t, 0.02t, 0.01t and 0.001t, are deployed, while the specific shape of imperfection is in the form of the first-order of the eigenvalue buckling modes, as illustrated in .
Figure 10. The first eigenvalue-buckling mode of a perfect pipe subjected to pure bending. (This figure is available in colour online.)
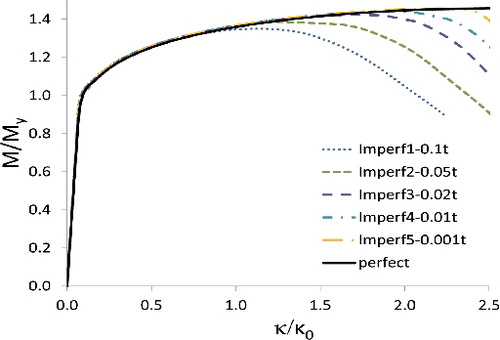
shows the bending moment-curvature diagram with varying of initial imperfections for an intact pipe without damage. Results indicate that both the bending moment and corresponding critical curvature vary with the variation of initial imperfection, decreasing with the increase of imperfection amplitude. The occurrence of the initial imperfection can accelerate the failure of the structure. The effect on critical curvature is slight when the wrinkling amplitude is no larger than 0.02t. However, only a slight effect on the bending moment has occurred, which demonstrates the former statement.
Figure 11. Bending moment-curvature diagram of a pipe with varying of initial imperfection (no dent damage). (This figure is available in colour online.)
5.2. Effect of diameter-to-thickness ratio (D/t)
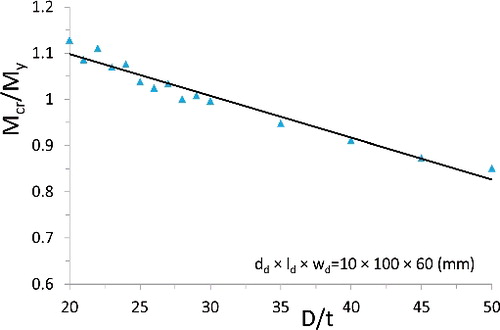
As one of the critical parameters, the pipe diameter-to-thickness ratio (D/t) affects the residual ultimate strength and corresponding failure mode of metallic pipes. With the decrease of the D/t ratio, the failure mode of structures will gradually change from an elastic buckling to an elastic–plastic buckling or even fracture failure. presents the variation of normalised bending capacity with respect to D/t between 20 and 50. A plain dent is postulated in the pipe centre on the compression side of the pipe surface. All the dent angles are set to 90° (the pipe hoop direction). It is found that, with the increase of the D/t, the residual strength of a dented pipe decreases approximately in a linear way.
Figure 12. The bending capacity of a dented pipe with varying of D/t. (This figure is available in colour online.)
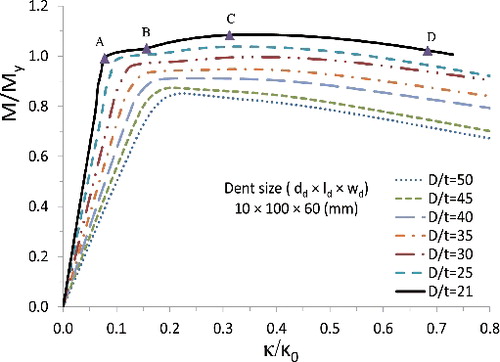
denotes the normalised bending moment-curvature diagram of dented pipes with varying of D/t ratio. The curvatures here are calculated from the longitudinal strain (ϵ11) on the bottom of pipe central cross-section (κ = 2ϵ11/D). It implies that different failure modes have happened, for instance, for a pipe with D/t of 21, the elastic–plastic failure happens with Mcr = 1.09My, whereas for pipe with D/t = 50, elastic buckling happens with a small ultimate bending moment, equal to 0.77My. The structure fails smoothly with the increase of bending moment for pipes with D/t = 21. Structure first reaches the linear limit point, as seen from Point A. Then, the plastic deformation starts to occur and expanding until Point B due to the material hardening effect. When the bending energy is keeping accumulation, the limit point C has been reached. Afterwards, the strength capacity of pipes does not increase anymore, but gradually decreases with the rapid increase of plastic deformation until the critical collapse point D has been reached. In contrast, for pipes with large D/t, a sudden collapse happens once the limit point has been reached, as seen in the dotted curve of D/t = 50.
Figure 13. Bending moment-curvature diagram with varied diameter-to-thickness ratio (D/t). (This figure is available in colour online.)
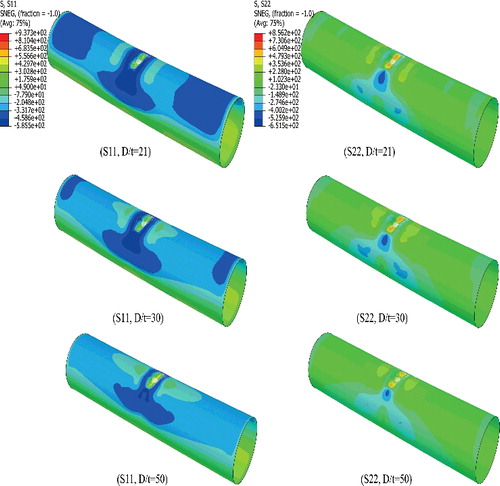
shows the membrane stress distribution of a dented pipe with different D/t including 21, 30 and 50 at the ultimate bending point. σ11 and σ22 are the stress components in the pipe axial direction and hoop direction, respectively. It is found that the stress distribution has been largely changed due to the occurrence of dent damage. It is also observed that a high compression stress region occurs at the dent tip, while a low tensile stress region occurs adjacent to the dent in the pipe longitudinal direction. With the decrease of the D/t ratio, such high stress region is prone to increase, whereas the low stress region is prone to concentrate. The overall plastic region at the ultimate bending point with small D/t is much larger than the one with large D/t.
Figure 14. Membrane stress distribution of a dented pipe with different diameter-to-thickness ratio at the ultimate bending point. (This figure is available in colour online.)
5.3. Effect of dent location
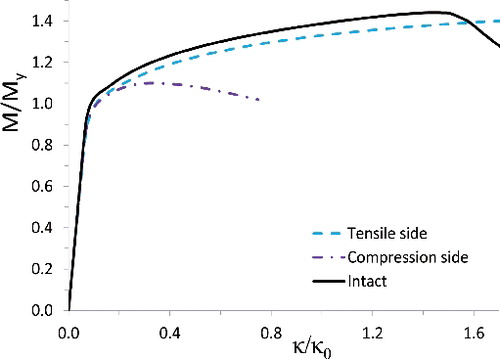
is the normalised bending moment-curvature diagram of pipes with varying of the dent location. The dent angle is set to 90° (pipe hoop direction) with a dent length of 100 mm and a width of 60 mm. It is found that a dent on the compression side has produced a significant negative effect on structure strength in terms of the maximum bending moment and critical curvature, whereas a dent on the tensile side only has a slight negative effect on the bending moment compared with the intact case. The critical curvature has been enlarged due to the recovery of the dent on the tensile side, which conforms to the observation in test. However, it should be noted that the fracture failure has not been accounted for in this paper, which may dominate the behavior of pipes with a dent on their tensile side.
Figure 15. Bending moment-curvature diagram of pipes with varying of the dent location (ld = 100 mm, wd = 60 mm). (This figure is available in colour online.)
5.4. Effect of dent orientation
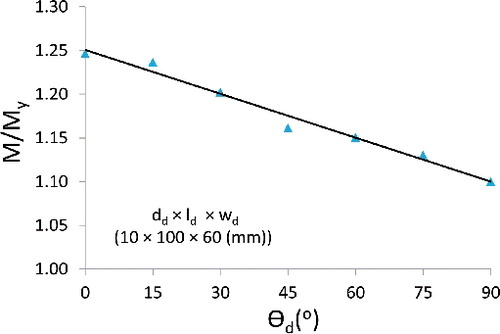
The dent orientation also affects the load carrying capacity of damaged pipes. shows the diagram with respect to the critical bending moment and dent angle. A moderate dent (dd × ld × wd = 10 × 100 × 60 mm) is postulated in pipe surface on the compression side. As demonstrated by the simulation results, the larger the dent rotation angle (θd) is, the smaller the residual ultimate strength will be. In other words, a pipe with a hoop dent on its compression side is the most critical condition for the bending capacity.
Figure 16. The bending capacity of a dented pipe with varying of dent rotation angle. (This figure is available in colour online.)
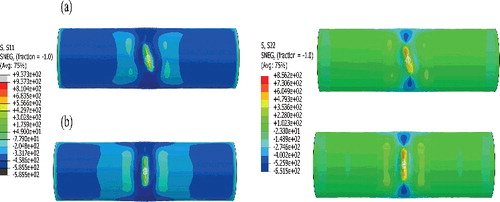
shows the membrane stress distribution of a dented pipe with the varying of the dent rotation angle. Only two angles are presented for clarity reason. The highest stress happens inside the dent. There is a low compression stress region in terms of σ11 along the pipe longitudinal direction, whereas a large tensile stress in terms of σ22 occurs at the dent tips. With the increase of the dent rotation angle, the compression region is increasing and the distributions of both stress components become uniform.
Figure 17. (a) Membrane stress distribution of a dented pipe with dent rotation angle θd = 45° at the ultimate bending point; (b) membrane stress distribution of a dented pipe with dent rotation angle θd = 90° at the ultimate bending point. (This figure is available in color online.)
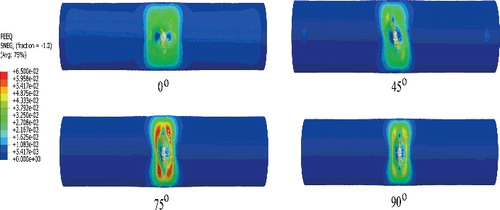
illustrates the variation of the equivalent plastic strain (PEEQ) region of a dented pipe with varied θd at the ultimate limit point. The PEEQ, as a function of the plastic strain, is a scalar measurement of the accumulated plastic strain, which is equivalent to the Mises stress. The range of the legend for PEEQ here is between 0% and 6.5%. It is found that, with the increase of dent angle, the plastic region gradually concentrates, fashioning four regular lobes adjacent to the dent. Structure fails as a consequence of the extra large and concentrated plastic strain.
Figure 18. Equivalent plastic strain (PEEQ) of a dented pipe with varying of dent rotation angle (θd) at the ultimate bending point. (This figure is available in color online.)
5.5. Effect of dent depth
By changing the dent parameters, a series of numerical simulations on dented pipes are carried out to identify their effects. The simulation results are presented in –. As shown in (a), the residual strength decreases rapidly with the increase of dd/t, and the ovalisation in terms of the largest lateral displacement has an increasing tendency with the increase of dd/t. It can be also seen in that, the larger the dent depth, the larger the ovalisation will be. For instance, the lateral displacement reaches the largest value 4.273 mm at the strength limit point at dd = 15 mm. In contrast, the lateral displacement is only 1.38 mm at dd = 2 mm. It is also observed that, with the increase of the dent depth, the location with the largest lateral displacement is gradually moving to the dent tip region.
Figure 19. The structural response in terms of bending capacity and maximum lateral displacement of pipe with varying of different parameters: (a) dented pipe with varying of dent depth; (b) dented pipe with varying of dent length; (c) dented pipe with varying of dent width. (This figure is available in colour online.)
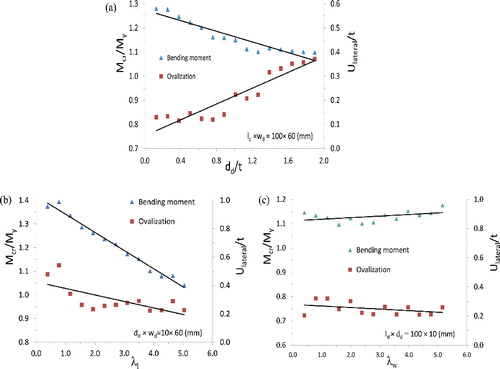
Figure 20. Lateral displacement distribution of a dented pipe with the varied dent depth dd at the residual limit point. (This figure is available in color online.)
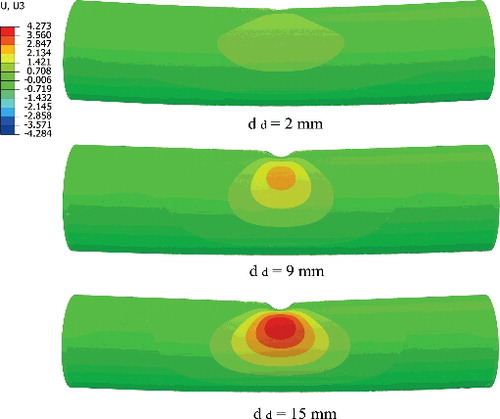
Table 3. Residual ultimate strength of pipes with varying of dent depth.
Table 4. Residual ultimate strength of pipes with varying of dent length.
Table 5. Residual ultimate strength of pipes with varying of dent width.
5.6. Effect of dent length
The dent length significantly influences the pipe residual strength, as shown in (b). The bending capacity decreases with the increase of dent length. Meanwhile, the ovalisation capacity in terms of the largest lateral displacement in the central cross-section of pipe decreases from 0.5t to 0.2t with the increase of ld, and keeps nearly stable when the dent dimensionless length () is larger than 0.3.
5.7. Effect of dent width
The dent width in the pipe longitudinal direction has an insignificant effect on the pipe residual strength subjected to pure bending. (c) shows the effect of dent width and the corresponding largest lateral displacement in the central dented cross-section with the varying of wd. It is obvious that the strength capacity only has a slight variation in each case.
6. Prediction equations
As discussed in the previous section, the dent length and dent depth are two critical parameters that affect the residual ultimate strength of a dented metallic pipe subjected to pure bending. Due to the insignificant effect of the dent width, it has not been taken into account in the proposed equation. Hence, it is reasonable to construct an empirical equation in the function of and dd/t, as expressed in the following equation:
(3) where l′d is the projected length of the dent in the pipe hoop direction in order to account for the effect of dent angle (
).
A regression analysis is carried out based on the FEM results. The fitted coefficients for residual bending moment are obtained as a consequence.
(4)
Where η, a1 and a2 are 0.076, 0.346 and 0.716, respectively. Analysis of variance (ANOVA) shows that the R square of the proposed formula is 0.935, which indicates that it has a satisfying fit.
explicitly presents the prediction accuracy of the formula based on the comparison to the test and numerical results. As seen in (a), a good correlation is obtained between empirical prediction and FEM, where the abscissa denotes the normalised proposed results from Equation (Equation4(4) ), the ordinate denotes the normalised results from both FEM and test. Here, the Mi for the test is from specimen S1N4 (Mi = 102.71 MPa), while it is 101.014 MPa from an intact pipe based on numerical simulation. Compared to the test data, the formula provides a conservative prediction. Moreover, a diagram of prediction by using the formula is presented with the variation of dent length (λl), as seen in (b). A high agreement between each other can be seen.
Figure 21. Comparison of model accuracy: (a) comparison between predictions and both test and simulation results (Mcr/Mi); (b) prediction of strength with varying of dent parameter (λl).
Practically, the proposed formula can be used for the prediction of the bending capacity of a metallic pipe with an existing dent on its compression side. The suitable application domain for this formula is λl between 0.4 and 5.0, and dd/t between 0.13 and 2.0. It should be noted that we have not proposed an empirical equation for the critical curvature due to the existence of large scatters during test validation in Section 4. It will be further investigated in the following research of the authors.
7. Conclusion remarks
In this paper, the residual ultimate strength of a dented metallic pipe (D/t of 21.3) subjected to pure bending has been quantitatively investigated based on nonlinear FEM. A numerical model has been developed and validated by test results, capable of predicting residual strength of dented pipe in terms of bending capacity. The effects of dent variables including dent location, dent length (ld), dent depth (dd), dent width (wd) and dent angle (θd) have been identified. An empirical formula for predicting the bending capacity of dented pipes accounting for the critical dent parameters has been proposed. Based on the performed work, the following conclusions can be drawn:
| – | The comparison results between the predictions from the proposed formula and both the test and FEM results show a satisfying fit. It can be used for practice purposes. | ||||
| – | A dent on the compression side of pipe surface has negative effect on its residual strength, whereas the effect is small when it is on the tensile side. | ||||
| – | For dent angle (θd), the larger the dent rotation angle is, the smaller the residual ultimate strength will be. It is found that a pipe with a hoop dent (90°) on its compression side has the largest effect on strength. | ||||
| – | For the projected dent length (l′d) (in 90°), it significantly affects the residual strength of dented metallic pipes, decreasing with the increase of its dimensionless length. | ||||
| – | The dent depth (dd) significantly affects the residual strength of dented metallic pipes. With the increase of the dent depth, the strength decreases rapidly. | ||||
| – | The dent width(wd) in pipe longitudinal direction has an insignificant effect on the pipe residual strength. | ||||
| – | With the decrease of D/t ratio, the failure mode of pipes under bending gradually changes from an elastic buckling to an elastic–plastic failure. | ||||
| – | The ovalisation in terms of the lateral displacement in the critical cross-section of dented pipe has an increasing tendency with the increase of dent depth, whereas it is approximately stable with the increase of the dent width. | ||||
Acknowledgments
Thanks to the financial support of China Scholarship Council (CSC) [grant number 201406230001]. The funding for the tests provided by Section of Transport Engineering and Logistics, Department of Maritime and Transport Technology, Delft University of Technology, the Netherlands, and School of Transportation, Wuhan University of Technology, PR China, is also appreciated.
Disclosure statement
No potential conflict of interest was reported by the authors.
Additional information
Funding
References
- Abaqus613. 2013. Abaqus: User's manual, 6.13. Available from: http://129.97.46.200:2080/v6.13/.
- Bai Q, Bai Y., 2014a. Subsea pipeline design, analysis, and installation. Oxford (UK): Gulf Professional Publishing.
- Bai Y, Bai Q., 2014b. Subsea pipeline integrity and risk management. Oxford (UK): Gulf Professional Publishing.
- Bjørnøy O, Rengård O, Fredheim S, Bruce P, et al., 2000. Residual strength of dented pipelines, DNV test results. In: Proceedings of the 10th International Offshore and Polar Engineering Conference. Seattle (WA): International Society of Offshore and Polar Engineers; p. 182–188.
- BSI. 2005. BS7910: guide to methods for assessing the acceptability of flaws in metallic structures. London: British Standards Institution.
- Cai J, Jiang X, Lodewijks G., 2016. Residual strength of metallic pipelines subjected to combined loads accounting for impact induced damage. In: Proceedings of the 26th International Offshore and Polar Engineering Conference. St. Jone's: International Society of Offshore and Polar Engineers.
- Cai J, Jiang X, Lodewijks G., 2017. Residual ultimate strength of offshore metallic pipelines with structural damage–a literature review. Ships Offshore Struct. 12: 1–19.
- Cai J, Jiang X, Lodewijks G, Pei Z, Zhu L., 2017. Experimental investigation of residual ultimate strength of damaged metallic pipelines. In: Proceeding of the 36th International Conference on Offshore Mechanics and Arctic Engineering. Rhodes: American Society of Mechanical Engineers.
- Cosham A, Hopkins P., 2004. An overview of the pipeline defect assessment manual (pdam). In: 4th International Pipeline Technology Conference; Belgium: May. p. 9–13.
- DNV. 2010. DNV-RP-F111 interference between trawl gear and pipelines. Norway: Det Norske Veritas.
- DNV. 2013. DNV-OS-F101 submarine pipeline systems. Norway: Det Norske Veritas.
- Es S, Gresnigt A, Vasilikis D, Karamanos S., 2016. Ultimate bending capacity of spiral–welded steel tubes–part i: experiments. Thin-Walled Struct. 102: 286–304.
- GB/T 1591., 2008. 低合金高强度结构钢 [High strength low alloy structural steels]. China: Chinese National Standard. Chinese.
- Ghaednia H, Das S, Wang R, Kania R., 2015. Effect of operating pressure and dent depth on burst strength of NPS30 linepipe with dent–crack defect. J Offshore Mech Arct Eng. 137(3): 031402-1–031402-8.
- Gong S, Ni X, Bao S, Bai Y., 2013. Asymmetric collapse of offshore pipelines under external pressure. Ships Offshore Struct. 8(2): 176–188.
- Gresnigt A, Karamanos S, Andreadakis K., 2007. Lateral loading of internally pressurized steel pipes. J Pressure Vessel Technol. 129(4): 630–638.
- Hilberink A., 2011. Mechanical behaviour of lined pipe [PhD thesis]. Delft: Delft University of Technology.
- Kyriakides S, Corona E., 2007. Mechanics of offshore pipelines. Vol. 1, Buckling and collapse. Oxford: Elsevier.
- Lee GH, Seo JK, Paik JK., 2017. Condition assessment of damaged elbow in subsea pipelines. Ships Offshore Struct. 12(1): 135–151.
- Macdonald K, Cosham A., 2005. Best practice for the assessment of defects in pipelines–gouges and dents. Eng Fail Anal. 12(5): 720–745.
- Manes A, Porcaro R, Ilstad H, Levold E, Langseth M, Børvik T., 2012. The behaviour of an offshore steel pipeline material subjected to bending and stretching. Ships Offshore Struct. 7(4): 371–387.
- Mohd MHB, Kim DW, Lee BJ, Kim DK, Seo JK, Paik JK., 2014. On the burst strength capacity of an aging subsea gas pipeline. J Offshore Mech Arct Eng. 136(4): 041402.
- Mohd MH, Lee BJ, Cui Y, Paik JK., 2015. Residual strength of corroded subsea pipelines subject to combined internal pressure and bending moment. Ships Offshore Struct. 10(5): 554–564.
- Orynyak I., Rozhonyuk, V., Shlapak L., 1999. Residual strength of pipelines with dents. Mater Sci. 35: 689–694.
- Paik J, Thayamballi A., 2006. Some recent developments on ultimate limit state design technology for ships and offshore structures. Ships Offshore Struct. 1(2): 99–116.
- Pakiding L. 2007. Design criteria for high strength steel joints [dissertation]. Delft: Delft University of Technology.
- Park T, Kyriakides S., 1996. On the collapse of dented cylinders under external pressure. Int J Mech Sci. 38(5): 557–578.
- Prabu B, Raviprakash A, Venkatraman A., 2010. Parametric study on buckling behaviour of dented short carbon steel cylindrical shell subjected to uniform axial compression. Thin-Walled Struct. 48(8): 639–649.
- Ramberg W, Osgood W. 1943. Description of stress–strain curves by three parameters. Technical Note No. 902. Washington (DC): National Advisory Committee for Aeronautics.
- Vasilikis D, Karamanos S, Es S, Gresnigt A., 2015. Ultimate bending capacity of spiral–welded steel tubes–part ii: predictions. Thin-Walled Struct. 102: 305–319.
- Yang Z, Li H, Guo X, Li H., 2007. Damage assessment in pipeline structures using modal parameter. Ships Offshore Struct. 2(2): 191–197.
- Zhang S, Pedersen PT, Ocakli H., 2015. Collisions damage assessment of ships and jack-up rigs. Ships Offshore Struct. 10(5): 470–478.