
ABSTRACT
Fatigue is typically a governing limit state for marine structures. Welded joints are the weakest links in that respect. Physics involve several resistance dimensions, a range of scales and distinct contributions in different stages of the accumulative damage process. Fatigue damage criteria developed over time have been classified with respect to type of information, geometry, parameter and process zone including plane and life region annotations. The criteria are evaluated regarding model (in)capabilities, showing up to what extent (governing) physics are taken into account. Modelling developments and trends towards complete strength, multi-scale and total life criteria have been identified. Incorporating all four (interacting) fatigue resistance dimensions: material, geometry, loading & response and environment translates into a complete strength fatigue damage criterion. Considering macro-, meso- and micro-scale information provides a multi-scale fatigue damage criterion. Correlation of crack initiation and growth requires matching intact and cracked geometry parameters, revealing a total life fatigue damage criterion.
HIGHLIGHTS
• Classification of fatigue damage criteria with respect to type of information, geometry, parameter and process zone including plane and life region annotations.
• Identification of modelling developments and trends towards complete strength, multi-scale and total life fatigue damage criteria for welded joints in marine structures.
ABBREVIATIONS: CA: constant amplitude; FE: finite element; FSS: full-scale structure; HCF: high cycle fatigue, life time range N = O(5·106 … 109) cycles; (N)LC: (non-)load carrying; LCF: low cycle fatigue, life time range N = O(101 … 104) cycles; LSS: large-scale specimen; MCF: medium cycle fatigue, life time range N = O(104 … 5·106) cycles; mSC: micro- and meso-scopic stress concentration; MSC: macro-scopic stress concentration; (N)SIF: (notch) stress or strain intensity factor; SCF: stress or strain concentration factor; SED: strain energy density; SSS: small-scale specimen; VA: variable amplitude
Nomenclature
| A | = | notch strain energy density process zone area |
| C | = | crack growth or fatigue resistance curve intercept (endurance coefficient) |
| D | = | fatigue damage |
| E | = | normal strain at macro-scale |
| E | = | Young's modulus |
| J | = | crack tip energy density |
| J1 | = | hydrostatic stress or strain component |
| J2 | = | deviatoric stress or strain component |
| Kσ | = | crack tip stress intensity factor |
| Kϵ | = | crack tip strain intensity factor |
| K’ | = | work hardening coefficient |
| KN | = | notch stress intensity factor |
| KN I | = | mode-I notch stress intensity factor |
| KN III | = | mode-III notch stress intensity factor |
| KI | = | mode-I stress intensity factor |
| KIT | = | total mode-I stress intensity factor |
| KIr | = | residual mode-I stress intensity factor |
| KIII | = | mode-III stress intensity factor |
| K* FE | = | dimensionless FE based notch stress intensity factor |
| N | = | (total) number of cycles until failure |
| Ni | = | number of cycles corresponding to initiation |
| Ng | = | number of cycles corresponding to growth |
| R | = | notch strain energy density process zone radius |
| S | = | stress based fatigue damage criterion |
| SB | = | Battelle structural normal stress range |
| Se | = | effective notch stress range |
| Seq | = | (equivalent) Von Mises stress range |
| Sn | = | nominal stress range |
| Ss | = | hot spot structural stress range |
| ST | = | total stress range |
| T | = | temperature |
| TB | = | Battelle structural shear stress range |
| TσS | = | strength scatter band index |
| W | = | energy based fatigue damage criterion |
| WN | = | notch strain energy |
| WNA | = | notch strain energy density |
| Yn | = | notch factor |
| Yf | = | far field factor |
| a | = | crack size (i.e. length) |
| a0 | = | critical defect size |
| ad | = | long-term corrosion pit size (i.e. depth) |
| ai | = | (real) defect or initial crack size |
| an | = | (root) notch size |
| ap | = | corrosion pit size (i.e. depth) |
| apc | = | critical corrosion pit size (i.e. depth) |
| at | = | crack initiation-growth transition size |
| b | = | fatigue strength exponent |
| c | = | fatigue ductility exponent |
| e | = | strain based fatigue damage criterion |
| ee | = | effective notch strain |
| es | = | element size |
| fw | = | peak stress weight function |
| fy | = | line normal force with respect to the y-axis |
| hw | = | weld leg height |
| k | = | notch stress intensity weight function |
| lw | = | weld leg length |
| m | = | crack growth or fatigue resistance curve slope (mechanism coefficient) |
| mx | = | line bending moment with respect to the x-axis |
| n | = | elastoplasticity coefficient |
| n’ | = | work hardening exponent |
| r | = | radial coordinate |
| rlr | = | mechanical loading & response ratio |
| rs | = | structural bending stress ratio |
| rt | = | initiation-growth transition coordinate |
| ry | = | plastic zone size |
| s | = | notch support factor |
| tb | = | base plate thickness |
| tc | = | connecting-, cross- or cover-plate thickness |
| tg,o | = | (ordinary) corrosion growth time |
| tg,T | = | temperature affected corrosion growth time |
| ti | = | corrosion initiation time |
| tp | = | plate thickness |
| = |
| |
| Δ | = | prefix indicating stress, strain or energy range |
| Σ | = | normal stress at macro-scale |
| α | = | (half) notch angle |
| β | = | ratio of normal and shear endurance = (σE / τE)2 |
| γ | = | shear strain |
| γ | = | mechanical loading & response ratio coefficient |
| ϵ | = | normal strain |
| ϵe | = | elastic normal strain |
| ϵf’ | = | fatigue ductility coefficient |
| ϵp | = | plastic normal strain |
| θ | = | angular coordinate |
| λ | = | eigenvalue |
| ρ | = | (real) weld notch radius |
| ρ* | = | micro- and meso-structural length or distance |
| ρf | = | fictitious notch radius |
| ρe | = | effective notch radius |
| ρr | = | reference notch radius |
| σ | = | normal stress |
| σ0 | = | material normal stress endurance or fatigue limit |
| σav | = | average stress |
| σE | = | normal stress endurance or fatigue limit (general) |
| σe | = | effective notch stress |
| σf(·) | = | far field stress distribution |
| σf’ | = | fatigue strength coefficient |
| σm | = | mean stress |
| σn | = | nominal stress |
| σn(·) | = | weld notch stress distribution |
| σnr(·) | = | residual weld notch stress distribution |
| σnT(·) | = | total weld notch stress distribution |
| σp | = | peak stress |
| σp,eq | = | weighted peak stress |
| σs | = | hot spot structural stress |
| σy | = | material yield strength |
| τ | = | shear stress |
| τ0 | = | material shear stress endurance or fatigue limit |
| τE | = | shear stress endurance or fatigue limit (general) |
1. Introduction
Marine structures active in inland, coastal, offshore and deep(sea) waters are exposed to cyclic mechanical loading, (distributed) forces and moments, both environment (wind, waves) and service (operations, machinery) induced. The response in terms of stress, strain or energy is cyclic by nature accordingly, meaning fatigue, a cyclic loading & response induced local, progressive, structural damage mechanism introducing fracture (Schijve Citation2009) is a governing limit state.
Fatigue physics involves four interacting resistance dimensions (): material, geometry, loading & response and environment over an extensive range of scales (), in particular for metals like steel and aluminium as commonly applied in marine structures. Material and geometry typically define the reference resistance; loading & response and environment are involved as influence factors affecting the fatigue damage process: crack nucleation, growth and propagation up to fracture ().
Figure 1. Four interacting fatigue resistance dimensions.
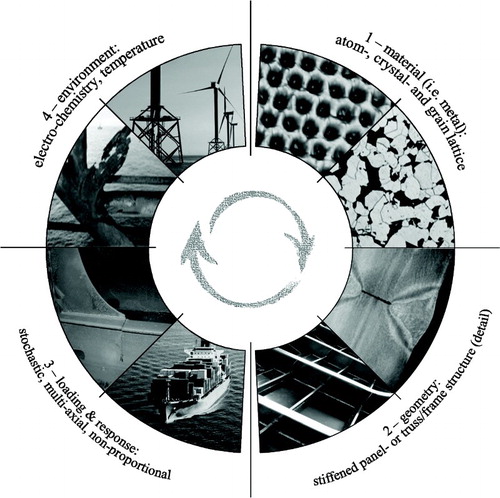
Figure 2. Fatigue physics range of scales.
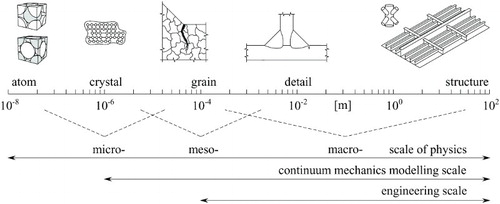
Figure 3. Fatigue damage process.
Plasticity, required to develop fatigue damage, turns up at material micro- and meso-scale because of micro- and meso-scopic stress concentrations (mSC's); fatigue sensitive locations. Instantly mSC's emerge at the boundaries of the anisotropic polycrystalline grain structure and at inclusions, voids and pores. Over time, moving dislocations concentrate in (persistent) slip bands introducing mSC's at intrusion–extrusion pairs. At macro-scale the material (dimension 1) is basically a plane geometry.
Macro-scopic stress concentrations (MSC's), hot spots facilitating mSC's, emerge at notched geometries (dimension 2), at discontinuities; fatigue sensitive locations either as part of structural members (e.g. cut outs) or at structural member connections (i.e. joints). Since marine structures are traditionally structural member assemblies in stiffened panel-, truss- or frame-setup, particular attention is paid to arc-welded joints typically connecting the structural members like plates, shells, bars and beams. The welding process introduces a notch, an MSC, at the weld toe and depending on penetration level another one at the weld root, as well as additional mSC sources: surface defects and sub-surface inclusions, voids and pores. The weld to base material transition including heat affected zone initiates another discontinuity.
Continuous waves and repeating wave impacts dominate the marine structure mechanical loading & response system (dimension 3). Wave loading is typically multi-axial as a result of sea and swell combinations with different heading and highly stochastic in terms of amplitude, phase angle and frequency; i.e. is identified as multi-axial non-proportional (random) variable amplitude (VA) loading. The corresponding response involves mass, damping and stiffness contributions. Although the marine structural stiffness distribution is predominantly orthotropic (stiffened panels) or member orientation defined (trusses, frames), loading & response and geometry induced multi-axial welded joint far field response locations can be observed (e.g. Van Lieshout et al. Citation2016), consisting of (opening) mode-I and (tearing) mode-III contributions in the typically thin-walled structural members. At the weld notch locations the response is multi-axial by definition because of cross-sectional (stiffness) changes, introducing the (geometry induced sliding) mode-II component. While at macro-scale the steel and aluminium material behaviour is (quasi-)isotropic, at micro- and meso-scale multi-axiality can even be material induced.
Marine structures are active in an aqueous (often sulphide containing) or sour-brine environment (dimension 4), meaning corrosion may appear at the material (geometry) surface. It is particularly important for steel since, in case the protection system is inadequate, electro-chemical reactions will dissolve iron. Corrosion pits appear over time, increasing the mSC's at existing intrusion–extrusion pairs and developing new ones, meaning corrosion accelerates the fatigue damage process by deteriorating the material and geometry defined reference resistance. Temperature conditions may vary from tropical to arctic or even cryogenic, affecting the fatigue damage mechanism as well (i.e. as non-mechanical loading component).
For fatigue analysis and design purposes typically a continuum mechanics based structural response parameter is adopted as fatigue damage engineering criterion, controlling plasticity at (structural) macro- as well as (material) meso- and micro-scale.
Because of material imperfections and welding induced flaws, defects, the marine structure arc-welded joint fatigue analysis and design strategy is principally safe life, fail safe (in case of structural redundancy like for stiffened panels and truss/frame structures including zero members) or even damage tolerant. Life time is typically expressed in number of cycles N and estimates are generally required in the medium and high cycle fatigue (MCF, HCF) range; i.e. N = O(104 … 109).
Using the fatigue resistance characteristics: the four interacting dimensions (), the physics range of scales () and the distinct contributions in different stages of the accumulative damage process (), the objective is to classify fatigue damage criteria for welded joints in marine structures (Section 2) in order to identify and to evaluate the modelling developments and trends (Section 3).
2. Fatigue damage criteria classification
Different fatigue assessment concepts, damage criteria and corresponding resistance curves, have been developed and reviewed over time to account for endurance and mechanism contributions (Cui Citation2002; Fricke Citation2003; Maddox Citation2003; Radaj et al. Citation2006; Hobbacher Citation2009; Rizzo Citation2011; Radaj and Vormwald Citation2013; Radaj Citation2014, Citation2015; Fricke Citation2015; Hobbacher Citation2016; Lotsberg Citation2016). The criteria are proposed to be classified as ():
global or local information criteria
intact or cracked geometry criteria
stress (intensity), strain (intensity) or energy (density) parameter criteria
point, line or area/volume- and defect size or crack increment process zone criteria
critical, integral or invariant plane criteria
infinite or finite life region criteria
Figure 4. Fatigue damage criterion overview.
Fatigue damage criteria of the intact geometry type: stress, strain or energy (S, e or W(S, e)) depending on work hardening, elastoplasticity and multi-axiality considerations are related to the stress or strain concentration factor (SCF) as governing crack initiation parameter. Cracked geometry criteria: crack tip stress intensity, strain intensity or energy density (Kσ(S, a), Kϵ(e, a) or J(S, e, a)) involve the growth controlling stress or strain intensity factor (SIF). Although the fatigue life time of arc-welded joints is typically limited to growth – justifying a SIF based fatigue damage criterion – the major part of the life time is spent in the weld notch affected region, meaning an SCF related one makes sense as well (Den Besten Citation2015). Alternatively continuum or discontinuum damage mechanics models can be adopted to estimate the initiation and growth life time contribution, using respectively damage evolution functions in order to describe the deterioration of the material mechanical properties (e.g. based on effective stress or Young's modulus as intact geometry parameters) and crack cohesive zone or crack damage mechanism formulations (e.g. Lemaitre and Chaboche Citation1994; Erny et al. Citation2012; Murakami Citation2012; Silitonga et al. Citation2013).
Following the critical distance theory (Susmel and Taylor Citation2007; Taylor Citation2007; Susmel Citation2008), the considered process zone relates the response mode-I, mode-II and mode-III specific, plane geometry characteristic and (elastoplastic) micro-structural material properties for a particular environment at the considered stage of the fatigue damage process to the notch geometry effective fatigue damage criterion. The process zone can be defined in terms of distance, length, area or volume for intact geometry parameters and as defect size or crack increment for cracked geometry parameters. A fatigue limit or threshold parameter is involved in the infinite life region; an initiation or growth based parameter in the finite life region. The process zone values are either constant in the infinite life region or loading & response level dependent in the finite life region since the relative initiation and growth contributions to the total fatigue life time are loading & response level dependent.
Because the mSC's (at MSC locations) as damage controlling sources in polycrystalline materials like metals are randomly distributed, the governing (i.e. largest, critical) one defines the fatigue resistance and the probability of fatigue induced failure can conceptually be estimated using a series system description: a geometry (i.e. structural member assembly) is as weak as its weakest (material) link, introducing the statistics of extremes to the adopted process zone along the weld seam (Danzer et al. Citation2007; Wormsen et al. Citation2007; Todinov Citation2009).
Fatigue damage criteria are typically developed for a certain plane and life time region (e.g. Van Lieshout et al. Citation2017) as reflected in the annotations. Shifting application from one plane or region to another, however, has modelling consequences, particularly important for multi-axial loading & response conditions.
In case of a predominant uni-axial (i.e. single mode) normal or shear response condition the adopted (critical) plane is based on a single stress or strain component, i.e. is maximum shear or principal response defined for initiation and growth dominated life times. Considering the endurance only is sufficient since the mechanism contribution is the same for all cases.
For proportional multi-axial (i.e. mixed mode-I, mode-II and mode-III) conditions involving normal as well as shear stress/strain response contributions (e.g. Lotsberg Citation2009), a shear or principal response based critical plane can still be adopted, although only the endurance is accounted for (even if plane angle induced corrections are applied; e.g. DNV-GL classification note Citation2014) and the different damage mechanism contributions are ignored. An interaction equation at a (critical; fracture) reference plane like the Gough–Pollard relation (e.g. Gough and Pollard Citation1935; Dong and Hong Citation2006; Hobbacher Citation2016); (Δσ/σE)2 + (Δτ/τE)2 = 1 is principally an (infinite life) endurance limit criterion as well, meaning the involved coefficients for a particular material, geometry and environment are rather loading & response level dependent than constants when applied in the finite life region to account properly for the mechanism contributions. Since a response (i.e. endurance) based critical plane does not necessarily result in maximum damage if different mechanisms are involved, a damage based critical plane could replace the critical response based one; in extremis the fracture plane itself as the maximum damaged one by definition.
Introducing non-proportional multi-axial response conditions the critical plane orientation changes, i.e. is time dependent, meaning that rather than the critical one incorporating the maximum or equivalent damage all planes can be accounted for in an integral manner (e.g. Sonsino Citation2009).
The information needed to establish the critical plane is unknown a priori and requires quite some effort. Integral plane calculations are computationally expensive as well. Response invariants (e.g. Crossland Citation1956; Cristofori et al. Citation2008) are an alternative since the hydrostatic and deviatoric components J1 and J2 can be obtained straightforward, efficiently allowing for a loading & response path analysis in Euclidean space. However, invariants involve the endurance part only because of the original application in the infinite life region; i.e. as endurance limit parameter. Application in the finite life time region requires the coefficients to be response level dependent. A special one, the deviatoric component related Von Mises stress Seq = √{(Δσ)2 + β·(Δτ)2} with β = (σE/τE)2 (e.g. Dong and Hong Citation2006; Hong and Forte Citation2014) – originally a static strength related yield criterion – assumes the normal and shear endurance ratio to be (ΔσE/ΔτE) = √β = √3. For the infinite life related endurance limit, √β = √3 is rarely observed. Application in the finite life region satisfies this assumption at maximum at 1 point only because of the different normal and shear fatigue damage mechanisms involved; i.e. different mode-I and -III resistance curve slopes, meaning eventually an average mechanism contribution, an average slope, is obtained. Another Von Mises peculiarity is the insensitivity to sign effects (Sonsino Citation1997). The hydrostatic response component is not incorporated by definition.
Resistance curves, (empirical) fatigue damage criterion – life time relations providing integrity and longevity information, are typically of the Basquin or Paris type; log(N) = log(C) – m·log{S, e, W} or log(da/dn) = log(C) + m·log{ΔKσ, ΔKϵ, ΔJ} for respectively intact and cracked geometry parameters. The endurance and damage mechanism coefficients, intercept log(C) and slope m, are life time region dependent; for MCF growth dominates, initiation is governing for HCF. A naturally changing slope m from a finite to an infinite value – fatigue damage related plasticity requires a response level threshold – coincides with the transition from a finite to the infinite life region. The adopted fatigue damage criterion controls the reliability level that can be achieved. Confidence is a matter of sufficient test data, particularly important in the HCF region: testing time is quite long and the initiation dominated N comes along with increased scatter. Although marine structures like ships may behave like a low-pass filter, for others a significant part of the loading & response level can be related to the HCF region, meaning the resistance uncertainty becomes very important.
2.1. Nominal stress criterion
Evaluating the MCF and HCF resistance of welded steel and aluminium structural details using a global fatigue damage criterion involves typically the nominal stress range Sn = Δσn (); a structural detail reference- and linear elastic intact geometry parameter. Constant amplitude (CA) fatigue resistance information is commonly obtained using small- or large-scale (beam) specimen and expressed in terms of FATigue classes or detail CATegories, defining the intercept log(C). The damage mechanism is assumed to be similar for all structural details, meaning the slope m is invariant. Theoretically, an infinite number of different structural details exist, although in marine structures it seems rather a matter of varying dimensions than the actual diversity in welded joints. The number of IIW defined FAT classes (Hobbacher Citation2016) or CEN based detail CAT's (Eurocode 3 Citation2006; Eurocode 9 Citation2007) is limited to ∼80.
Figure 5. Welded joint normal force and bending moment induced stress distributions.
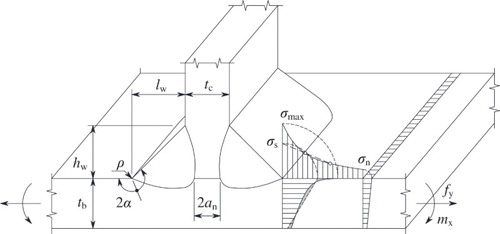
As long as material, geometry, loading & response (generally a membrane component only), environment as well as failure location (weld toe or weld root notch), quality (metallurgical as well as offset and angular imperfections) fit the FAT or CAT description, computational effort is limited and concept complexity is relatively low. However, (local) dimensional variations are not explicitly considered paying off in terms of fatigue resistance accuracy (i.e. life time estimate uncertainty) since Sn is processed as point criterion, as ‘local’ nominal stress, meaning (notch response gradient and weakest link induced) size effects are not taken into account explicitly and have to be corrected for. In case the structural detail geometry and loading & response identified in the full-scale structure is running out the FAT or CAT description, the ‘local’ nominal stress requires identification of stress concentration components already incorporated and missing ones. Complications increase if the ‘local’ Sn has to be extracted from a finite element (FE) model of a relatively complex marine structure.
Although a spatial description of a mechanical loading & structural response cycle requires two parameters, e.g. range and ratio rlr = (Fmin/Fmax) = (σmin/σmax), the ratio is not explicitly considered since the stress level in the notch affected region is assumed to be highly tensile anyway (at yield magnitude) because of the welding induced residual stress component. Any small- and large-scale specimen fatigue test result obtained at relatively low ratio has been translated to rlr ∼ 0.5 using a nominal mean stress correction.
For uni-axial loading & response conditions, the (thin walled member) structural detail reference plane involves either a mode-I (normal, principal) or mode-III (shear, principal) component. Both endurance and mechanism are accounted for. In case of multi-axiality, the IIW and CEN (Eurocode) prescribe an interaction equation at the (critical) reference plane in the finite life time region. Assuming the coefficients are loading & response level independent, the IIW adopted the Gough–Pollard relation incorporating the (reference) endurance only. Depending on the loading & response conditions the fatigue damage is limited to D < 1. Modifying the coefficients for the mode-I and mode-III endurance components into 3 and 5, equal to the typical resistance curve mode-I and mode-III slope values, the Eurocode uses the same type of relation, although the fatigue damage becomes a linear summation of the two mode contributions meaning interaction is not accounted for after all. The FAT and CAT descriptions defining the involved reference endurance are structural detail specific for the mode-I contribution; concerning mode-III only two general descriptions are distinguished, although the shear induced stress concentrations are detail specific like the normal stress related ones. Rather than incorporating the mixed mechanism contributions, the damage criterion is scaled down for complex loading & response conditions, including (VA) loading & response and mean stress fluctuations.
2.2. Hot spot structural stress or strain criterion
Local criteria provide the opportunity to incorporate explicitly material, geometry, loading & response and environment contributions. The hot spot structural stress range Ss = Δσs (Niemi et al. Citation2006; Hobbacher Citation2016; Eurocode 3 Citation2006;Eurocode 9 Citation2007) is a linear elastic intact geometry parameter assuming the major part of life time N is related to crack initiation (i.e. is spent in the weld notch affected region) rather than crack growth. The equilibrium equivalent far field stress () is involved and solves the ‘local’ nominal stress issue. The tb, tc, lw, hw, an and ρ affected self-equilibrating stress () is not considered, meaning the number of fatigue resistance curves is still infinite. Since the self-equilibrating stress determines up to what extent the notch is load carrying, in terms of fatigue resistance the extremes have been defined: non-load carrying (NLC) and load carrying (LC); 2 FAT classes or detail CATegories, 2 Ss-N resistance curves; Basquin (type of) relations. In order to classify or categorise a weld notch as NLC or LC still the structural detail has to be considered. If no prescription is available, selection is based on engineering judgment. Note Ss is principally a surface point criterion, meaning size effect corrections are still required.
In order to incorporate the weld load carrying level explicitly, the average normal stress in the weld throat cross-section (i.e. the membrane component of the weld throat equilibrium equivalent stress distribution) has been considered to be an adequate measure (Poutiainen and Marquis Citation2004, Citation2006). Translated to a bending stress contribution in the weld notch cross-section along the (presumed) crack path maintaining far field equilibrium involves the plate thickness and weld dimensions, aiming to include stress gradient induced size effects at the same time.
A hot spot structural stress criterion based fatigue assessment following IIW or CEN (Eurocode) is limited to weld toe induced failures; a design principle because of weld root fatigue detection issues. Originated from strain gauge measurements, Ss is typically a FE 2-point (non-) linear surface extrapolation calculated – fictitious – stress that cannot be measured itself. However, the Ss estimate is FE type and mesh size sensitive (e.g. Fricke Citation2002; Fricke et al. Citation2008, Citation2013; Rizzo and Fricke Citation2013), meaning the FE recommendations associated with the Ss-N curve have to be used. In order to solve the sensitivity issues, nodal (i.e. traction) forces and moments at the hot spot location itself – satisfying force and moment equilibrium by definition – have been proposed to be used to obtain the far field stress distribution σf along the weld seam, including a virtual node procedure to accommodate weld ends (Dong Citation2001, Citation2003; Kim et al. Citation2015).
Rather than a 2-point surface extrapolation Ss estimate or a nodal forces based Ss value, a 1-point Ss approximation is proposed, to be obtained 1 [mm] below the surface along the expected crack path (Xiao and Yamada Citation2004). An FE volume model with sufficiently small elements in surface normal direction is required. Since in marine structures a structural member wall (i.e. plate) thickness tp ∼10 [mm] is a common value and for a low weld toe notch load carrying level the transition from the notch affected to far field dominated region is approximately at 0.1tp; at ∼1 [mm] below the surface, the mesh size and element type sensitivity is kept to a minimum. The 1 [mm] below surface Ss is not based on (elastoplastic) micro-structural material process zone considerations, meaning no direct relation to the critical distance theory (Peterson Citation1938; Taylor Citation2007) exists. Although the 1 [mm] below surface Ss is not the structural stress at the surface by definition, it is a far field stress value indeed; no notch affected self-equilibrating stress contribution is involved. For different tp values still the 1 [mm] below the surface value can be adopted – a reference value. However, the notch affected self-equilibrating stress becomes involved for different tp as well as for increasing weld notch load carrying level – violating the Ss definition, meaning the element type and mesh size sensitivity increases. At the same time the (relative) geometry and loading affected response gradient size effects are incorporated up to some extent, although the 1 [mm] below surface Ss is a point criterion. The number of involved resistance curves reduces to one. Adopting the transition point from notch dominated to far field governing response as Ss location (Liu et al. Citation2014; Shen et al. Citation2016), the self-equilibrating part is not involved and the Ss definition is satisfied. Size corrections are required again as common for point criteria; at least NLC and LC Ss-N curves are involved. Alternative to a 1-point sub-surface procedure, through-thickness linearisation based on force and moment equilibrium can be used as well in order to capture exact Ss values (Dong Citation2001). At the same time no model limitation exists to determine Ss for weld root notches.
Any offset or angular imperfections affecting the far field stress should explicitly be included. Loading & response ratio and residual stress considerations remain unchanged in comparison to the nominal stress criterion. Generally speaking, life time estimate uncertainty should decrease because of reduced (strength) scatter, at the price of increased structural response modelling time and local geometry and loading & response information; increased criterion complexity and effort.
The structural strain can be adopted in case of elastoplasticity considerations, particularly important in the low cycle fatigue (LCF) region (e.g. Dong et al. Citation2014), but may be used as well to merge arc-welded joint fatigue resistance information for different metals in a particular environment, assuming micro- and meso-material effects including defect size (distribution) can be neglected. In case the considered welded joint fatigue life times are crack growth dominated – the damage mechanism is fixed – the material bulk property is in charge, as can be observed for the welded steel and aluminium joint FAT- as well as CAT-ratio which is approximately equal to the Young's modulus ratio – an endurance aspect only. Scarce titanium data could jointly be evaluated together with steel and aluminium data in order to obtain sufficient reliability and confidence with respect to fatigue design.
The multi-axial loading & response considerations as introduced for the nominal stress apply to the hot spot structural stress and strain as well since the local weld notch induced contributions are still not explicitly considered; i.e. mode-II contributions are not involved. The mode-I (normal, principal) or mode-III (shear, principal) response components are defined in the (critical) fracture plane. An important aspect of (random) VA non-proportional multi-axial loading & response conditions is damage accumulation, typically involving multi-axial cycle counting; for example at the σ-√3τ or ϵ-√3γ Von Mises plane (e.g. Wei and Dong Citation2011; Mei and Dong Citation2016). The σ and τ components of each cycle are input for the (modified) Gough–Pollard equation (e.g. Dong and Hong Citation2006; Jiang et al. Citation2016). A resistance curve based on Von Mises stress or strain would typically come along with a slope m ∼ 4 (e.g. Hong and Forte Citation2014), in between the mode-I and mode-III characteristic values of m = 3 and 5; an averaged mechanism contribution.
2.3. Effective notch stress or strain criterion
The (as) weld(ed) notch radius is typically small (ρ → 0) and the theoretical stress concentration is not fully effective, meaning a (local) peak stress as fatigue damage criterion Smax = Δσmax () would be too conservative. Adopting a micro- and meso-structural notch support hypothesis, an effective notch stress estimate Se = Δσe can be obtained by adopting the stress value at a material characteristic micro- and meso-structural distance ρ* from the notch (Peterson Citation1938). Alternatively the notch stress distribution can be averaged along the (presumed) crack path over a material characteristic micro- and meso-structural length ρ* to obtain an effective one Se = Δσe = Δσav (Neuber Citation1937); a local intact geometry parameter and line equivalent point criterion (). The notch stress gradient contribution is included; a size effect. The real ρ value can be artificially enlarged employing a fictitious component ρf = s·ρ* to obtain the effective one ρe = ρ + ρf and the corresponding notch stress range Se = Δσe = Δσav = Δσmax(ρe) of the original geometry at once (Sonsino et al. Citation2012; Radaj et al. Citation2013).
Figure 6. Weld notch process zones.
Notch support factor s includes the geometry and loading & response contribution and depends predominantly on notch angle (2α = 5π/4 and 2α = 2π for respectively idealised fillet weld toe and weld root notches), notch shape (blunt hyperbolic, root hole or blunt circular for the weld toe; elliptic, key-hole or U-hole for the weld root), loading mode (single or mixed), response condition (plane stress, plane strain) and last but not least the adopted response criterion (e.g. an equivalent one like Von Mises). Values are obtained in the range 0–10.
Embedded in the critical distance theory (Taylor Citation2007), micro- and meso-structural length or distance ρ* is a constant in the infinite life region and a loading & response level dependent one for a finite life time because of changing initiation and growth contributions. Typically, ρ* is obtained in an implicit way. Using fatigue test data, Se-N curve parameters can be estimated using regression analysis. Assuming the data correlation is at maximum for the actual ρ*, its most likely value can be identified. Although ρ* is a material characteristic parameter, heat affected zone and weld material effects for respectively weld toe and weld root notches are generally ignored. A most likely ρe (engineering) value can be established directly as well, meaning average ρf contributions are involved.
For engineering applications one fatigue resistance curve (i.e. Basquin type of relation Se = C·Nm ) corresponding to one reference radius ρr = ρe = 1 [mm] has been proposed (for both steel and aluminium weld toe and root notches) because of the simplifications (regarding notch angle, notch acuity, elastoplasticity, micro- and meso-structural length, etc.) with respect to the original criterion; an average value for the finite life time range as reflected in the involved fatigue resistance data. The (stochastic) real notch radius is not explicitly considered and an extreme value ρ = 0 is assumed. The ρr value requires plate thickness tp ≥ 5 [mm] because of artificial cross-sectional weakening or strengthening at the weld toe and root notches, meaning structural stress corrections should be applied. The root notch shape introduces weakening by definition and key-hole and U-hole configurations are respectively classified as conservative and non-conservative based on a Round Robin (Fricke et al. Citation2013), although an important boundary condition: the adopted shape as used to obtain the fatigue resistance curve and the one employed for fatigue assessment must be in agreement, seems not satisfied. An average effective stress over a material characteristic length incorporates the stress gradient induced size effects, but applying an artificial notch radius to obtain the effective stress at once has its limitations; i.e. already 3 ρr values 1.0, 0.3 and 0.05 have been proposed for a particular range of tp values (Rother and Fricke Citation2016) and seem to be a first step to introduce a plate thickness dependent value (ρ/tp). The ρr = 0.05 [mm] value has been selected based on a completely different hypothesis, i.e. the relationship between the SIF and notch stress as well as crack tip of a reasonable local stress component (Sonsino et al. Citation2012). Reference radius ρr has already been proposed to be replaced by a relative one (Schijve Citation2012), although – at least for weld toe notches – involving the plate thickness seems a better solution than the weld leg length. At the same time the relative notch acuity becomes incorporated rather than the absolute one.
The way offset and angular imperfections are incorporated and how the loading & response ratio as well as residual stress have been dealt with is similar to other local fatigue damage criteria.
Embedded in an elastic far field condition, the weld notch structural response is typically elastoplastic, introducing the cyclic stress–strain (hardening) curve (ϵe + ϵp) = (σ/E) + (σ/K’)1/ n’; the Ramberg–Osgood equation, turning the fatigue resistance curve into a (two-slope) Coffin–Manson–Basquin relation: (ϵe + ϵp) = {(σf’ – σm)/E}·(2N)b + ϵf’(2N)c. Morrow's mean stress correction is included. Adopting a macro- as well as micro- and meso-structural notch support hypothesis to relate the effective notch stress and strain concentrations to the far field stress, an ee-(2)N resistance curve can be obtained.
At the weld notch location the response is multi-axial by definition, meaning even for uni-axial far field conditions mixed mode-I and mode-II or mixed mode-II and mode-III multi-axiality is involved. Notch multi-axiality is reflected in the principal effective stress or strain, adopted because of a crack growth dominated life time. However, the defined reference radii are based on far field mode-I test data only and verification information of ρr(ρ*) for data involving mode-III far field loading & response conditions seems not available. In case of proportional multi-axial loading & response conditions the Von Mises stress or strain could be adopted according to IIW (Hobbacher Citation2016), incorporating endurance only. A resistance curve based on Von Mises stress or strain would typically come along with an averaged mechanism contribution; an average slope. However, IIW prescribes only a FAT correction using the mode-I far field data established m and ρr values (Sonsino Citation2009). Adopting an interaction equation (e.g. Gough–Pollard) requires the mode-I and mode-III response components in the local notch angle defined reference or (principal response based) fracture plane rather than the far field response defined one. Adopting the (reference) notch radius affected normal and shear response components in the far field defined (critical) plane orientation implicitly includes notch induced mode-II contributions. For non-proportional loading & response conditions several critical, integral and invariant plane criteria have been combined with the effective notch stress or strain in order to obtain an effective fatigue damage criterion. Adopting an effective equivalent stress hypothesis, only endurance is considered (e.g. Sonsino and Kueppers Citation2001; Sonsino and Lagoda Citation2004). Using a modified resistance (i.e. Wöhler) curve (Susmel and Lazzarin Citation2002) the mechanism is accounted for as well. The plane considerations are based on shear stress (requiring the notch response is explicitly considered in contrast to far field stress, principal stress or fracture defined planes), assuming the fatigue life time is crack initiation dominated. However, in comparison to results obtained using a modified Gough–Pollard interaction equation (involving principal stresses; e.g. Carpinteri et al. Citation2009), an infinite life criterion applied in the finite life time region accounting for endurance only, no significant improvements with respect to integrity and longevity (i.e. fatigue strength and life time) estimates are obtained (e.g. Pedersen Citation2016).
2.4. Notch stress intensity criterion
For decreasing ρ the linear elastic notch stress becomes asymptotic and rather than a(n effective) local value a Williams’ solution σ(rλ −1, θ) based weld notch stress intensity factor (NSIF) can be introduced (Verreman and Nie Citation1996); an intact geometry- and notch stress gradient (area/volume) criterion: KN = lim{σ(rλ −1, θ)/(2α·r)λ −1; r → 0+}, turning into the SIF K formulation (Section 2.7) for a weld root notch in crack configuration. Although in disagreement with the actual definition, the crack based number √(2π) often substitutes (2α)λ −1 in the denominator. The (N)SIF is a geometry and loading & response controlled parameter, meaning no material (nor environment) characteristics are explicitly involved. Using rλ −1 = (r/tp)λ −1 · tp1− λ a weld toe NSIF can be rewritten: KN = k·σ·tp1− λ (Lazzarin and Tovo Citation1998) taking (only) the plate thickness based absolute notch acuity into account. For a weld root notch KN → K = k·σ·an1 − λ, introducing notch size an. The welded joint geometry and mechanical loading & response dependent curve fitted weight function k is either related to the far field stress (σ = σs) or the structural detail nominal stress (σ = σn). Notch stress gradient induced size effects are naturally incorporated. The involved eigenvalues λ(2α) are notch angle dependent, meaning the NSIF and SIF units for weld toe and weld root notches are different. Fitting function k ensures correct KN estimates, but the adopted scaling parameters (respectively, tp1− λ and an1− λ ) are not similar. Combining fatigue resistance data involving hot spots with different notch angles (i.e. weld toe and weld root induced failures) in order to obtain one KN -N or ΔKN -N resistance curve; a Basquin type of equation, is not possible.
Loading & response ratio contributions are not explicitly considered, but can be incorporated in a way similar to the crack tip stress intensity fatigue damage criterion (Section 2.7). Williams’ solution σ(rλ −1, θ) will not change for transient thermal loading (Ferro et al. Citation2005) and can be used to take welding induced residual stress into account. Although for MCF and HCF the far field response is linear elastic, notch elastoplasticity can be taken into account by introducing the Ramberg–Osgood equation (Lazzarin and Zambardi Citation2002). An extended (N)SIF formulation for blunt notches is available as well (Lazzarin and Filippi Citation2006). In both cases the intrinsic motivation to eliminate asymptotic linear elastic response behaviour has become obsolete, but notch response gradient size effects are still explicitly taken into account.
The weld notch response is even for uni-axial far field loading & response conditions of the mixed mode-I and mode-II or mixed mode-II and mode-III type. However, for fatigue assessment purposes typically the mode-I or mode-III contribution is considered only (e.g. Lazzarin and Livieri Citation2001) since for typical weld toe notches the mode-II component is non-singular and will vanish for (r/tp) → 0. In case of far field multi-axiality mixed-mode crack growth based relations can be adopted (e.g. Marquis and Socie Citation2003) introducing an equivalent (N)SIF, for example a geometric mean: K( N ) eq = √(K( N ) I2 + K( N ) III2), incorporating the endurance part only. Alternatively an (infinite life Gough–Pollard type of) interaction equation is proposed (Lazzarin et al. Citation2004). The mode-I and mode-III NSIFs replaced the normal and shear stress components, meaning the correct (fracture) plane parameters with respect to the bi-sector are naturally involved. The obtained resistance curve (in the finite life time region) accounts for endurance only. Rather than loading & response level dependent coefficients the mode-I and mode-III FAT or CAT values are adopted; constants. Plane selection is not relevant since the specific notch bi-sector defined KN components are considered. Following the adopted interaction equation multi-axial cycle counting could be applied in the K( N ) I-√β·K( N ) III plane for (random) VA non-proportional multi-axial loading & response conditions.
2.5. Strain energy density criterion
Because of a mixed-mode weld notch response condition, considering a single stress component only becomes insufficient if the magnitude of other components is non-negligible, e.g. in case of increasing (material) process zone size. The total (linear elastic) notch strain energy WN = f(σ, ϵ) = f(σ2) involving a constitutive relation ϵ ∝ σ is reasonably preferred over stress to be examined (e.g. Glinka Citation1985), knowing that a certain amount at the notch tip is required to develop fatigue damage. Using Williams’ solution σ(rλ −1, θ), WN = f({KN (σ)}2). Adopting the average value introduces the strain energy density (SED) WN A = (1/A)·∫WN dA; an intact geometry- and averaged area (or volume) criterion () covering the notch (effective) stress (gradients) in all directions. A process zone shape assumption is needed and typically semi-circular or hemispherical ones are adopted, meaning a radius characterises the size, centred at the peak stress location. Area A = α·R2, meaning radius R has become the material process zone parameter. The involved NSIF KN incorporates the geometry and loading & response contributions. In the infinite and finite life region, R is respectively a constant and loading & response level dependent one. Concerning the fatigue limit, an R value can be retrieved using Δσ = Δσ0, i.e. the plane geometry fatigue limit estimate (Lazzarin and Zambardi Citation2001). For weld root notches, the (N)SIF should turn into the crack growth threshold ΔKN = ΔKth; R corresponds to the critical defect size a0. An average most likely R can be obtained using MCF and HCF fatigue test data and a (Basquin type of) resistance relation, minimising the error. Typical R values (Lazzarin et al. Citation2004) are comparable to the effective notch stress or strain criterion parameter ρ*. The (N)SIF units problem has been solved; WN A = f({KN ·Rλ −1}2), meaning it is feasible to combine weld toe and weld root induced failures and establish a WN A-N or ΔWN A-N fatigue resistance curve as has been proposed (Livieri and Lazzarin Citation2005).
Loading & response ratio, welding induced residual stress and notch elastoplasticity can be incorporated using dedicated KN formulations (Section 2.4).
For uni-axial far field loading & response conditions, the mode-I or mode-III components are typically considered only, like for the NSIF, rather than taking the full stress tensor into account. Although the (average) material process zone parameter R is different for far field mode-I and mode-III conditions, the same – typically mode-I data based – value is adopted for both.
In case of mixed-mode far field conditions the total SED is simply the sum of the individual components, meaning endurance is accounted for and mechanism contributions are not incorporated. The plane selection and cycle counting considerations for the NSIF apply to WN A as well. As soon as the KN I and KN III contributions have been established for each cycle the corresponding SED can be obtained.
2.6. (Weighted) peak stress criterion
Meant as an FE-oriented engineering application of the NSIF and SED fatigue damage criterion, the maximum elastic peak stress in the mode-related far field direction, e.g. σp for mode-I, has been related to KN and WN A(KN , R λ −1) in order to overcome the fine FE mesh requirements.
The dimensionless NSIF K* FE = KN/(σp·es1− λ ) has proved to be approximately a (calibration) constant for a particular solid FE formulation and size es; K* FE ≈ C, in case es is sufficiently small relative to the notch dimensions (i.e. tp > 3 and an > 3 for a weld toe or weld root to describe sufficiently accurate a linear far field stress distribution). Accordingly, the (KN/σp) ratio is a constant as well (Meneghetti and Lazzarin Citation2006) and σp can be used as local intact geometry and area or volume equivalent point fatigue damage criterion itself, quantifying the intensity of the local linear elastic stress field of the weld notch. In comparison to the KN = k·σ·tp1− λ or KN = k·σ·an1− λ relation (Section 2.4), the physical scaling parameters tp and an have been replaced by a numerical one es; σp substitutes the nominal stress. Following the 1 [mm] engineering reference radius (Section 2.3), a typical value es = 1 [mm] has been adopted (Meneghetti and Lazzarin Citation2011), suggesting the same type of problems will appear for thin plate or shell applications. Because the process zone; i.e. scaling parameter es, is a constant, the response gradient induced size effect has been eliminated numerically. Peak stress σp does not include a material characteristic contribution and is a geometry and loading & response defined parameter like KN. Comparing the scatter band parameter of fatigue resistance data involving weld toe induced failures (6 < tp < 100 [mm]) using respectively KN and σp shows similar values (Meneghetti and Lazzarin Citation2006), but slightly larger for σp. The NSIF issue concerning weld toe and weld root data combinations because of different scaling parameter and units have been solved, providing the possibility to develop 1 material and environment dedicated σp-N resistance curve. Note that the FE formulation and size to be adopted for fatigue assessment should match the one that has been used to establish the σp-N relation.
Like KN translates into WN A(KN , Rλ −1), σp turns into an equivalent, weighted peak stress (Meneghetti et all Citation2015): WN A = f({KN ·Rλ −1}2) = f{(K* FE·σp·(es/R)1- λ )2} = (fw·σp)2 introducing σp,eq = fw·σp as fatigue damage criterion. Material characteristic process zone R is incorporated. For loading & response ratio-, welding induced residual stress- and notch elastoplasticity modelling the KN and WN A formulations can be involved (Sections 2.4 and 2.5).
Far field mode-III results can be obtained in a similar way introducing τp. Since σp and σp,eq as well as τp and τp,eq are of the stress type, interaction equations like the Gough–Pollard relation can be adopted in case of multi-axiality; (Δσp/σp,E)2 + (Δτp/τp,E)2 = 1, although the involved coefficients for a particular material, geometry and environment should be rather loading & response level dependent than constants when applied in the finite life region to account properly for the mechanism contributions. Multi-axial cycle counting could be applied in the σp-√β·τp plane for (random) VA non-proportional multi-axial loading & response conditions.
2.7. Crack tip stress intensity criterion
Fatigue damage of arc-welded joints in marine structures is typically hypothesised to be a crack growth dominated process. The SIF K quantifies the linear elastic stress field magnitude at an infinitely sharp crack tip showing square root singular behaviour; a first order damage tolerant geometry and loading & response dependent similarity parameter. For cracks at weld toe notches K = σ·Yn(a)·Yf(a)·√(πa). The equilibrium equivalent- and self-equilibrating stress contributions () are reflected in the notch and far field factor, respectively Yn and Yf, introducing a notch affected micro- and far field dominated macro-crack region. Weld root cracks initiate at a notch in crack configuration, meaning crack tip and root notch share the same square root stress field singularity and the SIF K will be computed for a fictitious crack length (an + a): K = σ·Yf(a)·√{π(an + a)}. Although Yn ≠ 1, an explicit notch contribution is not involved since the SIF already includes the square root singular behaviour. Incorporating Yn would require a SIF redefinition since K would become singular again (Den Besten Citation2015).
Adopting the SIF K as fatigue damage criterion, a cracked geometry parameter, for cyclic mechanical loading K(σ, a) becomes a crack growth driving force ΔK(Δσ, a). Crack length a is considered to be short in the notch affected micro-crack region; beyond, in the macro-crack region, a is identified as long (Den Besten Citation2015). The Paris equation (Paris and Erdogan Citation1963) is a long crack region-ii characteristic of the sigmoidal shaped crack growth rate curve (). Assuming the crack tip wake field is predominantly elastic, the crack growth driving force ΔK(Δσ, Yf, a) incorporates (only) the first order square root singular term including geometry and cyclic far field effects: (da/dn) = C·(ΔK)m. Intercept C represents the material crack growth strength. Slope m characterises the corresponding material crack growth mechanism.
Figure 7. Anomalous short crack growth at notches.
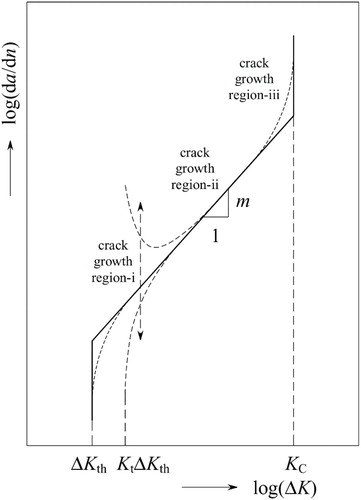
However, short cracks show anomalous subcritical growth behaviour (ΔK < KC) in comparison to long ones. The (notch dependent) elastoplastic crack tip stress wake field size and shape is considered to be an important parameter (Schijve Citation1988). Depending on the stress distribution and magnitude at the crack(tip) and notch, including its degree of elastoplasticity, short cracks initially may tend to grow slower or faster and accelerate or decelerate respectively to the long crack growth characteristic (). To incorporate short crack growth behaviour at blunt notches (ρ > 0), K and ΔK have been modified (El Haddad et al. Citation1979; Liu and Mahadevan Citation2009) introducing the SCF Kt and an effective crack length ae = (an + a0 + a) to include respectively a notch, material defect sensitivity and real crack contribution; ΔK = f(Kt, Δσ, Yf, an, a0, a). Both crack(tip) and notch are supposed to behave predominantly linear elastic. Short crack growth behaviour observed at notches may be monotonically increasing similar to a long crack in region-i, although beyond the material threshold ΔKth (); a region-ii anomaly.
The loading & response ratio rlr, a second parameter required to define the mechanical loading & structural response cycle, provides for mode-I the tension-compression ratio affecting crack opening and closure. In case rlr > 0, a crack may still be partially closed around the minimum of a far field stress cycle and a crack closure phenomenon has been introduced (Elber Citation1971). The crack growth driving force is assumed to be not fully effective: ΔK → ΔKe = f{Δσe (Δσ, σy, a), Yf, a}. The yield strength σy is incorporated, since reduced effectivity has been hypothesised to be a result of plastic wake field deformations at the crack tip. Over time rlr became explicitly involved, as well as work hardening and structural response condition parameters (Sehitoglu et al. Citation1996); an attempt to obtain a conclusive model. Rather than an effective crack length, crack closure (i.e. an effective SIF range ΔKf,e) has been used to explain non-monotonic short crack growth behaviour () at (blunt) notches as well, involving Δσe(Kt, Δσ, σy, a): the plastic wake field would not yet be fully developed (Schijve Citation1988), meaning initially a lower level of crack closure and increased crack growth rate (da/dn). Anomalous growth is however identified well beyond the plastic zone, suggesting at least another contributor is involved (Sehitoglu et al. Citation1996).
Short cracks, either in plane or notched geometries; in respectively materials or structures, show similar growth behaviour if along the (presumed) crack path the same stress distribution is involved, suggesting (non-monotonic region-ii) anomalies to be a result of missing crack driving force components rather than a matter of crack closure or even micro-structural effects (Krupp Citation2007) and a total crack driving force ΔK = ΔKtot (Sadananda and Vasudevan Citation1998) has been formulated. In addition to elastoplastic wake field size; i.e. the SCF Kt in case of blunt notches, the wake field shape is taken into account as well. For the mechanical cyclic loading & response of weld notches, both the far field (equilibrium equivalent stress) and weld notch (self-equilibrating stress) contributions have to be included: ΔKtot = ΔKf(Yf, a) + ΔKn(Yn, a), even for a sharp weld root notch in crack configuration, meaning notch and crack share the same local stress field. Note that ΔKf(Yf, a) includes the first order (crack) singular term only; ΔKn(Yn, a) incorporates the non-singular higher order (notch) terms. The crack growth similarity definition has been refined (Sadananda and Vasudevan Citation1998): equal crack driving forces yield the same crack growth rates, provided the growth mechanism is the same.
Comparing Paris’ long crack region-ii characteristic to other formulations developed over time, a crack growth relation similarity has been identified (Paris and Erdogan Citation1963), i.e. (da/dn) = C·(Δσ)m ·an . For n = (m/2), the quasi-2D infinite plane SIF solution is involved. Dimensional analysis shows that the crack growth rate should be proportional to the crack length: (da/dn) = C·(Δσ)m ·a, as confirmed for several crack growth observations and n = 1 does the F&D model (Frost and Dugdale Citation1958) appear. Since all formulations imply (partially) straight lines on log-scale, however, an apparent agreement of different or even contradictory relations can be identified for the same test data; the ‘correct’ one should correlate a wide range of test data rather than a single one (Paris and Erdogan Citation1963). The F&D model has particularly proved to be able to characterise growth of short cracks – at sharp notches in crack configuration – in case of low (linear elastic) stress intensity (Molent et al. Citation2006), i.e. is capable to collapse monotonically increasing crack growth (rates) in region-i and the lower part of region-ii of the sigmoidal-shaped curve into a single (near) straight line. Using dimensional analysis and a fractal geometry concept, the crack growth relation intercept C should be crack size dependent according to a power function (Spagnoli Citation2005), turning the Paris characteristic into (da/dn) = C(a)·(ΔKf)m → (da/dn) = C·f(a)n·(ΔKf)m. The crack growth relation similarity has been generalised at the same time since far field SIF contributions are included as well. One of the solutions is the generalised F&D model (Jones et al. Citation2007): (da/dn) = C·an·(ΔKf)m with n = (1 – m/2). To eliminate the ΔKf first order crack tip singularity, n includes (−m/2). An explicit notch contribution is not taken into account; only the crack configuration has been investigated. Assuming ρ* (Section 2.3) and a0 have the same physical meaning, the Ramberg–Osgood equation and Coffin–Manson–Basquin relation, respectively the intact geometry stabilised cyclic stress–strain- and fatigue resistance curve, can be used to show that C = f(K’, n’, σ’f, ϵ’f, b, c); a material parameter (Noroozi et al. Citation2005; Jones et al. Citation2007). Crack growth similarity is violated (Jones et al. Citation2007), in contrast to a modified Paris region-i and region-ii formulation: (da/dn) = C·(ΔKf – ΔKth)m. For m = 2, McEvily's model (McEvily and Ishihara Citation2001; McEvily et al. Citation2003; Endo and McEvily Citation2007) is obtained. The first order crack tip plasticity relation (ry ∝ K2) and crack growth rate – crack length proportionality (da/dn ∝ a) are identically satisfied at the same time; (ΔKf – ΔKth)m has replaced (ΔKf m – ΔKth m) to achieve in average a better fit in the near threshold region for multiple data sets (McEvily Citation1983), an engineering solution. Threshold ΔKth might be considered as a compressive driving force preventing for crack growth; a material parameter for both short and long cracks. Anomalous crack growth at notches () is often illustrated below the long crack threshold (e.g. Ritchie et al. Citation1988, Janssen et al. Citation2002) and suggested to be a result of missing crack growth driving force (correction) components like Kt or Yn. Plasticity induced crack closure, i.e. ΔKf = ΔKf,e and ΔKth = ΔKth,e, has been introduced to deal with crack growth anomalies as well (McEvily and Minakawa Citation1984). In order to develop a unified crack growth relation (Cui et al. Citation2011, Citation2014; Huang et al. Citation2009), McEvily's model has been generalised by incorporating unstable growth in region-iii up to fracture () and slope values different from m = 2 because of material dependency.
To be able to model generalised region-i and region-ii crack growth behaviour at notches (both monotonically increasing and non-monotonic) concerning far field response (membrane and bending contributions for mode-I), notch acuity (both sharp and blunt) as well as crack tip and/or notch stress condition (exclusively elastic up to fully plastic), all involved crack growth driving force components along the (assumed) crack path – the total stress distribution – should be taken into account, since crack tip wake field shape and size are assumed to be decisive. Although the response condition in the structural field stress dominated region should be exclusively elastic, in the (weld) notch stress governing region, however, the condition may vary from predominantly elastic up to fully plastic. Inevitably, the crack growth mechanism will be affected and a dual slope formulation; the Battelle two-stage crack growth model, a modified elastic far field stress governing Paris equation, has been introduced: (da/dn) = C·Mkn2·ΔKf m (Section 2.8) Short crack growth behaviour is distinguished from long using respectively Mkn and ΔKf. Magnification factor Mkn includes the wake field shape along the assumed crack path in the notch affected region. Exponent 2 is a first-order crack tip plasticity parameter; an average value applicable for different data sets modelling non-monotonic crack growth behaviour.
The far field and notch factors, Yf and Yn, are linear elastic SIF weight functions incorporating the stress wake field shape of cracks at weld toe and weld root notches. Reflected in notch affected micro- and far field dominated macro-crack growth, Yn should be governing for cracks growing from defect size up to short ones; growing from short to long, Yf is assumed to be in charge. Correlating micro- and macro-crack growth, a total two-stage model satisfying similarity f(a) = Yn(a), a modified Paris equation, is proposed: (da/dn) = C·Yn n·(ΔKf)m (Section 2.9). Since the self-equilibrating notch stress part dominates the wake field shape in the micro-crack region, the ΔKf induced square root singular crack tip behaviour should be subtracted for Yn: n = (ne − m/2). In case the notch stress distribution is elastic, ne = 1.0; if plasticity becomes involved, ne > 1.0. For a positive elastoplasticity coefficient n > 0 a non-monotonic crack growth rate can be identified; a monotonically increasing one if n ≤ 0, meaning near (structural) threshold behaviour is observed for ne < m/2. In comparison to the Battelle two-stage crack growth model, Yn and Mkn serve the same purpose, although obtained in different ways. Rather than a constant plasticity related coefficient (n = 2) and focus on non-monotonic crack growth at notches at the same time, crack growth behaviour may change from predominantly non-monotonic in the MCF- to monotonically increasing in the (near threshold) HCF region; n should be variable.
The long crack growth characteristic does not apply one-to-one to cracks emanating at (weld) notches. Micro-crack growth in the notch affected region can be identified as near structural threshold region-I (monotonically increasing) as well as region-ii (non-monotonic) behaviour. Far field dominated macro-crack growth is a region-ii phenomenon anyway, but a load shedding mechanism may become involved in parallel systems like hull structure stiffened panels because of local stiffness loss (Xu and Bea Citation1997). At some (region-iii) point the crack will become unstable and may cause fatigue induced failure. In terms of fatigue life time, the number of cycles in region-iii is limited.
Mean stress has proven to be an important fatigue influence factor (Maddox Citation1975; Obrtlík et al. Citation2004), even for welded joints (Den Besten Citation2015), although distinct contributions for micro- and macro-crack growth at notches are typically not distinguished. All components including cyclic mechanical- and quasi-constant thermal residual stress part should be taken into account.
A mechanical loading induced far field structural stress cycle is unambiguously defined using two independent parameters, e.g. the range Δσ and maximum value σmax, suggesting crack growth involves two driving force components in this respect (Walker Citation1970; Sadananda and Vasudevan Citation1998): ΔK(Δσ) and Kmax(σmax). An effective one – different from the original and modified plasticity induced crack closure formulation (e.g. Donald and Paris Citation1999; Cui et al Citation2011; Gavras et al. Citation2013) – can be determined taking the log-relative contributions into account: ΔKe = (ΔK)p(Kmax)1−p. Assuming m to be invariant with respect to Δσ and σmax, mean stress independent, Paris’ far field loading & response and geometry dependent region-ii characteristic becomes (da/dn) = C·{(ΔKf)p(Kf,max)1-p}m. Crack growth similarity requires macro-cracks to grow at the same rate for similar ΔKf and Kf,max in a particular material; Kf,max > 0 is mandatory for crack growth anyway. Hypothesising that for a mode-I far field stress cycle the negative part ΔKf −(Kujawski Citation2001) does not contribute: (da/dn)I = C·{(ΔKI,f+)p(KI,f,max)1−p}m. The involved effective stress range Δσe can be rewritten in terms of Δσ and the loading & response ratio rlr = (σmin/σmax), showing that on log-scale ΔKe(Δσ, rlr) simply shifts the crack growth relationship. Introducing a loading & response ratio coefficient γ, (da/dn)I = C·(ΔKI,f)m· (1 − rlr)−m· (1 −γ) with γ = p for rlr ≥ 0 and γ = 0 for rlr < 0. Although two crack driving forces are involved, Kf,max is in control for a negative rlr; for increasing positive rlr values ΔKf becomes governing. A geometric mean for rlr ≥ 0 can be adopted as well; γ = p = 0.5 (Smith et al. Citation1970).
In the notch affected region the mechanical loading induced self-equilibrating stress part contains an increased local mean stress, although the corresponding local loading & response ratio equals the equilibrium equivalent related rlr. Given a short crack, the notch affected mean stress converges for increasing crack length to the far field value as naturally included using Mkn in the Battelle- or Yn in the total two-stage crack growth model (Sections 2.8 and 2.9). Taking both crack growth driving forces into account, the Battelle formulation (Kim and Dong et al. Citation2006) has become: (da/dn)I = C·{Mkn/(1 − rlr)1−γ}2·(ΔKI,f)m with γ = 0.5 for rlr ≥ 0 and γ = 0 for rlr < 0. At first glance the mechanical loading induced mean stress contributes only to micro-crack growth in the notch affected region; macro-crack growth is however influenced as well. Modelling assumption seems that mean stress is (notch) plasticity related. For the total two-stage crack growth model the micro- as well as macro-crack growth contribution are proposed to be incorporated, respectively implicitly and explicitly: (da/dn)I = C·Yn n·(ΔKI,f/(1 − rlr)1−γ)m. For elastic notch and/or crack tip behaviour threshold induced anomalous (monotonically increasing) crack growth is principally rlr invariant. To achieve notch and/or crack tip elastoplasticity for decreasing rlr the stress range Δσ should increase, implying the local mean stress increases as well. For increasing crack length, the mean stress reduces to the far field value, meaning plasticity induced anomalous (non-monotonic) crack growth becomes more pronounced for decreasing rlr and is predominantly identified for small positive and negative values since σ < σy (Den Besten Citation2015).
The total weld notch stress distribution consists of a mechanical- and thermal loading induced (quasi-constant) residual component. To include the displacement (constraints) controlled residual stress contribution the residual stress ratio should be crack length dependent. Using one parameter incorporating both the mechanical- and thermal-residual mean stress component, the loading & response ratio may be defined as rlr(a/tp) = (Kmin + Kr)/(Kmax + Kr) like included in the Battelle two-stage crack growth model (Dong Citation2008): (da/dn)I = C ·Mkn2·{ΔKI,f/(1 − rlr(a/tp))1−γ}m. The mean stress has become a macro-crack growth effect. In case the residual stress distribution is tensile in the notch affected region, rlr(a/tp) turns out to be approximately constant; if compressive, rlr(a/tp) rapidly decreases to a significant negative value in the micro-crack region, will gradually increase for increasing crack length and converges up to a constant in the macro-crack region (Dong Citation2008). Taking a closer look to the compressive case, in terms of loading & response ratio the obviously lower local residual stress dominated value naturally converges for increasing crack size to the higher far field governing one. The higher the residual compressive stress in the notch affected region or the higher the rlr value, the more pronounced the anomalous monotonically increasing behaviour will be. In fact, monotonic crack growth rate behaviour as ignored in the cyclic mechanical loading based Battelle two-stage model, is included using rlr(a/tp) as far as residual stress is concerned. The total crack growth formulation already contains n to include cyclic mechanical loading induced non-monotonic and monotonically increasing (da/dn). Crack size dependent tensile residual stress in the notch affected micro-crack growth region would simply increase the coefficient ne. To allow for a governing compressive crack size dependent one, ne’ ≤ 1 will be accepted as well. Notch factor Yn remains the same because of the weld notch mechanical- and thermal-residual stress distribution similarity (Den Besten Citation2015). Quasi-constant residual mean stress effects in the macro-crack region will be included in the crack growth intercept C’.
To achieve crack growth involving two driving force components may suggest at the same time existence of two thresholds, ΔKth and Kmax,th. Violating only one would already be sufficient (Sadananda and Vasudevan Citation1998; Citation2004). Generally speaking, the cyclic one ΔKth is considered to be small, meaning Kmax,th is assumed to be decisive. However, since Kmax includes a mechanical- and (predominantly tensile) thermal-residual stress contribution, arc-welded joint threshold values would be violated in almost any sea state. Though, question is whether threshold values truly exist as a constant, at least for metallic materials (Pyttel et al. Citation2011; Bathias Citation2014). Well established crack growth threshold values seem to be in contrast to experimental data and is considered to be an important reason to prevent for formulations like the (extended) McEvily model, explicitly involving a threshold parameter as material constant.
In case of far field multi-axiality, mixed-mode crack growth based relations (e.g. Marquis and Socie Citation2003; Rozumek and Macha Citation2009) can be adopted and typically involve an equivalent SIF: (da/dn) = C(ΔKeq)m with a geometric mean of the type ΔKeq = (ΔKI2 + c1·ΔKIII2)c2, similar to an equivalent (Von Mises) stress taking endurance explicitly into account and only average (effective) mechanism contributions. A linear superposition at crack growth relation level allows to incorporate the mechanism contributions as well: (da/dn) = cI(ΔKI)mI + cIII(ΔKIII)mIII (e.g. Hertel and Vormwald Citation2014), although an interaction term is not included.
2.8. Battelle structural stress criterion
Using relatively global (i.e. coarse) meshed FE models, local notch information is not included and a relation between the nodal (traction) forces based far field stress distribution σf(r/tp, σs, rs) and a bi-linear approximation σn(r/tp, σs, rs) of the predominantly mode-I crack path related through-thickness weld (toe) notch stress distribution has been established. In case of joint non-symmetry with respect to half the plate thickness (tp/2); i.e. a single edge notch, the transition depth from the notch governing- to far field dominated region is defined at 0.1tp (Dong et al. Citation2003). A good fit is obtained in case the weld notch load carrying level is low and the actual σn(r/tp) distribution is monotonic. For symmetry with respect to (tp/2); i.e. double edge and centre notches, only half the plate thickness is considered (Dong Citation2004) in order to be able to analyse all notches as single edge ones, introducing some modelling consequences. Structural stress σs and structural bending stress ratio rs do not comply anymore with the far field stress definition in the fracture mechanics context and (anti-)symmetry conditions are not satisfied. The transition depth is still defined at 10 [%] of the considered plate thickness; i.e. 0.1(tp/2), introducing a double standard concerning the notch affected stress gradient. Using plate thickness tp as scaling parameter has become inconsistent. For root notches the involved far field stress distribution along the weld throat; the assumed crack path (Xing et al. Citation2016), does not fully satisfy the single edge fracture mechanics definition either.
Since arc-welded joints inevitably contain defects, the intact geometry bi-linear stress distribution has been translated into a cracked geometry equivalent (Dong et al. Citation2003): the SIF K(a/tp). Relating the transition depth to the crack size, σn(r/tp, σs, rs) turns into a crack face traction p(a/tp, σs, rs). For varying crack length a equilibrium is maintained using the structural traction and associated bending traction ratio meaning that for a → tp the notch stress governing SIF solution converges (approximately) to the far field dominated one, providing a blend notch and structural field factor formulation Yn Yf. The notch stress intensities are in agreement with the FE solutions, although Yn Yf is consistently overestimated for (a/tp) < 0.1. However, rather than a matter of notch radius ρ > 0 as explained for several examples (Dong et al. Citation2003, Citation2004; Dong Citation2008), a consequence of the bi-linear notch stress approximation or the result of assumed transition depth, the peculiarity seems to be the result of incorporating the notch characteristic behaviour as modified far field contribution. The crack face traction definition has been ignored and translates into SIF consequences. A higher order SIF effect should explain the non-monotonic K distribution, important for small cracks (Dong et al. Citation2003). However, the notch stress intensities Yn Yf are qualified as good estimates in comparison to the first order FE results (Dong et al. Citation2004). The singular behaviour for (a/tp) → 0 seems fictitious. By definition K is a first order damage tolerant parameter taking the dominant crack tip stress field singularity into account. Non-singular higher order terms may add a finite contribution at most, even if the notch induced singularity becomes governing. Regardless the non-monotonic Yn Yf behaviour, K(a/tp) should remain a monotonically increasing function. Following the adopted stress definitions, for all weld toe and root notch geometries a single edge crack SIF description is adopted, meaning the double edge and centre crack growth mechanisms are approximated and can be non-conservative.
The notch dominated- as well as far field governing weld notch stress contributions and corresponding stress intensities are reflected in a two-stage crack growth model distinguishing short and long crack growth regions: (da/dn) = C ·Mkn2·{ΔKf/(1 − rlr(a/tp))1−γ}m (Dong et al. Citation2003; Dong and Hong Citation2004; Section 2.7); a modified Paris equation. The notch modification factor Mkn is defined as ratio of the SIF with and without notch contribution because of the blend notch and structural far field factor Yn Yf and includes the bi-linearised wake field shape along the assumed crack path. The exponent 2 has proved to be an average value applicable to several data sets for different (base) materials, environments (temperature, water) and all types of crack geometry (single edge cracks, double edge cracks and centre cracks). The exponent is suggested to be notch plasticity related (Dong et al. Citation2003; Dong and Hong Citation2004) since the plastic zone size ry ∝ KI2; a first order crack tip plasticity parameter, at least related to square root singular crack/notch behaviour. Focus is on non-monotonic short crack growth at sharp (weld) notches only, meaning monotonic threshold affected behaviour or notch and crack tip elastic behaviour is ignored. Mechanical- and residual-mean stress is incorporated as a macro-crack growth related parameter and allows for compressive residual stress induced monotonically increasing crack growth.
Integration of the two-stage crack growth model yields a (Basquin type) single slope fatigue resistance relation; log(N) = log(C) − m·log(SB). The fatigue damage criterion SB; the Battelle structural stress, is a local equivalent cracked geometry and (finite life) area equivalent line parameter incorporating the effective structural stress range Δσs/(1 − rlr)(1−γ)/m with γ = 0.5 and γ = 0 for, respectively rlr ≥ 0 and rlr < 0, a notch crack growth integral I(a/tp, rs)1/m and scaling parameter tp(2−m)/(2m) taking the response gradient induced size effects into account: SB = Δσs/{(1 − rlr))(1−γ)/m·I(a/tp, rs)1/m· tp(2−m)/(2m)}. Note that to incorporate the stress gradient induced size effects, rather than a material characteristic length (Section 2.3) thickness tp is adopted as process zone – an intact geometry parameter – and the actual (i.e. approximated) gradient along tp substitutes the averaged value. The material contribution of the process zone turned into a cracked geometry parameter; i.e. defect size and crack increment. Converged N solutions are obtained for a sufficiently small relative defect size (ai/tp), since the notch contribution eliminates the crack tip induced singularity. Material characteristic defect size ai and crack increment Δa are not considered. Master resistance curves have been defined for steel as-welded joints; weld toe and weld root induced failures separately (Dong et al. Citation2007; Hong Citation2010) because of different modelling assumptions. Run-out data has not been taken into account.
Like the mode-I criterion SB a mode-III based one TB has been established as well (Hong and Forte Citation2014). Although local (notch) information is involved, the loading & response conditions are far field (fracture plane) defined meaning multi-axiality is limited to mixed mode-I and mode-III cases and hot spot structural stress criterion developments like multi-axial cycle counting in the Von Mises plane (e.g. Dong et al. Citation2010; Wei and Dong Citation2011; Mei and Dong Citation2016) can be applied. However, endurance is incorporated only and counting in the SB−TB rather than σs−τs plane has been proposed (Hong and Forte Citation2014), involving the mechanism (i.e. slope) as well. In order to establish a fatigue resistance curve still an equivalent (Von Mises) stress formulation is adopted Se = √(SB2 + β·TB2) with β = 3 (Hong and Forte Citation2014); an infinite life region related constant rather than a finite life linked loading & response level dependent value. At the same time an (average mechanism) effective slope m ∼ 4 and intersect log(C) are obtained, considering weld toe induced failure data only.
2.9. Total stress criterion
Aiming to improve fatigue strength similarity () with respect to weld notch stress distribution, weld notch stress intensity, weld notch affected micro-crack and far field dominated macro-crack growth as well as welded joint fatigue resistance similarity obtained using small scale specimens (SSS), large scale specimens (LSS) and full scale structures (FSS), another cracked geometry and stress intensity based area equivalent line criterion has been proposed (Den Besten, Citation2015).
Figure 8. Welded joint fatigue strength similarity.
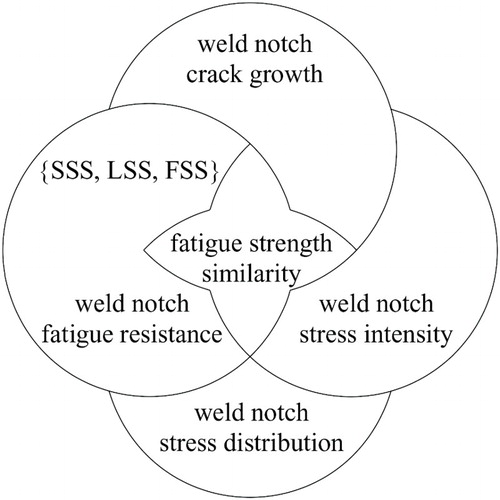
To calculate the marine structural response for fatigue assessment purposes, a relatively coarse meshed plate or shell FE model should be sufficient. The local weld geometry is not included, meaning that corresponding notch information is missing. However, the (numerical) mechanical loading induced (linear) predominant mode-I far field stress distribution σf(r/tp, σs, rs) in each cross-section along the weld seam is available (Section 2.2) and has been related to the corresponding (semi-analytical) through-thickness weld toe and root notch stress distribution formulations σn(r/tp, σs, rs) and σnr(r’/tp’, σsr, rsr) along the expected (2D) crack path: an assumed key element in defining an appropriate fatigue design (and detectable repair) criterion. Examining σn and σnr the involved stress components have been distinguished. A self-equilibrating weld geometry stress – consisting of a local V-shaped notch- and weld load carrying part – and equilibrium equivalent global structural field stress are identified; a refinement of a well-known definition. All welded joint geometry parameters are involved. Exploiting (non-)symmetry conditions (i.e. for a single edge notch, double edge notch and centre notch), the formulation has been generalised and stress field similarity has been observed. Results have been extended to the welding induced thermal residual stress distributions σnr and σnrr. A linear superposition of the two distributions provides the total ones; σnT and σnrT. No Battelle bi-linear approximation (Section 2.8) is involved, meaning the actual rather than compromised peak stress and stress gradients are included. A weld load carrying stress related transition point assumption is prevented for as well. In case of symmetry with respect to (tp/2) the welded joint far field stress definition can be maintained preventing for a double standard in scaling parameter assumption and no solid FE modelling is needed to capture the structural field stress distribution.
Fatigue scaling requires both the peak stress value as well as notch affected- and far field dominated gradient to be incorporated, meaning a damage criterion should take the complete distribution into account. The stress intensity factor KI seems to meet this criterion and the intact geometry related notch stress distributions have been translated into a cracked geometry equivalent exploiting (non-) symmetry conditions. At the same time, arc-welded joints inevitably contain flaws or crack nuclei (defects) at the weld toe and root notches, justifying a damage tolerant parameter like KI(Yn, Yf, a/tp). The equilibrium equivalent stress contribution has been used to obtain far field factor Yf, distinguishing different type of cracks related to (non-) symmetry conditions for both (quasi) 2D- and 3D-configurations; configurations; i.e. single edge crack, double edge crack and centre crack formulations. Notch factor Yn incorporates the self-equilibrating stress. Mechanical weld toe and weld root stress intensities show the notch affected micro- and far field dominated macro-crack regions, turning the stress field similarity into a stress intensity similarity. For a → 0 the KI(Yn, Yf, a/tp) behaviour is finite rather than singular like for Battelle (Section 2.8). Each stress component dominates a certain crack length range: the notch stress the micro-crack region, the structural field stress the macro-crack region; the weld load carrying stress determines the transition (i.e. apex) location. The welding induced and displacement controlled mode-I residual stress intensity factor KIr is acquired for both weld toe and weld root notches to complete the total weld notch stress intensity similarity factor formulation KIT.
Cyclic mechanical- and quasi-constant thermal residual loading turn KIT into a crack growth driving force ΔKIT and defects may develop into cracks. The growth rate of micro-cracks emanating at notches show – at least for CA loading – elastoplastic wake field affected anomalies, i.e. monotonically increasing (generalising the Battelle formulation; Section 2.8) or non-monotonic behaviour beyond the material threshold. Modifying Paris’ equation, a two-stage micro- and macro-crack growth law similarity (da/dn) = C·Yn n·{ΔKf/(1–rlr)1-γ}m is developed (Section 2.7) to include both the weld notch (Yn) and far field characteristic (Yf) contributions, elastoplasticity (n) as well as mechanical- and thermal residual mean stress effects (1-rlr)1-γ.
Crack growth model integration yields a (MCF) single slope resistance relation, a joint ST-N curve correlating the weld toe and weld root failure induced arc-welded joint life time N and the (finite life) total stress parameter ST = Δσs/{(1−rlr)1−γ·IN(a/tp, rs, n, m)1/m· tp(2−m)/(2m)}; an area equivalent line criterion to estimate marine structural integrity and longevity ensuring welded joint fatigue resistance similarity between SSS, LSS and FSS. Gradient induced size effects are explicitly taken into account. A random fatigue limit formulation has been adopted to incorporate HCF taking the transition in fatigue damage mechanism (i.e. growth dominant turns into initiation controlled for decreasing loading & response level), a slope change, into account. As-welded CA SSS complete and censored data have been used to establish one (family of damage tolerant engineering) joint ST-N fatigue resistance curve(s) to be able to estimate the fatigue life time N of welded joints knowing the joint geometry and far field structural response. All model parameter estimates are obtained using regression analysis of as-welded joint fatigue resistance data to ensure SSS, LSS and FSS similarity in that respect. The (average) real defect size (ai/tp); a material characteristic cracked geometry parameter process zone, is estimated optimising the fatigue resistance residual. A material characteristic crack increment Δa is not considered in this respect. The weakest link induced statistical size effect is not incorporated yet. The elastoplasticity coefficient estimate (n ∼ 1) is about half the Battelle value (suggested to be the same value for different materials) based on SIF considerations; a geometry and loading & response dependent parameter. FSS representative CA LSS data has been examined to verify a CA SSS data scatter band fit. The obtained strength scatter band index TσS for ST (∼1.6) in comparison to the KN, WNA, σp and σp,eq value (∼1.8) is typically smaller. Since CA SSS and CA LSS fatigue resistance is principally used to estimate a VA FSS value adopting the Palmgren–Miner hypothesis, VA SSS data is examined and a scatter band fit is observed. The involved equivalent total stress parameter ST,eq is obtained adopting an extended rain flow counting algorithm to capture the damage cube.
Replacing the involved structural stress range Δσs by its strain equivalent Δϵs introduces a strain intensity based parameter and could be used to merge arc-welded joint fatigue resistance information for different metals in a particular environment, assuming micro- and meso-material effects (including defect size) can be neglected (Section 2.2).
3. Fatigue damage criteria developments and trends
The fatigue damage criterion defines the integrity and longevity (i.e. fatigue strength and life time) estimate accuracy from modelling perspective. Developments over time aim to improve – the still incomplete – similarity (equal strength values should provide the same life time) and trends can be observed towards complete strength, multi-scale and total life modelling (). Fatigue damage criteria tend to become more generalised formulations and the number of corresponding fatigue resistance curves reduces accordingly (i.e. ultimately to one), satisfying SSS, LSS and FSS welded joint fatigue resistance similarity at the same time (e.g. Lotsberg and Landet Citation2005; Fricke and Paetzold Citation2010).
Figure 9. Fatigue damage criterion developments and trends aiming for similarity.
Incorporating all four (interacting) fatigue resistance dimensions () explicitly in the model description eliminates influence factors (e.g. for multi-axiality, cyclic mechanical- as well as quasi-constant welding induced thermal residual mean stress and corrosion) and translates into a complete strength fatigue damage criterion. Additional macro-, meso- and micro-fatigue damage mechanism information – physics at smaller scale () – can be used to enhance an engineering based model, providing a multi-scale fatigue damage criterion. Medium- and high-cycle fatigue involve respectively a crack growth and initiation governing life time N (). Correlation requires matching of a cracked and intact geometry parameter and reveals a total life fatigue damage criterion.
Using the complete fatigue strength dimensions, multi-scale physics, and total life components to increase accuracy, however, is typically associated with increased criterion complexity and (computational) effort (; Marquis and Samuelsson Citation2005). The challenge is to aim for balance.
Figure 10. Typical fatigue damage criterion accuracy, complexity and effort relation.
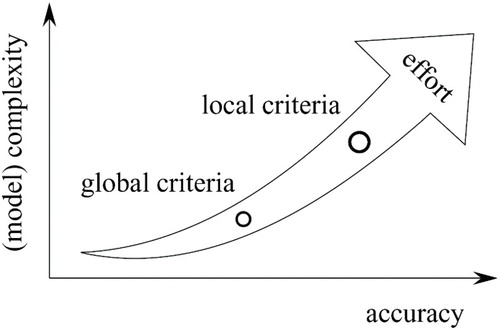
3.1. Complete strength criteria
In order to reduce the fatigue strength scatter, i.e. to improve structural integrity, the fatigue damage criterion should take the material, geometry, loading & response and environment dimensions explicitly into account.
Provided the damage mechanism in different (polycrystalline) metals is the same, involving strain rather than stress based criteria (e.g. Section 2.2) describes the fatigue resistance of a group of materials rather than individual ones. At the same time more data is available, increasing the curve parameters confidence. Criteria applicable to both plane and notched geometries (e.g. respectively Yn = 1 and Yn = f(a) for the Battelle- and Total Stress criterion; Section 2.8 and 2.9) complete the merger from reference resistance perspective; i.e. dimensions 1 and 2 ().
The (quasi-static) welding induced distortions and residual stress; a dimension 3 component, affect the fatigue resistance (e.g. Krebs and Kassner Citation2007). Residual stress modelling includes analytical formulations as well as thermo-mechanical FE simulations (e.g. Dong et al. Citation2001; Teng and Chang Citation2004; Ferro et al. Citation2005; Dong Citation2008; Barsoum and Lundbäck Citation2009), for example incorporated as total, i.e. blended cyclic mechanical- and thermal residual loading & response ratio (Den Besten Citation2015). CA and VA multi-axiality is another dimension 3 component to include explicitly (Section 2).
The corrosion damage process (dimension 4) consists of pit initiation and growth. Cyclic mechanical loading may turn the process into micro- and macro-crack growth, meaning no crack initiation is required to obtain fatigue damage. A crack growth rate exceeding the pit growth rate defines the transition, followed by propagation and finally fracture (Kondo Citation1989; Jakubowski Citation2014, Citation2015).
As long as the oxygen supply rate controls the corrosion rate (i.e. the environment is aerobic), the pitting depth ap as function of time is conventionally described using a power function; ap = c1 ’ ·(tg,o − ti)c2’, often simplified to ap = c1·(tg,o)c2 since the initiation time ti is negligible in comparison to the growth time tg,o. When corrosion products (e.g. rust) start to affect the ap oxygen supply (i.e. the environment becomes anaerobic) temperature T starts to affect the process exponentially; tg,T = c3·exp(c4·T). Adopting an engineering- rather than a physical–chemical–biological based model, a Weibull function can be selected as well for macro-sized pits; ap = ad·{1 − exp(-[c2·(t − ti)]c3)} with c1 and c2 as scale and shape parameters and ad as long-term pit depth. Non-linearities prevent for micro-sized pit applications. The (extreme) ap distribution is important to incorporate the weakest link induced statistical size effects. For corrosion fatigue of weld notches the exposed weld seam length needs to be considered, as well as the interaction between welding and corrosion induced defects.
In case the pit growth rate equals the crack growth rate a critical (often blunt) pit depth apc has been reached and crack growth is taking over control, introducing the SIF K, crack growth driving force ΔK and corresponding crack growth relations in case ΔK > ΔKth. Micro-crack growth characteristics depend on the (electro-chemistry and elastoplasticity affected) crack tip wake field. The critical pit depth apc is time and loading & response level dependent; an interaction effect. In case of decreasing (exposure) time or/and loading & response level apc increases, and the other way around. For the macro-crack growth part models have been developed involving a superposition of two uncoupled environmental (air and corrosion) contributions: (da/dn) = (da/dn)air + (da/dn)cor or even an additional interaction (i.e. coupling) term (da/dn) = (da/dn)air + (da/dn)int + (da/dn)cor. Alternatively a competition model can be adopted, meaning the crack growth rate is defined by the dominant contributor, either air or corrosion (e.g. Weng et al. Citation2013). With respect to the material, loading & response and environment dimensions, mechanical- and electro-chemical properties of the base material, heat affected zone and weld material, frequency, mean and residual stress, humidity and temperature (e.g. Guedes Soares et al. Citation2009; Adepipe et al Citation2015, Citation2016) affect and interact with the corrosion damage process as well. The geometry dimension related typical uniform corrosion induced plate thickness reduction implicitly increases the far field stress level.
Generally speaking, the fatigue resistance curves of welded joints in a corrosive environment show an endurance reduction (intercept log(C)) in comparison to curves for air, mainly because of the corrosion affected defect size. The mechanism (slope m) is similar since crack growth dominates the welded joint life time. Environment parameters are typically not explicitly incorporated in the fatigue damage criteria, explaining why separate resistance curves still exist for air and a corrosive environment.
3.2. Multi-scale criteria
Following the macro-scale developments from global to local fatigue damage criteria over time (Section 2) the continuum mechanics lower bound is approaching and a correlation to the ‘netherworld’, to meso- or even micro-scale physics, seems to be a next step.
Although for MCF and HCF in metal materials the isotropic stress and strain response at macro-scale (Σ and E) is predominantly linear elastic, at anisotropic (grain) meso-scale the corresponding σ and ϵ involve a plasticity induced residual component f(ϵp) controlling the fatigue damage mechanism (Section 1): {Σ, E} = {σ, ϵ} + f(ϵp). Since the polycrystalline grain structure of metals is random, multi-axiality is involved by definition. For evaluation of the cyclic meso-scopic response based on macro-scopic information only – useful from engineering perspective – different homogenisation modelling assumptions can be adopted (Hofmann et al. Citation2009), e.g. presuming the sum of the meso-scopic elastic and plastic response components equal the macro-scopic ones: Ee + Ep = ϵe + ϵp. For decreasing response level meso-scopic plasticity will become negligible meaning an elastic response analysis at macro-scale will be sufficient.
Fatigue crack nucleation, the process of moving dislocations being assembled in (persistent) slip bands, requires (meso-scopic) cyclic shear, defined by the hydrostatic and deviatoric parts (J1 and J2) of a response cycle; i.e. stress range and loading & response ratio. In case the cyclic meso-scopic elastoplastic response will shake down over time to a pure elastic deviatoric part and a (constant) hydrostatic residual, the material will last forever; i.e. shows infinite life behaviour. Assuming fatigue damage involves a linear combination of the two parameters an intact geometry two-scale fatigue damage criterion has been proposed: J2 + a· J1 ≤ b (Dang Van Citation1993, Citation1999). Similar formulations are available as well (e.g. Papadopoulos et al. Citation1997). The time dependent material response at any location can be investigated in the J2 − J1 plane in order to verify if the ‘Danger’ criterion is satisfied or not. For infinite life region applications, the material and environment dependent parameters a and b, constants, can be obtained using experimental normal and shear fatigue limit test data. As finite life region criterion the elastic shakedown assumption is violated since the plasticity induced residual remains time dependent; parameters a and b will be loading & response level dependent.
The criterion has already been applied to welded joints (e.g. Dang Van et al. Citation2001) explicitly incorporating the residual stress, although even in the HCF region the fatigue life times are micro-crack growth rather than nucleation dominated. The framework still has to be generalised to incorporate notch effectivity; i.e. response gradient induced size effects (Charkaluk et al. Citation2009).
Local crack growth simulations can be embedded in global marine structural loading & response models in order to cover a range of scales (Sumi and Inoue Citation2011). Alternatively discontinuum and continuum damage mechanics might be used and correlated to model multi-scale fatigue, including two-scale micro-meso continuum formulations (e.g. Lemaitre et al. Citation1999), two-scale meso-macro discontinuum-continuum frameworks (e.g. Amiri-Rad et al. Citation2015) and even three-scale micro-meso-macro models (e.g. Montesano et al. Citation2016), although the latter seem predominantly developed for polymer composite materials.
In order to limit computational effort, local geometry and micro- and meso-material fatigue damage process information could be described (semi-)analytically and correlated to numerical global macro-structural information, like the weld notch stress distribution formulation and far field stress in the Total Stress criterion (Section 2.9).
3.3. Total life criteria
Over time the arc-welding induced defect size has become smaller because of technological and modelling developments (e.g. Lassen Citation1990; Verreman and Nie Citation1996; Darcis et al. Citation2006; Zhang and Maddox Citation2009; Hobbacher Citation2010; Chattopadhyay et al. Citation2011; Zerbst and Madia Citation2015) and (calculation) values decreased from 1.00 [mm] down to 0.05 [mm], meaning even for welded joints, although the life time is often assumed to be growth dominated, the crack initiation contribution to the total life time increases, in particular in the HCF region.
The transition between crack growth and initiation-dominated life times, MCF (N ∼ Ng) and HCF (N ∼ Ni), is typically a qualitative one. However, distinction is technically significant since the fatigue resistance curve shows a (gradual) intercept (i.e. endurance) and slope (i.e. mechanism) change (log(Cg) → log(Ci); mg → mi). Physics can be governing in one period and less important in the other one, introducing fatigue damage criterion modelling consequences like generally reflected in the adopted intact and cracked geometry parameter (Section 2).
Correlation of the initiation- and growth-life time quantifies the individual contributions (N = Ni + Ng) and requires matching of intact and cracked geometry parameters (e.g. NSIF and SIF) in order to provide a total life fatigue damage criterion improving the structural integrity estimates. Several two-stage two-parameter models have been proposed involving an assumed crack transition size at (e.g. Brandt et al. Citation2001; Lassen et al. Citation2005; Darcis et al. Citation2006; Lassen and Recho Citation2009; Chattopadhyay et al. Citation2011) based on different arguments: theoretical (e.g. fracture mechanics modelling restrictions), practical (e.g. detectability) as well as phenomenological (e.g. at = ρf adopting a material and notch characteristic structural length), affecting the (Ni/Ng) ratio up to a large extent.
Concerning crack initiation the Ramberg–Osgood relation and Coffin–Manson equation including Morrow's mean stress correction have been adopted. The involved notch stress concentration factor Kf(Kt) requires a notch radius ρ. Proposed values include either a worst case effective value ρe = ρf similar for weld toe and weld root notches (Brandt et al. Citation2001) or an extreme real value EV(ρ) including the statistical component (Darcis et al. Citation2006), respectively obtained using notched weld (root) material specimen fatigue test S − N data assuming N ∼ Ni and weld geometry measurement results. In case of a ρ = 0 assumption the SED rather than Kf(Kt) can be adopted as well (Section 2.5; Chattopadhyay et al. Citation2011). The material parameters including the intercept log(Ci) and slope mi are determined using smoot hour-glass shaped weld (root) material specimen in strain controlled tests (Brandt et al. Citation2001) or material dependent empirical relations calibrated using welded joint S − Ni fatigue test data covering the number of cycles up to the crack transition size at (Lassen and Recho Citation2009; Chattopadhyay et al. Citation2011). The mean stress σm is obtained using cyclic stress–strain measurement data of the hourglass shaped specimens (Brandt et al. Citation2001), welded joint fatigue resistance data with and without residual stress (Chattopadhyay et al. Citation2011) or is simply assumed to be at yield magnitude because of the welding induced residual stress (Darcis et al. Citation2006).
For crack growth naturally the linear elastic fracture mechanics cracked geometry parameter, SIF K(Yn, Yf, a/tp), is introduced incorporating the weld notch stress distribution along the assumed crack path. Cyclic mechanical loading turns K into a driving force ΔK, introducing the Paris equation (da/dn) = Cg’·(ΔK)mg in order to obtain the Basquin type of relation for the crack growth part: log(Ng) = log(Cg) − mg·log{∫f(ΔK)da}. Typically standard crack growth specimens are used to acquire the intercept Cg’ and the slope mg (Brandt et al. Citation2001; Lassen et al. Citation2005; Darcis et al. Citation2006; Lassen and Recho Citation2009).
A slightly different two-stage two-parameter model is based on the transition rate drt/dn and dat/dn: the initiation process is assumed to be completed if the crack growth rate exceeds the crack initiation rate (Socie et al. Citation1979; Chakherlou et al. Citation2012; Mohammadi et al. Citation2016). Using plane geometry fatigue resistance information for a particular material, loading & response condition as well as environment, the Ramberg–Osgood relation and Coffin–Manson equation including Morrow's mean stress correction have been adopted to establish the fatigue initiation resistance relation assuming N ∼ Ni. For the crack growth contribution, standard specimen crack growth data is adopted and the Paris’ equation has been defined including Walker's mean stress correction, translated into a Basquin type of relation. Using the notch affected response distribution along the assumed crack path, for each location r an Ni(r) can be obtained. The Ni(r) relation is similar to Ng(a) typically available for crack growth life times. Superimposing the reciprocal derivative (dr/dNi) versus r on a growth related (da/dNg) versus a plot, the intersection point defines the initiation growth transition and the corresponding rt and at can be used to estimate the initiation and growth life time contributions. Note that (dr/dNi) is implicitly taking care of the response gradient induced size effects concerning Ni, meaning that an effective (notch) stress concentration is not required.
Question is whether a two-parameter concept is the best solution to include two-stage behaviour. Except for the transition size at, the actual as-welded joint fatigue test data is only used for calibration purposes of some crack initiation model parameters or not involved at all, assuming a series of initiation and growth similarity conditions of (standard) specimen and as-welded joints rather than a one-to-one correspondence between model life time estimate and S-N test data; a welded joint fatigue resistance similarity. Alternative to a one-stage one-parameter model (e.g. the cracked geometry parameter SIF K and the Paris relation using a defect size equal to the intact geometry material characteristic micro- and meso-structural length ρ*; Noroozi et al. Citation2005; Mikheevskiy et al. Citation2015) or a two-stage two-parameter model, a two-stage one-parameter model like the total stress ST can be adopted as well. A natural transition from a growth governing to an initiation dominated life time is for example possible by introducing a loading & response level dependent elastoplasticity coefficient n (Section 2.9), changing the crack growth characteristic from non-monotonic to monotonically increasing. Adopting the SED as fatigue damage criterion, a generalised relationship has been established for intact and cracked geometries (Huffman Citation2016), providing an opportunity to correlate initiation and growth as well.
4. Conclusions
Fatigue is typically a governing limit state for marine structures. Welded joints connecting the structural members are the weakest links in that respect. Physics involve several resistance dimensions (), a range of scales () and distinct contributions in different stages of the damage process (). Fatigue damage criteria developed over time have been classified () with respect to type of information, geometry, parameter and process zone including plane and life region annotations. The criteria are evaluated regarding model (in)capabilities, showing up to what extent (governing) physics are taken into account.
The fatigue damage criterion defines the marine structural integrity and longevity (i.e. fatigue strength and life time estimate) accuracy from modelling perspective and controls the reliability level that can be achieved; confidence is a matter of sufficient test data. Modelling developments aim to improve – the still incomplete – similarity (equal strength values should provide the same life time) and trends have been identified towards complete strength, multi-scale and total life criteria. Formulations tend to become more generalised and the number of corresponding fatigue resistance curves reduces accordingly (i.e. ultimately to one), satisfying SSS, LSS and FSS welded joint fatigue resistance similarity at the same time. Incorporating all four (interacting) fatigue resistance dimensions: material, geometry, loading & response and environment, explicitly in the model description eliminates influence factors (e.g. for multi-axiality, cyclic mechanical as well as quasi-constant welding induced thermal residual mean stress and corrosion) and translates into a complete strength fatigue damage criterion. Additional macro-, meso- and micro-fatigue damage mechanism information – physics at smaller scale – can be used to enhance an engineering based model, providing a multi-scale fatigue damage criterion. Matching of intact and cracked geometry parameters correlates medium and high cycle fatigue, crack initiation and growth, reveals a total life fatigue damage criterion.
Using the complete fatigue strength dimensions, multi-scale physics and total life components to increase accuracy, however, is typically associated with increased criterion complexity and (computational) effort. The challenge is to aim for balance for both marine structural limit state design and analysis components: demand and capacity.
Disclosure statement
The author did not report a potential conflict of interest.
References
- Adepipe O, Brennan F, Kolios A. 2015. Corrosion fatigue crack growth in offshore wind monopile steel HAZ material. In: Soraes CG, Shenoi RA, editors. Analysis and design of marine structures V. London: CRC Press; p.–207–212. ISBN: 978-1-138-02789-3.
- Adepipe O, Brennan F, Kolios A. 2016. A relative crack opening time correlation for corrosion fatigue crack growth in offshore structures. Fatigue Fract Eng Mater Struct. 39:395–411. doi: 10.1111/ffe.12364
- Amiri-Rad A, Maskayekhi M, Van der Meer F, Hadavinia H. 2015. A two-scale damage model for high cycle fatigue delamination in laminated composites. Compos Sci Technol. 120:32–38. doi: 10.1016/j.compscitech.2015.10.010
- Barsoum Z, Lundbäck A. 2009. Simplified FE welding simulation of fillet welds–3D effects on the formation of residual stresses. Eng Failure Anal. 16:2281–2289. doi: 10.1016/j.engfailanal.2009.03.018
- Bathias C. 2014. Fatigue limit in metals. Hoboken (NJ): Wiley-ISTE. ISBN: 978-1-848-21476-7.
- Brandt U, Lawrence FV, Sonsino CM. 2001. Fatigue crack initiation and growth in AlMg4.5Mn butt weldments. Fatigue Fract Eng Mater Struct. 24:117–126. doi: 10.1046/j.1460-2695.2001.00372.x
- Carpinteri A, Spagnoli A, Vantadori S. 2009. Multiaxial fatigue life estimation in welded joints using the critical plane approach. Int J Fatigue. 31:188–196. doi: 10.1016/j.ijfatigue.2008.03.024
- Chakherlou TN, Taghizadeh H, Mirzajanzadeh M, Aghdam AB. 2012. On the prediction of fatigue life in double shear lap joints including interference fitted pin. Eng Fract Mech. 96:340–354. doi: 10.1016/j.engfracmech.2012.08.023
- Charkaluk E, Constantinescu A, Maïtournam H, Dang Van K. 2009. Revisiting the Dang Van criterion. Procedia Eng. 1:143–146. doi: 10.1016/j.proeng.2009.06.033
- Chattopadhyay A, Glinka G, El-Zein M, Qian J, Formas R. 2011. Stress analysis and fatigue of welded structures. Weld World. 55:2–21. doi: 10.1007/BF03321303
- Cristofori A, Susmel L, Tovo R. 2008. A stress invariant based criterion to estimate fatigue damage under multiaxial loading. Int J Fatigue. 30:1646–1658. doi: 10.1016/j.ijfatigue.2007.11.006
- Crossland B. 1956. Effect of large hydrostatic stress on the torsional fatigue strength of an alloy steel. In Proceeding of the International Conference on Fatigue of Metals, Institution of Mechanical Engineers; London, United Kingdom. p. 138–149.
- Cui W. 2002. A state-of-the-art review on fatigue life prediction methods for metal structures. J Marine Sci Technol. 7:43–56. doi: 10.1007/s007730200012
- Cui W, Huang X, Wang F. 2014. Towards a unified fatigue life prediction method for marine structures. Berlin: Springer. ISBN: 978-3-642-41830-3.
- Cui W, Wang F, Huang X. 2011. A unified fatigue life prediction method for marine structures. Marine Struct. 24:153–181. doi: 10.1016/j.marstruc.2011.02.007
- Dang Van K. 1993. Macro-micro approach in high-cycle multiaxial fatigue. In: McDowell DL, Ellis R, editors. Proceedings of the Advances in Multiaxial Fatigue, ASTM STP 1191. Philadelphia (PA): ASTM; p. 120–130.
- Dang Van K. 1999. Multiaxial fatigue limit criterion of metals: a mesoscopic approach. In: Dang Van K, Papadopoulos IV., editors High-cycle metal fatigue, from theory to applications. CISM courses and lectures No. 392. International Centre for Mechanical Sciences. Springer-Verlag Wien GmbH; p. 57–88. ISBN: 978-3-211-831441.
- Dang Van K, Bignonnet A, Fayard JL, Janosch JJ. 2001. Assessment of welded structures by a local multiaxial fatigue approach. Fatigue Fract Eng Mater Struct. 24:369–376. doi: 10.1046/j.1460-2695.2001.00399.x
- Danzer R, Supancic P, Pascual J, Lube T. 2007. Fracture statistics of ceramics–Weibull statistics and deviations from Weibull statistics. Eng Fract Mech. 74:2919–2932. doi: 10.1016/j.engfracmech.2006.05.028
- Darcis P, Lassen T, Recho N. 2006. Fatigue behaviour of welded joints part 2–physical modelling of the fatigue process. Weld J. 85:19s–26s.
- Den Besten JH. 2015. Fatigue resistance of welded joints in aluminium high-speed craft: a total stress concept [PhD thesis]. Delft: Delft University of Technology.
- DNV-GL classification note 30.7 (2014). Fatigue assessment of ship structures.
- Donald KJ, Paris PC. 1999. An evaluation of ΔKeff estimation procedures on 6061-T6 and 2024-T3 aluminium alloys. Int J Fatigue. 21:47–57. doi: 10.1016/S0142-1123(99)00055-9
- Dong P. 2001. A structural stress definition and numerical implementation for fatigue analysis of welded joints. Int J Fatigue. 23:865–876. doi: 10.1016/S0142-1123(01)00055-X
- Dong P. 2003. A robust structural stress method for fatigue analysis of ship structures. In: Proceedings of the 22nd International Conference on Offshore Mechanics and Arctic Engineering, OMAE 2003; Jun 8–13; Cancun, Mexico: ASME.
- Dong P. 2004. The mesh-insensitive structural stress and master S-N curve method for ship structures. In: Proceedings of the 23rd International Conference on Offshore Mechanics and Arctic Engineering, OMAE 2004; Aug 30--Sep 2; Vancouver, Canada. Houston (TX): ASME.
- Dong P. 2008. Length scale of secondary stresses in fracture and fatigue. Int J Pressure Vessels Pip. 85:128–143. doi: 10.1016/j.ijpvp.2007.10.005
- Dong P, Hong JK. 2001. Residual stresses, notch stress and stress intensities at welds: an unified assessment procedure with self-consistency. In: Proceeding of the 16th International Conference on Structural Mechanics in Reactor Technology, SMiRT 16; Washington, DC.
- Dong P, Hong JK. 2004. The master S-N curve approach to fatigue evaluation of offshore and marine structures. In: ASME, editor. Proceedings of the 23rd International Conference on Offshore Mechanics and Arctic Engineering, OMAE 2004. Vancouver, British Columbia, Canada.
- Dong P, Hong JH. 2006. A robust structural stress parameter for evaluation of multiaxial fatigue of weldments. J ASTM Int. 3:100348. doi: 10.1520/JAI100348
- Dong P, Hong JK, Cao Z. 2003. Stresses and stress intensities at notches: ‘anomalous crack growth’ revisited. Int J Fatigue. 25:811–825. doi: 10.1016/S0142-1123(03)00130-0
- Dong P, Hong JK, Cao Z. 2004. A robust K estimation scheme using mesh-insensitive structural stresses. Weld World. 48:28–39.
- Dong P, Hong JK, De Jesus AMP. 2007. Analysis of recent fatigue data using the structural stress procedure in ASME Div. J Press Vessel Technol. 129:355–362. doi: 10.1115/1.2748818
- Dong P, Pei X, Xing S, Kim MH. 2014. A structural strain method for low-cycle fatigue evaluation of welded components. Int J Press Vessel Pip. 119:39–51. doi: 10.1016/j.ijpvp.2014.03.003
- Dong P, Wei Z, Hong ZW. 2010. A path-dependent cycle counting method for variable-amplitude multi0axial loading. Int J Fatigue. 32:720–734. doi: 10.1016/j.ijfatigue.2009.10.010
- Elber W. 1971. The significance of fatigue crack closure. In: ASTM, editor. Proceedings of the Damage tolerance in aircraft structures, ASTM STP 486, American Society for Testing and Materials. p. 230–242.
- El Haddad MH, Smith KN, Topper TH. 1979. Fatigue crack propagation at short cracks. J Eng Mater Technol. 101:42–46. doi: 10.1115/1.3443647
- Endo M, McEvily AJ. 2007. Prediction of the behaviour of small fatigue cracks. Mat Sci Eng. 468–470:51–58. doi: 10.1016/j.msea.2006.09.084
- Erny C, Thevenet D, Cognard J, Körner M. 2012. Fatigue life prediction of welded ship details. Mar Struct. 25:13–32. doi: 10.1016/j.marstruc.2011.10.001
- Eurocode 3. Design of steel structures–part 1-9: fatigue. 2006. EN-1993-1-9. Brussels: CEN.
- Eurocode 9. Design of aluminium structures–part 1-3: structures susceptible to fatigue 2007. EN-1999-1-3. Brussels: CEN.
- Ferro P, Berto F, Lazzarin P. 2005. Generalised stress intensity factors due to steady and transient thermal loads with applications to welded joints. Fatigue Fract Eng Mater Struct. 29:440–453. doi: 10.1111/j.1460-2695.2006.01015.x
- Fricke W. 2002. Recommended hot-spot analysis procedure for structural details of ships and FPSO's based on round-robin FE analyses. Int J Offshore Polar Eng. 12:40–47.
- Fricke W. 2003. Fatigue analysis of welded joints: state of development. Mar Struct. 16:185–200. doi: 10.1016/S0951-8339(02)00075-8
- Fricke W. 2015. Recent developments and future challenges in fatigue strength assessment of welded joints. Proc Inst Mech Eng. 229:1224–1239.
- Fricke W, Bollero A, Chirica I, Garbatov Y, Jancart F, Kahl A, Remes H, Rizzo CM, Von Selle H., Urban A, et al. 2008. Round robin study on structural hot-spot and effective notch stress analysis. Ships Offshore Struct. 3:335–345. doi: 10.1080/17445300802371261
- Fricke W, Codda M, Feltz O, Garbatov Y, Remes H, Risso G, Rizzo C, Romanoff J. 2013. Round robin study on local stress and fatigue assessment of lap joints and doubler plates. Ships Offshore Struct. 8:621–627. doi: 10.1080/17445302.2012.762727
- Fricke W, Paetzold H. 2010. Full-scale fatigue tests of ship structures to validate the S-N approaches for fatigue strength assessment. Mar Struct. 23:115–130. doi: 10.1016/j.marstruc.2010.01.004
- Frost NE, Dugdale DS. 1958. The propagation of fatigue cracks in sheet specimens. J Mech Phys Solids. 6:92–110. doi: 10.1016/0022-5096(58)90018-8
- Gavras AG, Lados DA, Donald JK. 2013. A unified method of design for fatigue crack growth resistance in structural materials. Int J Fatigue. 47:58–70. doi: 10.1016/j.ijfatigue.2012.07.009
- Guedes Soares C, Garbatov Y, Zayed A, Wang G. 2009. Influence of environmental factors on corrosion of ship structures in marine atmosphere. Corros Sci. 51:2014–2026. doi: 10.1016/j.corsci.2009.05.028
- Glinka G. 1985. Energy density approach to calculation of inelastic strain-stress near notches and cracks. Eng Fract Mech. 22:485–508. doi: 10.1016/0013-7944(85)90148-1
- Gough HJ, Pollard HV. 1935. The strength of metals under combined alternating stresses. Proc Inst Mech Eng. 131:3–103. doi: 10.1243/PIME_PROC_1935_131_008_02
- Hertel O, Vormwald M. 2014. Multiaxial fatigue assessment based on a short crack growth concept. Theor Appl Fract Mech. 73:17–26. doi: 10.1016/j.tafmec.2014.06.010
- Hobbacher AF. 2009. The new IIW recommendations for fatigue assessment of welded joints and components–a comprehensive code recently updated. Int J Fatigue. 31:50–58. doi: 10.1016/j.ijfatigue.2008.04.002
- Hobbacher AF. 2010. New developments at the recent update of the IIW recommendations for fatigue of welded joints and components. Steel Constr. 4:231–242. doi: 10.1002/stco.201010030
- Hobbacher AF. 2016. Recommendations for fatigue design of welded joints and components. 2nd ed. Switzerland: Springer International. ISBN: 978-3319237565.
- Hofmann F, Bertolino G, Constantinescu A, Ferjani M. 2009. Numerical exploration of the Dang Van high cycle fatigue criterion: application to gradient effects. J Mech Mater Struct. 4:293–308. doi: 10.2140/jomms.2009.4.293
- Hong JK. 2010. Evaluation of weld root failure using Battelle structural stress method. In: ASME, editor. Proceedings of the ASME 29th International Conference on Ocean, Offshore and Arctic Engineering, OMAE 2010, Shanghai, China.
- Hong JK, Forte TP. 2014. Fatigue evaluation procedures for multiaxial loading in welded structures using Battelle structural stress approach. In: ASME, editor. Proceedings of the 33rd International Conference on Ocean, Offshore and Arctic Engineering, OMAE 2014; San Francisco (CA): ASME.
- Huang X, Moan T, Cui W. 2009. A unique crack growth rate curve method for fatigue life prediction of steel structures. Ships Offshore Struct. 4:165–173. doi: 10.1080/17445300902732370
- Huffman PJ. 2016. A strain energy based damage model for fatigue crack initiation and growth. Int J Fatigue. 88:197–204. doi: 10.1016/j.ijfatigue.2016.03.032
- Jakubowski M. 2014. Influence of pitting corrosion on fatigue and corrosion fatigue of ship structures–part I. Pol Maritime Res. 21:62–69.
- Jakubowski M. 2015. Influence of pitting corrosion on fatigue and corrosion fatigue of ship and offshore structures–part II. Pol Maritime Res. 22:57–66.
- Janssen M, Zuidema J, Wanhill RJH. 2002. Fracture mechanics. 2nd ed. Delft: Delft University Press. ISBN: 90-407-2221-8.
- Jiang C, Liu ZC, Wang XG, Zhang Z, Long XY. 2016. A structural stress-based critical plane method for multiaxial fatigue life estimation in welded joints. Fatigue Fract Eng Mater Struct. 39:372–383. doi: 10.1111/ffe.12369
- Jones R, Chen B, Pitt S. 2007. Similitude: fatigue cracking in steels. Theor Appl Fract Mech. 48:161–168. doi: 10.1016/j.tafmec.2007.05.007
- Jones R, Molent L, Pitt S. 2007. Crack growth of physically small cracks. Int J Fatigue. 29:1658–1667. doi: 10.1016/j.ijfatigue.2007.01.031
- Kim JS, Kim C, Jin TE, Dong P. 2006. Mean load effect on fatigue of welded joints using structural stress and fracture mechanics approach. Nucl Eng Technol. 38:277–284.
- Kim Y, Oh JS, Jeon SH. 2015. Novel hot spot stress calculations for welded joints using 3D solid finite elements. Mar Struct. 44:1–18. doi: 10.1016/j.marstruc.2015.07.004
- Kondo Y. 1989. Prediction of fatigue crack initiation life based on pit growth. Corrosion. 45:7–11. doi: 10.5006/1.3577891
- Krebs J, Kassner M. 2007. Influence of welding residual stresses on fatigue design of welded joints and components. Weld World. 51:54–68. doi: 10.1007/BF03266586
- Krupp U. 2007. Fatigue crack propagation in metals and alloys. Weinheim: Wiley-VCH Verlag GmbH & Co. KGaA. ISBN: 978-3-527-31537-6.
- Kujawski D. 2001. A fatigue crack driving force parameter with load ratio effects. Int J Fatigue. 23:239–246. doi: 10.1016/S0142-1123(01)00158-X
- Lassen T. 1990. The effect of the welding process on the fatigue crack growth. Weld J. 69:75s–81s.
- Lassen T, Recho N. 2009. Proposal for a more accurate physically based S-N curve for welded steel joints. Int J Fatigue. 31:70–78. doi: 10.1016/j.ijfatigue.2008.03.032
- Lassen T, Darcis P, Recho N. 2005. Fatigue behavior of welded joints part 1 – statistical methods for fatigue life prediction. Weld J. 84:183s–187s.
- Lazzarin P, Filippi S. 2006. A generalized stress intensity factor to be applied to rounded V-shaped Notches. Int J Solids Struct. 43:2461–2478. doi: 10.1016/j.ijsolstr.2005.03.007
- Lazzarin P, Livieri P. 2001. Notch stress intensity factors and fatigue strength of aluminium and steel welded joints. Int J Fatigue. 23:225–232. doi: 10.1016/S0142-1123(00)00086-4
- Lazzarin P, Sonsino CM, Zambardi R. 2004. A notch stress intensity approach to assess the multiaxial fatigue strength of welded tube-to-flange joints subjected to combined loadings. Fatigue Fract Eng Mater Struct. 27:127–140. doi: 10.1111/j.1460-2695.2004.00733.x
- Lazzarin P, Tovo R. 1998. A notch intensity factor approach to the stress analysis of welds. Fatigue Fract Eng Mater Struct. 21:1089–1103. doi: 10.1046/j.1460-2695.1998.00097.x
- Lazzarin P, Zambardi R. 2001. A finite-volume-energy based approach to predict the static and fatigue behaviour of components with sharp V-shaped notches. Int J Fract. 112:275–298. doi: 10.1023/A:1013595930617
- Lazzarin P, Zambardi R. 2002. The equivalent strain energy density approach reformulated and applied to sharp V-shaped notches under localized and generalized plasticity. Fatigue Fract Eng Mater Struct. 25:917–928. doi: 10.1046/j.1460-2695.2002.00543.x
- Lemaitre J, Chaboche JL. 1994. Mechanics of solid materials. 1st ed. Cambridge (UK): Cambridge University Press. ISBN: 0521477581.
- Lemaitre J, Sermage JP, Desmorat R. 1999. A two scale damage concept applied to fatigue. Int J Fract. 97:67–81. doi: 10.1023/A:1018641414428
- Liu G, Liu Y, Huang Y. 2014. A novel structural stress approach for multi-axial fatigue strength assessment of welded joints. Int J Fatigue. 63:171–182. doi: 10.1016/j.ijfatigue.2014.01.022
- Liu Y, Mahadevan S. 2009. Fatigue limit prediction of notched components using short crack growth theory and an asymptotic interpolation method. Eng Fract Mech. 76:2317–2331. doi: 10.1016/j.engfracmech.2008.06.006
- Livieri P, Lazzarin P. 2005. Fatigue strength of steel and aluminium welded joints based on generalised stress intensity factors and local strain energy values. Int J of Fracture. 133:247–276. doi: 10.1007/s10704-005-4043-3
- Lotsberg I. 2009. Assessment of design criteria for fatigue cracking from weld toes subjected to proportional loading. Ships Offshore Struct. 4:175–187. doi: 10.1080/17445300902733998
- Lotsberg I. 2016. Fatigue design of marine structures. New York (NY): Cambridge University Press. ISBN: 978-1107121331.
- Lotsberg I, Landet E. 2005. Fatigue capacity of side longitudinals in floating structures. Mar Struct. 18:25–42. doi: 10.1016/j.marstruc.2005.08.002
- Maddox SJ. 1975. The effect of mean stress on fatigue crack propagation; a literature review. Int J Fract. 11:389–408. doi: 10.1007/BF00038890
- Maddox SJ. 2003. Review of fatigue assessment procedures for welded aluminium structures. Int J Fatigue. 25:1359–1378. doi: 10.1016/S0142-1123(03)00063-X
- Marquis G, Samuelsson J. 2005. Modelling of fatigue life assessment of complex structures. Materialwissenschaft und Werkstofftechnik. 36:678–684. doi: 10.1002/mawe.200500938
- Marquis GB, Socie DF. 2003. Multiaxial fatigue. In: Ritch RO, Murakami Y, editors. Comprehensive structural integrity, fracture of materials from nano to macro (voume 4: cyclic loading and fatigue). Elsevier. Chapter 9; p. 221–252.
- McEvily AJ. 1983. On the quantitative analysis of fatigue crack propagation. In: Proceedings of the Fatigue Mechanisms: Advances in Quantitative Measurements of Physical Damage, STM STP 811. American Society for Testing and Materials (ASTM). p. 283–312.
- McEvily AJ, Ishihara S. 2001. On the dependence of the rate of fatigue crack growth on the σ(2a) parameter. Int J Fatigue. 23:115–120. doi: 10.1016/S0142-1123(00)00080-3
- McEvily AJ, Endo M, Murakami Y. 2003. On the area relationship and the short fatigue crack threshold. Fatigue Fract Eng Mater Struct. 26:269–278. doi: 10.1046/j.1460-2695.2003.00636.x
- McEvily AJ, Minakawa K. 1984. Crack closure and the growth of short and long fatigue cracks. Scripta Metallurgica. 18:71–76. doi: 10.1016/0036-9748(84)90092-9
- Mei J, Dong P. 2016. A new path-dependent fatigue damage model for non-proportional multi-axial loading. Int J Fatigue. 90:210–221. doi: 10.1016/j.ijfatigue.2016.05.010
- Meneghetti G, Campagnolo A, Berto F. 2015. Fatigue strength assessment of partial and full-penetration steel and aluminium butt-welded joints according to the peak stress method. Fatigue Fract Eng Mater Struct. 38:1419–1431. doi: 10.1111/ffe.12342
- Meneghetti G, Lazzarin P. 2006. Significance of the elastic peak stress evaluated by FE analyses at the point of singularity of sharp V-notched components. Fatigue Fract Eng Mater Struct. 30:95–106. doi: 10.1111/j.1460-2695.2006.01084.x
- Meneghetti G, Lazzarin P. 2011. The peak stress method for fatigue strength assessment of welded joints with weld toe or weld root failures. Weld World. 55:22–29. doi: 10.1007/BF03321304
- Mikheevskiy S, Glinka G, Cordes T. 2015. Total life approach for fatigue estimation of welded structures. Proceedings of 3rd International Conference on Material and Component Performance under Variable Amplitude Loading, VAL2015. Procedia Eng. 101:177–184. doi: 10.1016/j.proeng.2015.02.023
- Mohammadi M, Zehsaz M, Hassanifard S, Rahmatfam A. 2016. An evaluation of total fatigue life prediction of a notched shaft subjected to cyclic bending load. Eng Fract Mech. 166:128–138. doi: 10.1016/j.engfracmech.2016.08.027
- Molent L, Jones R, Barter S, Pitt S. 2006. Recent developments in fatigue crack growth assessment. Int J Fatigue. 28:1759–1768. doi: 10.1016/j.ijfatigue.2006.01.004
- Montesano J, Chu H, Sing CV. 2016. Development of a physics-based multi-scale progressive damage model for assessing the durability of wind turbine blades. Compos Struct. 141:50–62. doi: 10.1016/j.compstruct.2016.01.011
- Murakami S. 2012. Continuum damage mechanics: a continuum damage mechanics approach to the analysis of damage and fracture. Dordrecht: Springer. ISBN: 978-94-007-2666-6.
- Neuber H. 1937, 1958, 1985, 2001. Kerbspannungslehre (4. Aufl.). Berlin: Springer-Verlag. ISBN: 3-540-67657-0.
- Niemi E, Fricke W, Maddox SJ. 2006. Fatigue analysis of welded components–designer's guide to the structural hot spot stress approach. Abington (PA): Woodhead Publishing Limited. ISBN: 978-1-84569-124-0.
- Noroozi AH, Glinka G, Lambert S. 2005. A two parameter driving force for fatigue crack growth analysis. Int J Fatigue. 27:1277–1296. doi: 10.1016/j.ijfatigue.2005.07.002
- Obrtlík K, Man J, Polák J. 2004. Effect of mean stress on short crack growth in fatigued 316L stainless steel. In: Proceedings of the 15th European Conference on Fracture, ECF15; Stockholm, Sweden.
- Papadopoulos IV, Davoli P, Gorla C, Filippini M, Bernasconi A. 1997. A comparative study of multiaxial high-cycle fatigue criteria for metals. Int J Fatigue. 19:219–235. doi: 10.1016/S0142-1123(96)00064-3
- Paris PC, Erdogan F. 1963. Critical analysis of crack growth propagation laws. J Basic Eng. 85:528–534. doi: 10.1115/1.3656900
- Pedersen MM. 2016. Multiaxial fatigue assessment of welded joints using the notch stress approach. Int J Fatigue. 83:269–279. doi: 10.1016/j.ijfatigue.2015.10.021
- Peterson RE. 1938. Methods of correlating data from fatigue tests of stress concentration specimens. In: Stephen Timoshenko 60th anniversary volume. New York (NY): The Macmillan Company; p. 179.
- Poutiainen I, Marquis G. 2004. A single-point structural stress assessment procedure for load-carrying fillet welds. In: Proceedings of theIIW document XIII-2013-04, International Institute of Welding.
- Poutiainen I, Marquis G. 2006. A fatigue assessment method based on weld stress. Int J Fatigue. 28:1037–1046. doi: 10.1016/j.ijfatigue.2005.11.007
- Pyttel B, Schwerdt D, Berger C. 2011. Very high cycle fatigue–is there a fatigue limit? Int J Fatigue. 33:49–58. doi: 10.1016/j.ijfatigue.2010.05.009
- Radaj D. 2014. State-of-the-art review on extended stress intensity factor concepts. Fatigue Fract Eng Mater Struct. 37:1–28. doi: 10.1111/ffe.12120
- Radaj D. 2015. State-of-the-art review on the local strain energy density concept and its relation to the J-integral and peak stress method. Fatigue Fract Eng Mater Struct. 38:2–28. doi: 10.1111/ffe.12231
- Radaj D, Lazzarin P, Berto F. 2013. Generalised Neuber concept of fictitious notch rounding. Int J Fatigue. 51:105–115. doi: 10.1016/j.ijfatigue.2013.01.005
- Radaj D, Sonsino CM, Fricke W. 2006. Fatigue assessment of welded joints by local approaches. 2nd ed. Cambridge (UK): Woodhead Publishing Limited. ISBN: 978-1855739482.
- Radaj D, Vormwald M. 2013. Advanced methods of fatigue assessment. 1st ed. Berlin: Springer.
- Ritchie RO, Yu W, Holm DK, Blom AF. 1988. Development of fatigue crack closure with the extension of long and short cracks in aluminium alloy 2124: a comparison of experimental and numerical results. In: Proceedings of the Mechanics of Fatigue Crack Closure, ASTM STP 982. American Society for Testing and Materials (ASTM). p. 300–316. doi: 10.1520/STP27217S
- Rizzo CM. 2011. Application of advanced notch stress approaches to assess fatigue strength of ship structural details: literature review. Hamburg-Harburg: Schriftenreihe Schiffbau. ISBN: 978-38922065 52.
- Rizzo CM, Fricke W. 2013. Fatigue assessment of bulb stiffener joints according to local approaches. Ships Offshore Struct. 8:73–83. doi: 10.1080/17445302.2011.647805
- Rother K, Fricke W. 2016. Effective notch stress approach for welds having low stress concentration. Int J Press Vessel Pip. 147:12–20. doi: 10.1016/j.ijpvp.2016.09.008
- Rozumek D, Macha E. 2009. A survey of failure criteria and parameters in mixed-mode fatigue crack growth. Mater Sci. 45:190–210. doi: 10.1007/s11003-009-9179-2
- Sadananda K, Vasudevan AK. 1998. Short crack growth and internal stresses. Int J Fatigue. 19(supp. 1):s99–s108.
- Sadananda K, Vasudevan AK. 2004. Crack tip driving forces and crack growth representation under fatigue. Int J Fatigue. 26:39–47. doi: 10.1016/S0142-1123(03)00105-1
- Schijve J. 1988. Fatigue crack closure: observations and technical significance. In: Proceedings of the Mechanics of Fatigue Crack Closure, ASTM STP 982, American Society for Testing and Materials. p. 5–34. doi: 10.1520/STP27198S
- Schijve J. 2009. Fatigue of structures and materials. 2nd ed. Berlin: Springer. ISBN: 978-402068089.
- Schijve J. 2012. Fatigue predictions of welded joints and the effective notch stress concept. Int J Fatigue. 45:31–38. doi: 10.1016/j.ijfatigue.2012.06.016
- Sehitoglu H, Gall K, García AM. 1996. Recent advances in fatigue crack growth modelling. Int J Fatigue. 80:165–192.
- Shen W, Yan R, Barltrop N, Liu E, Song L. 2016. A method of determining structural stress for fatigue strength evaluation of welded joints based on notch stress strength theory. Int J Fatigue. 90:87–98. doi: 10.1016/j.ijfatigue.2016.04.014
- Silitonga S, Maljaars J, Soetens F, Snijder HH. 2013. Survey on damage mechanics models for fatigue life prediction. Heron. 58:25–54.
- Smith RN, Watson P, Tupper TH. 1970. A stress-strain parameter for the fatigue of metals. J Mater. 5:767–778.
- Socie DF, Morrow J, Chen W. 1979. A procedure for estimating the total fatigue life of notched and cracked members. Eng Fract Mech. 11:851–859. doi: 10.1016/0013-7944(79)90142-5
- Sonsino CM. 1997. Fatigue behaviour of welded components under complex elasto-plastic multiaxial deformations. Brussels: ECCS. EU-report no: 16024.
- Sonsino CM. 2009. A consideration of allowable equivalent stresses for fatigue design of welded joints according to the notch stress concept with the reference radii rref = 1.00 and 0.05 mm. Weld World. 53:(3–4):R64–R75. doi: 10.1007/BF03266705
- Sonsino CM, Fricke W, de Bruyne F, Hoppe A, Ahmadi A, Zhang G. 2012. Notch stress concepts for the fatigue assessment of welded joints–background and applications. Int J Fatigue. 34:2–16. doi: 10.1016/j.ijfatigue.2010.04.011
- Sonsino CM, Kueppers M. 2001. Multiaxial fatigue of welded joints under constant and variable amplitude loadings. Fatigue Fract Eng Mater Struct. 24:309–327. doi: 10.1046/j.1460-2695.2001.00393.x
- Sonsino CM, Lagoda T. 2004. Assessment of multiaxial fatigue behaviour of welded joints under combined bending and torsion by application of a fictitious notch radius. Int J Fatigue. 26:265–279. doi: 10.1016/S0142-1123(03)00143-9
- Spagnoli A. 2005. Self-similarity and fractals in the Paris range of fatigue crack growth. Mech Mater. 37:519–529. doi: 10.1016/j.mechmat.2004.04.003
- Sumi Y, Inoue T. 2011. Multi-scale modelling of fatigue crack propagation applied to random sequence of clustered loading. Mar Struct. 24:117–131. doi: 10.1016/j.marstruc.2011.02.003
- Susmel L. 2008. The theory of critical distances: a review of its applications in fatigue. Eng Fract Mech. 75:1706–1724. doi: 10.1016/j.engfracmech.2006.12.004
- Susmel L, Lazzarin P. 2002. A bi-parametric Wöhler curve for high cycle multiaxial fatigue assessment. Fatigue Fract Eng Mater Struct. 25:63–78. doi: 10.1046/j.1460-2695.2002.00462.x
- Susmel L, Taylor D. 2007. A novel formulation of the theory of critical distances to estimate lifetime of notched components in the medium-cycle fatigue regime. Fatigure Fract Eng Mater Struct. 30:567–581. doi: 10.1111/j.1460-2695.2007.01122.x
- Taylor D. 2007. The theory of critical distances; a new perspective in fracture mechanics. Oxford: Elsevier. ISBN: 978-0-08-044478-9.
- Teng T, Chang P. 2004. Effect of residual stresses on the fatigue crack initiation life for butt-welded joints. J Mater Process Technol. 145:325–335. doi: 10.1016/j.jmatprotec.2003.07.012
- Todinov MT. 2009. Is Weibull distribution the correct model for predicting probability of failure initiated by non-interacting flaws? Int J Solids Struct. 46:887–901. doi: 10.1016/j.ijsolstr.2008.09.033
- Van Lieshout PL, den Besten JH, Kaminski ML. 2016. Comparative study of multiaxial fatigue methods applied to welded joints in marine structures. Frattura ed Integratà Strutturale. 37:173–192.
- Van Lieshout PL, den Besten JH, Kaminski ML. 2017. Multiaxial fatigue assessment of welded joints in marine structures. International Shipbuilding Progress. doi:10.3233/ISP-170141.
- Verreman Y, Nie B. 1996. Early development of fatigue cracking at manual fillet welds. Fatigue Fract Eng Mater Struct. 19:669–681. doi: 10.1111/j.1460-2695.1996.tb01312.x
- Walker K. 1970. The effects of stress ratio during crack propagation and fatigue for 2024-T3 and 7075-T6 Aluminium. In: Proceedings of the Effects of Environment and Complex Load History on Fatigue Life, ASTM STP 462. American Society for Testing and Materials (ASTM). p. 1–14.
- Wei Z, Dong P. 2011. A rapid path-length searching procedure for multi-axial fatigue cycle counting. Fatigue Fract Eng Mater Struct. 35:556–571. doi: 10.1111/j.1460-2695.2012.01649.x
- Weng L, Zhang J, Kalnaus S, Feng M, Jiang Y. 2013. Corrosion fatigue crack growth of AISI 4340 steel. Int J Fatigue. 48:156–164. doi: 10.1016/j.ijfatigue.2012.10.015
- Wormsen A, Sjödin B, Härkegård G, Fjeldstad A. 2007. Non-local stress approach for fatigue assessment based on weakest-link theory and statistics of extremes. Fatigue Fract Eng Mater Struct. 30:1214–1227. doi: 10.1111/j.1460-2695.2007.01190.x
- Xiao ZG, Yamada K. 2004. A method of determining geometric stress for fatigue strength evaluation of steel welded joints. Int J Fatigue. 26:1277–1293. doi: 10.1016/j.ijfatigue.2004.05.001
- Xing S, Dong P, Threstha A. 2016. Analysis of fatigue failure mode transition in load-carrying fillet-welded connections. Mar Struct. 46:102–126. doi: 10.1016/j.marstruc.2016.01.001
- Xu T, Bea R. 1997. Load shedding of fatigue fracture in ship structures. Mar Struct. 10:49–80. doi: 10.1016/S0951-8339(97)80001-Q
- Zerbst U, Madia M. 2015. Fracture mechanics based assessment of the fatigue strength: approach for the determination of the initial crack size. Fatigue Fract Eng Mater Struct. 38:1066–1075. doi: 10.1111/ffe.12288
- Zhang Y, Maddox SJ. 2009. Fatigue life prediction for toe ground welded joints. Int J Fatigue. 31:1124–1136. doi: 10.1016/j.ijfatigue.2009.01.003