
 ?Mathematical formulae have been encoded as MathML and are displayed in this HTML version using MathJax in order to improve their display. Uncheck the box to turn MathJax off. This feature requires Javascript. Click on a formula to zoom.
ABSTRACT
Collisions frequently occur at sea, leading to serious human injury, and damage to property and the environment. Furthermore, the increasing number of offshore platforms means that collisions between vessels and offshore structures are a frequent type of accident. Platforms are at a greater risk of collisions than ships, because they have no avoidance capability when operating. Recently, the expansion of offshore wind farms in response to new green energy requirements has led to wind-turbine installation vessels (WTIVs) being in common use. WTIVs are similar to fixed jack-up rigs, and they are self-propelled because they must be able to quickly relocate during wind-farm operation. Therefore, it is important to consider the operational characteristics of WTIVs when calculating their collision risks. This study develops a new method for analysing WTIV collision frequency and then compares the proposed method with the existing methods. It also discusses the implications of the methods for ship-WTIV collision-frequency analysis.
| Nomenclature | ||
|
| = | Breadth of the striking vessel |
|
| = | Box length perpendicular to the wind direction |
|
| = | Collision diameter |
|
| = | Drifting distance |
|
| = | Annual workdays for installations |
|
| = | Annual moving days |
|
| = | Impact energy due to collisions |
|
| = | Total collision frequency on target offshore structure |
|
| = | Collision frequency by attendant vessels |
|
| = | Collision frequency by drafting vessels |
|
| = | Collision frequency by passing vessels |
|
| = | Collision frequency of fixed platforms |
|
| = | Collision frequency of mobile platforms |
|
| = | Collision frequency of the WTIV |
|
| = | Frequency of breakdown |
|
| = | Added mass coefficient |
|
| = | Length of the platform |
|
| = | Box length |
|
| = | Mitigation factor by radar |
|
| = | Mitigation factor by minimum collision diameter |
|
| = | Mass of the ship (gross weight) |
|
| = | Annual number of vessels in the shipping lane |
|
| = | Annual number of vessels in the drifting box |
|
| = | Total number of visits of an attendant vessel |
|
| = | Total number of visits of all attendant vessels |
|
| = | Probability of breakdown (recovery failure rate) |
|
| = | Probability of a vessel on a collision course |
|
| = | Probability of drifting towards the platform |
|
| = | Probability of non-effective external assistance |
|
| = | Probability of non-collision avoidance |
|
| = | Probability of vessels in the part of the lane leading to the platform |
|
| = | Probability of the failure of ship-initiated recovery |
|
| = | Probability of the failure of platform-initiated recovery |
|
| = | Probability of a particular wind direction |
|
| = | Probability of passing-plan failure |
|
| = | Probability of watchkeeping failure |
|
| = | Probability of alert failure |
|
| = | Average time spent in the drifting area |
|
| = | Time of breakdown |
|
| = | Collision-impact velocity |
|
| = | Drifting speed |
|
| = | Sailing speed |
|
| = | Width of the platform |
|
| = | Average width of the platform |
|
| = | Average distance between the route and platform |
|
| = | Standard deviation of distance between the route and platform |
1. Introduction
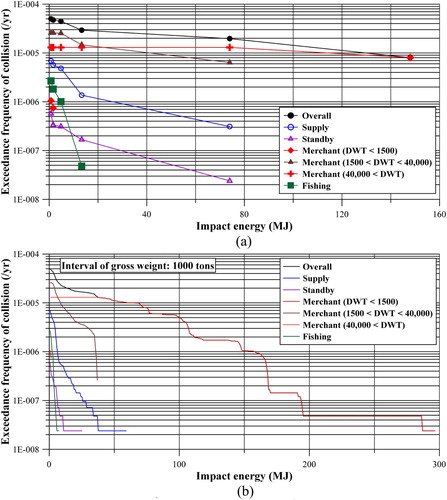
For offshore structures, despite the use of various accident prevention and prediction systems such as radar, passing plans, watchkeeping, collisions with passing, drifting and attendant vessels are still the most common accidents, as shown in (a,b) (Vinnem Citation2007; CEFOR Citation2012). Moreover, these accidents can lead to additional catastrophic events such as hydrocarbon fires and explosions. Therefore, systems that can predict and prevent collisions should be as quantitative and accurate as possible. Whilst both ships can avoid ship-ship collisions by using their propulsion systems, only the striking vessel has avoidance capability in ship-offshore platform collisions.
Figure 1. Examples of collisions with offshore structures (a and b) and a typical WTIV (c). (a) Passing vessel collision by fishing vessel, (b) Attendant vessel collision involving supply vessel, (c) Typical WTIV (Jan De Nul Group: https://www.jandenul.com/).
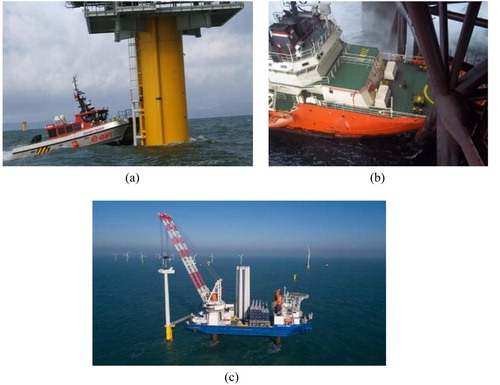
Furthermore, new offshore platforms (within a few years of installation) have a higher risk (a product of frequency and severity of consequences) of collisions than older platforms, because their crews are less well informed about the vessels moving through their locations (Spouge Citation1999). Despite the high collision frequency of offshore structures and the potentially serious consequences of these collisions, most of the research regarding collisions in the ocean has concentrated on ship-ship collisions (Pedersen and Zhang Citation2000a, Citation2000b; Paik and Seo Citation2007; Hong and Amdahl Citation2008; Ehlers et al. Citation2010; Haris and Amdahl Citation2012; Yu and Amdalh Citation2016; Paik et al. Citation2017; Youssef and Paik Citation2018).
Spouge (Citation1999) and Vinnem (Citation2007) summarised the research on managing the frequency and/or severity of consequences of ship-platform collisions, and suggested methods for assessing the frequency and reducing the rate of accidents, including collisions, on offshore platforms. Numerous methods for assessing the frequency and consequences of ship-offshore platform collisions have been developed and modified based on their suggestions. Geijerstam and Sevensson (Citation2008) summarised various risk models and suggested that failures in watchkeeping are an important factor in collisions with passing vessels. Dai et al. (Citation2013) assessed the collision risk between service vessels and a fixed offshore wind-turbine using event tree analysis and finite element analysis (FEA). The American Bureau of Shipping (ABS) (Citation2013) used structural assessment methods to determine the structural consequences of collisions and methods for mitigating risk, but this approach did not calculate collision frequency. Furner and Amdahl (Citation1980) suggested a method for assessing the risk of collisions with drifting vessels that used the Monte Carlo simulation technique to model a shuttle tanker-offshore platform collision. Recently, Park et al. (Citation2020) introduced a preliminary risk assessment of a small-scale floating power-plant. Elsewhere, the frequencies and consequences of collisions with various offshore structures (fixed wind turbine, fish farm, etc.) were investigated (Bela et al. Citation2017; Moulas et al. Citation2017; Mujeeb-Ahmed and Paik Citation2019; Yu et al. Citation2019).
All these methods were developed to assess the frequency and consequences of collisions, and the structural damage to either fixed or continually mobile offshore platforms. However, there is also a need for methods that can incorporate the operational characteristics of new or special-purpose offshore platforms into their risk assessments. For example, wind-turbine installation vessels (WTIVs) are becoming increasingly common due to the expansion of offshore wind farms in response to new green energy requirements. A WTIV is similar to a fixed jack-up rig, but it is also a self-propelled, ship-shaped vessel (see (c)). Therefore, it is important to develop a method that can calculate collision frequencies considering the operational conditions of WTIVs, which have the characteristics of both fixed and mobile platforms. In this study we perform the first collision-frequency analysis of WTIVs, in which we develop a new approach for frequency analysis and compares its performance with those of the existing methods. We then discuss the implications of our method for generation of the collision load-exceedance curves for ship-WTIV collisions.
The collision-risk assessment, which includes estimates of the frequency and consequences of collisions, is conducted for a hypothetical WTIV operating in a wind farm in the North Sea. Real ship traffic data are used in the application of the candidate collision-frequency method. The consequences are calculated using a simple equation for kinetic energy. This study examines passing vessel collisions as well as drifting and attendant vessel collisions, and investigates the factors that influence the risk assessment.
2. Existing approaches to calculating the collision frequency of offshore platforms
There are several methods for calculating the collision risk that passing, drifting and attendant vessels pose to offshore platforms. This study reviews the CRASH and COLLIDE methods for calculating the collision frequency of these types of vessels with offshore platforms (Spouge Citation1999).
2.1. Passing-vessel collision frequency
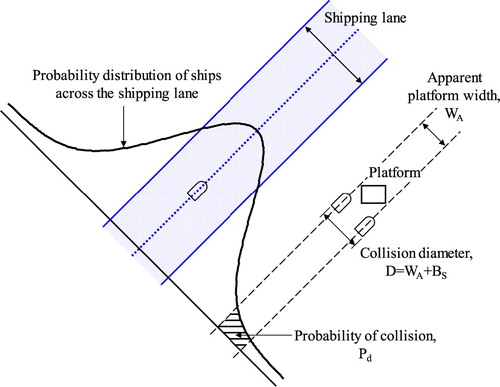
The passing-vessel collision frequency is site/field-specific. A passing merchant vessel may collide with an offshore platform if the vessel follows the wrong course, has engine problems or drifts into the rig. In the CRASH method, the routes, vessel type and vessel size are independently considered, and the collision frequency of specific routes, comprising the risks posed by all of the vessels regardless of size and type, can be calculated using Equation (1).
(1)
(1) where
is the passing-vessel collision frequency;
is the annual number of vessels in a shipping lane;
is the probability that a vessel will be in the part of the lane leading to the platform;
,
and
are the probabilities of a passing-plan failure due to planning failure, watchkeeping failure and alert failure, respectively; and
and
are mitigation by radar and minimum collision diameter, respectively.
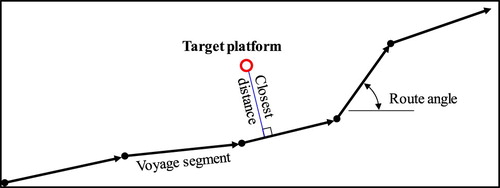
illustrates how the collision probability for a specific route is calculated.
Figure 2. Collision probability for a specific route.
The COLLIDE method consists of more steps than the CRASH method. Whilst CRASH first calculates the collision frequency for the route regardless of ship size, and then distributes the frequency depending on the categorised size, COLLIDE simultaneously considers the collision frequency of the route, type of vessel and vessel size, as expressed in Equation (2).
(2)
(2) where
is the ith route;
is the jth vessel category (supply, standby, merchant (smaller than 1500 or 40,000 DWT (deadweight tonnage), and larger than 40,000 DWT, respectively) and fishing vessels);
is the kth size category;
is the annual number of vessels; and
,
and
are the probability that the vessels are on a collision course, the probability of the failure of ship-initiated recovery and the probability of failure of platform-initiated recovery, respectively. Failure of the passing plan is included in
.
Generally, COLLIDE can more accurately calculate the frequency of passing vessel collisions, because it estimates the frequency of each ship. However, it is difficult and more time-consuming to apply than CRASH, because the required information is not easily obtained (Spouge Citation1999). Therefore, we apply Equation (1) to calculate the collision frequency with passing vessels.
2.2. Drifting-vessel collision frequency
Collisions between drifting vessels and offshore platforms are calculated for passing vessels in the main nearby shipping lanes using the following criteria: (i) the vessel has suffered a breakdown in its propulsion system; (ii) the wind direction causes the vessel to drift towards the facility; (iii) any attempts to tow the vessel away are unsuccessful; and (iv) the crew fails to repair the vessel before it reaches the facility.
The CRASH method uses Equation (3) to calculate the frequency of collisions with these drifting vessels.
(3)
(3) where
is the frequency of collisions with drifting vessels;
is the annual number of vessels in the box, affected by the specific wind direction towards the platform;
is the breakdown probability, which is the recovery failure rate along the drifting lane;
is the probability of a particular wind direction;
is the collision diameter; and
is the box-length perpendicular to the wind direction (see ).
Figure 3. Calculating the frequency of collisions with drifting vessels.
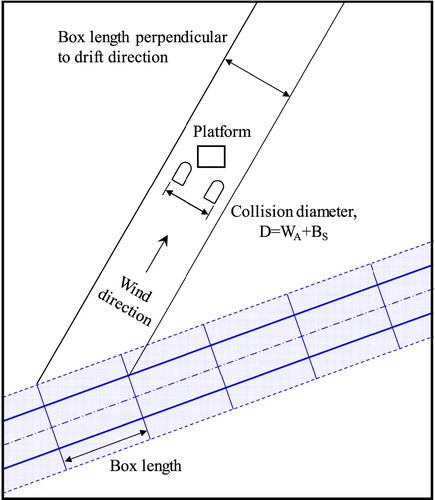
illustrates how the probability of a collision with a drifting vessel is calculated. Whilst the frequency of collisions with passing vessels is based on the latter’s route, the frequency of collisions with drifting vessels depends on the wind direction along the route. The box length is the distance to the platform affected by a wind direction that leads to a collision with a drifting vessel.
Equation (4) is used in the COLLIDE method to calculate the frequency of collisions with drifting vessels.
(4)
(4) where
is the annual number of vessels in a shipping lane;
is the frequency of breakdown;
is the average time spent in the area; and
,
and
are the probability of drifting towards the platform, the probability of non-effective external assistance and the probability of non-collision avoidance by the ship, respectively.
2.3. Attendant-vessel collision frequency
Generally, the frequency of collisions with attendant vessels is calculated from historical global data of collisions with fixed offshore platforms. In the case of WTIVs, this is a conservative assumption, as historical evidence suggests that the collision frequency with floating production-storage and offloading vessels (FPSOs) is an order of magnitude higher than that for fixed offshore platforms. Hence, there is currently no specific method for calculating the frequency of collisions with attendant vessels. To accurately calculate the frequency of such collisions, it is necessary to collect data on historical collisions with attendant vessels for each type of offshore platform. presents the relevant historical data (OGP Citation2010).
Table 1. Field-related vessel- collision statistics (OGP Citation2010).
Given these data, the frequency of collisions with attendant vessels can be calculated using Equation (5). The collision scenarios have proportional frequencies based on the number of visits.
(5)
(5) where
is the collision frequency by an attendant vessel;
is the total collision frequency of the target unit;
is the number of visits of a specific attendant vessel type; and
is the total number of visits of all attendant vessels.
2.4. Consequences of collisions
The consequences of collisions with passing, drifting and attendant vessels can be determined using a nonlinear FEA method, an empirical formula and/or a semi-analytical method incorporating super-sized elements (Buldgen et al. Citation2012, Citation2014), whilst taking into account the design load. In this respect, we apply the impact energy calculated by Equation (6) to define the design accidental load (DAL), which leads to quantification of the collision consequences.
(6)
(6) where
is the impact energy of a collision;
is the hydrodynamic added mass coefficient (1.1 for head-on impacts and 1.4 for broadside impacts);
is the gross weight; and
is the collision velocity.
3. Procedure for assessing the collision frequency of WTIVs, and the consequences of these
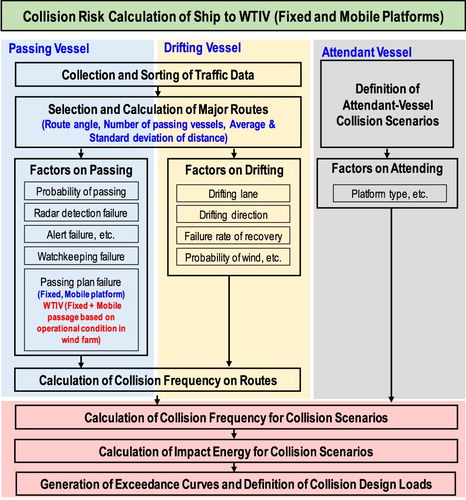
In this study we extend existing methods (Spouge Citation1999) to develop a procedure for calculating the frequency of collisions between passing, drifting and attendant vessels and WTIVs. shows the procedure used in this study for calculating the DAL for the frequency and impact energy of ship-offshore platform collisions.
Figure 4. Procedure for calculating risk of collisions between ships and WTIVs.
WTIVs are specifically designed for the installation of offshore wind turbines. Like jack-up rigs, WTIVs are self-elevating and are able to quickly relocate within a wind farm using a ship-type self-propelled system. Thus, the WTIV is in a fixed condition when it installs wind turbines, but moves around the wind farm to install other turbines.
The existing procedure for calculating collision frequency considers the risk of a collision between a passing vessel and either a fixed or mobile platform. Thus, it does not cover both operational conditions of the WTIV. The method developed in this study and expressed in Equation (7) calculates the passing-vessel collision frequencies for WTIVs considering both the fixed and mobile conditions.
(7)
(7) where
,
and
are the collision frequencies of WTIV, fixed and mobile platforms, respectively;
is the number of workdays for installation; and
is the days taken to move to the next location. This study assumes that an WTIV takes an average of 1 working day for an installation (Uraz Citation2011), 6 hours to move to a new location, and installs 292 wind turbines per year. This means that a WTIV spends 292 days on installation and 73 days moving per year.
3.1. Collision frequency
Whilst historical accident data are used to calculate the attendant-vessel collision frequency, the assessments of both passing- and drifting-vessel collisions use real-site/field-specific traffic data to calculate the accident frequency. Information about major routes, such as ships’ passing routes and the number of vessels using a route, can be obtained from the traffic data using the following steps.
Definition of each ship’s representative route. As ships do not need to travel in a straight line, each ship’s representative route can be defined using the closest two ships’ locations, as shown in .
Categorisation of major routes. Ships are grouped by heading angle. A range of heading angles for each major route is defined (i.e. by variables such as equally distributed angle, probability, etc.).
Calculation of major routes’ information. The average and standard deviation of the distance between ships and platforms in each major route are calculated.
Figure 5. Definition of each ship’s route.
After obtaining the information about each major route, the passing-vessel collision frequency is calculated based on factors such as the probability of encountering the platform, the probability of passing plan failure, the probability of watchkeeping failure, the probability of radar detection failure, the probability of alert failure, etc. The major routes’ information can also be used to calculate the frequency of collisions with drifting vessels using data on drifting lane, drifting direction, recovery failure rate, probability of wind, etc.
Once the total collision frequency in each major route is calculated, the frequency is calculated for each weight category of ship. In this study, 400 groups in each route are selected as collision scenarios, where each group has a different collision frequency. In the case of attendant-vessel collisions, the attending vessels that are expected at the target platform are used in the collision scenarios. The total collision frequency derived from the historical accident data is applied to calculate the collision frequency of each collision scenario, as in Section 2.3.
3.2. Collision impact energy
To calculate the impact energy due to collisions, the collision accident scenarios are categorised according to the weight and speed of the vessels. This can be done using either a computational fluid dynamics (CFD)/FEA procedure or using empirical formulas. In this study, Equation (6) is applied to calculate the impact energy of collisions that lead to consequences.
3.3. Definition of collision design loads
Using the data on collision frequency and impact energies, it is possible to generate a collision exceedance curve and define a design-load based on the acceptance criteria (e.g. 10−4/y for a fire and explosion accident).
As expected, the frequency and energy of collisions are significantly affected by ship weight. Spouge (Citation1999) suggested using 1000, 2200, 6500, 18,000 and 100,000 tonnes as criteria for ship-weight categories. However, although Spouge’s method provides reliable and practical categories, it is not based on real shipping data. We investigate the effect of different weight categories on the design (exceedance) curves and compare the results using applied examples.
4. Applied examples
4.1. Target structure and site
In general, WTIVs do not operate at the same location for long periods of time. They tend to operate for several months while installing wind turbines at a specific wind farm. Whilst a WTIV is installing a wind turbine, it can be treated as a fixed offshore structure. Fixed offshore platforms have a high risk of collision during their first few (approximately five) years in operation. In this sense, WTIVs are always exposed to high collision risk, because they periodically change their operating site as they install new wind turbines.
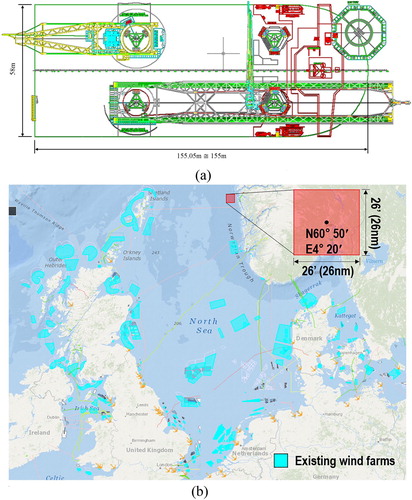
Accordingly, we use a hypothetical prototype WTIV operating in the North Sea (near Bergen, Norway) as an example, as shown in . The location of the target operation site is assumed to be the proposed site of a wind farm at a latitude of 60°50′ and longitude of 4°20′.
Figure 6. Target offshore platform and operating site. (a) Layout of typical WTIV; (b) Target operating site: North Sea (www.4coffshore.com/offshorewind/).
4.2. Marine traffic data and major routes
Assessments of ship-platform collision frequency use the ship traffic data from within a 10 nautical mile (nm, 1 nm = 1′) radius of a platform location as an industrial practice (Spouge Citation1999). Time-dependent marine traffic data on major routes are collected for the assessments.
We use a commercially available data set of 663,197 time-dependent traffic observations for 2387 ships at the target operating site provided by Marine Traffic (www.marinetraffic.com). The data are for January to December 2017, and show that 2086 ships come within 10 nm of the site. shows the number and probability of ships by ship type, which are used to calculate the collision risk.
Table 2. Number of ships and the probability of each ship type being in the area.
The two closest ships, the representative routes and the heading angle are defined. The major routes used by the passing vessel are calculated. and present the major routes defined in this study, which have a 30° route-angle range. These major routes are used to calculate the frequency of passing and drifting collisions.
Figure 7. Major routes in the WTIV location. (a) Major routes, (b) Traffic data of all (2086) vessels.
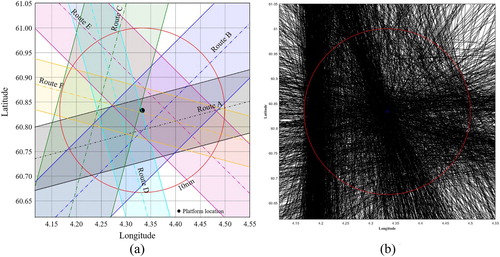
Table 3. Defined major routes.
4.3. DAL calculation for passing vessel collision
4.3.1. Collision frequency
In Equation (1), , which is the number of passing vessels in each route, is obtained as described in Section 4.2. The probability that a ship will encounter the platform in the lane (
) is generally normally distributed, as expressed in Equation (8). The details are described in .
(8)
(8) where
is the collision diameter expressed in Equation (9);
and
are the average and standard deviation of the distance between the route and platform; and
is the location of the platform (which takes the origin) respectively.
(9.1)
(9.1) and
(9.2)
(9.2) where
is the average platform width, on the possible collision side;
is the breadth of the striking ship;
is the length of the platform; and
is the width of the platform.
The dimensions of the WTIV are 155 m by 58 m, as shown in (a). The collision diameter () in this study is 169.6 m (0.0732 nm) and 34 m is the average ship breadth, which covers a wide range of ships.
,
and
, which are factors that affect the passing-vessel collision risk, can be calculated using historical data, event tree analysis, fault tree analysis, etc. In this study, the probabilities summarised by Spouge (Citation1999) are applied, as they should be reliable and influential. shows the values of
,
and
depending on ship type and platform type. Due to their dependence on each other, the product of
and
is generally used in these assessments.
Table 4. Probability of passing plan failure (P1), watchkeeping failure and alert failure (P2·P3).
represents mitigation due to radar performance, as shown in , based on a report by SAFETEC (Citation1997). This study uses the mean value of vessel traffic service (VTC).
is 0.13 (1−0.87) and
is the ratio of normal to minimum collision diameter expressed in Equation (10):
(10)
(10)
Table 5. Probability of averting collision by radar ( ).
).
shows an example that summarises and compares the collision frequencies with passing vessels on fixed, mobile and WTIV platforms (using the developed method) on Route A, conservatively calculated for bad visibility conditions. The frequencies on all routes (A–F) are presented in Tables A.1–A6.
Table 6. Collision frequencies (/yr) of passing vessels on Route A.
summarises the frequency of collisions on all of the routes. It shows that the collision frequencies of passing vessels vary significantly between types of offshore platforms. Platforms such as WTIVs have more collisions with passing vessels than do fixed platforms. Clearly, WTIVs are exposed to a higher risk of collision than fixed platforms.
Table 7. Collision frequencies (/yr) of fixed, mobile and WTIV platforms on all routes.
4.3.2. Collision impact energy
The consequences of collisions are calculated in Equation (6) based on collision velocity and gross weight (not DWT). First, it is necessary to convert DWT to gross weight. If the ship traffic data do not include information about a ship’s gross weight, it can be assumed to be 1.25 times DWT. To investigate the effect of weight distribution, the gross weights are categorised into 1000-tonne intervals. shows the impact energy of each gross weight category.
Table 8. Impact energy of passing vessel collisions based on gross weight and representative speed.
4.3.3. Passing vessel collision exceedance curve
The collision frequency is normalised by considering the ships by ship type and gross weight, as shown in . summarises the finalised passing-vessel collision frequency based on the frequency of collisions with WTIVs given in and the probable number of ships by weight category and type, given in .
Table 9. Ship traffic data by ship type and physical mass (gross weight).
Table 10. Frequency of passing vessel collisions (/yr) with WTIVs by ship type and gross weight.
For the 1000-tonne-interval gross-weight categories used in this study, the finalised passing-vessel collision frequencies are shown in .
The final results of the calculations of collision frequency and impact energy can be used to generate an exceedance frequency of collision, as shown in . The figure illustrates the relationship between the exceedance frequency of collision and the impact energy, and the data can be used to construct design curves. The graph also illustrates the effect of changing the gross-weight categories.
Figure 8. Exceedance frequency of passing vessel collision. (a) With the gross weight categories suggested by Spouge (Citation1999), (b) With the 1000-tonne-interval weight categories.
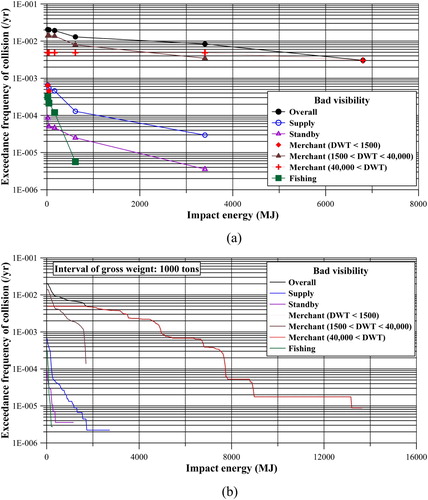
In (a,b), which show an example using 10−2/yr as the acceptance level for overall collisions, the design loads are 2413 MJ when the weight categories suggested by Spouge are used, and 299 MJ when weight intervals of 1000 tonnes are used, respectively. This comparison suggests that Spouge’s categories severely overestimate the design load (by eight times). This shows the importance of selecting suitable weight categories, and demonstrates that the calculations are more accurate and more reliable when a finer interval is used.
4.4. DAL calculation for drifting-vessel collision
4.4.1. Collision frequency
Calculating the drifting-vessel collision frequency is more complicated than calculating the passing- and attendant-vessel collision frequencies because it is necessary to consider the wind direction. However, not all wind directions contribute to collisions: only wind blowing towards the platform increases the frequency of collision with a drifting ship. illustrates an example of wind directions that cause collisions with drifting ships on Route B.
Figure 9. Example of wind directions affecting drifting collisions on Route B.
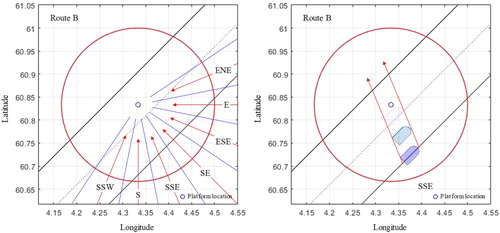
As shown in , each route has several influential wind directions, which affect the collision frequencies. In this study, the wind directions for the shipping lane farthest from the platform (average distance + standard deviation) are investigated to obtain optimistic estimates. Once the wind directions that affect the drifting collisions are defined, the collision frequency of a drifting vessel () can be calculated as in Equation (3). The number of vessels in the box (
) is obtained using Equation (11).
(11)
(11) where
is the annual number of ships on a route;
is the box length; and
is the sailing speed (knots).
The probability of a breakdown () depends on drifting time and is calculated using Equation (12). The probabilities for
are as follows (Spouge Citation1999).
Breakdown lasting 20 min: 1.5 × 10⁻⁴/yr
Breakdown lasting 2 h: 4.0 × 10⁻⁵/yr
Breakdown lasting 2 d: 1.5 × 10⁻⁵/yr
where is the time of breakdown;
is the drifting distance; and
is the drifting speed.
In this study, an average sailing speed of 13.3 knots and a drifting speed of 2 knots are used to calculate and
. presents the wind information (
) for the platform locations in the North Sea.
Table 11. Probability of wind direction and speed for the North Sea (near Bergen, Norway).
The collision frequencies for drifting vessels are calculated using the annual number of vessels in the box (); breakdown probability (
); probability of wind (
); collision diameter (
); and perpendicular box length (
) (see Tables A.7–A12). presents the sub-totals for each route and the total drifting-vessel collision frequency.
Table 12. Frequency (/yr) of collisions by drifting vessels.
4.4.2. Collision impact energy
The impact energies of collisions with drifting vessels are calculated in the same way as those of collisions with passing vessels, except that the drifting speed is assumed to be 2 knots. shows the impact energy by gross weight categories. These results are compared with the results obtained after substituting the weight categories with intervals of 1000 tonnes.
Table 13. Impact energy of drifting vessel collisions by gross weight and speed.
4.4.3. Drifting vessel collision exceedance curve
summarises the final estimates of frequency of drifting collision using the frequencies in and the number of ships (probability) in .
Table 14. Finalised frequency of collisions with drifting vessels (/yr) by ship type and gross weight.
illustrates the exceedance frequency and impact of collision curves, which can be used to construct design curves, and compares the effect of gross weight category and 1000-tonne-interval weight categories. In , the design loads use an example of 10−5/yr as an acceptance level. The overall collision design loads are 135.5 MJ when using the weight categories suggested by Spouge (Citation1999), and 63.8 MJ using the 1000-tonne intervals. This comparison shows that Spouge’s categories overestimate the design load (i.e. the values are twice those calculated using the 1000-tonne intervals).
Figure 10. Exceedance frequency of drifting vessel collision. (a) With the gross weight categories suggested by Spouge (Citation1999), (b) With the 1000-tonne-interval weight categories.
4.5. DAL calculation of attendant vessel collision
4.5.1. Collision frequency
As mentioned in Section 2.3, investigating the expected visiting vessels (visiting scenarios) should be the first step in calculating the frequency of collisions with attendant vessels. This study only considers supply vessel visits, because WTIVs do not need shuttle tankers (oil or gas). shows the expected number of visits from attendant vessels to the target WTIV, and the estimated collision frequency. This study considers WTIVs as both fixed and jack-up units (78 collisions, 135,211 exposures, giving a collision frequency of 5.77 × 10⁻⁴/yr) (see ).
Table 15. Expected number of visiting vessels at target WTIV and attendant collision frequency.
Supply vessels are generally angled perpendicular (head-on) to the platform, whereas merchant ships can be oriented in a perpendicular (bow), horizontal (port or starboard) or diagonal fashion. However, supply vessels can collide with platforms at heading angles between 0° and 90°, so both head-on and non-head-on collisions are considered in this study.
When all possible heading angles are considered, the frequency of each scenario can be divided by the number of heading angles, and then applied to each collision scenario. For example, if Supply vessel_1 has nine heading angles, the collision frequency for each scenario is 4.53 × 10⁻³/yr (4.08 × 10⁻⁴/9/yr), as shown in .
4.5.2. Collision impact energy
The designated speed of ships attending a platform is 2 knots. In addition, the speed of the attendant vessel depends on its heading angle, as shown in .
Figure 11. Major routes in the facility’s location.
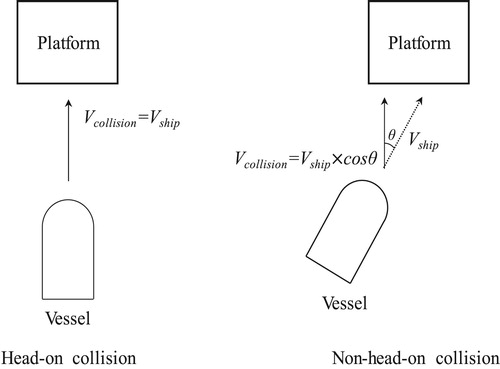
shows the collision impact energy in a head-in collision, and presents the impact energy with Supply vessel_1 from nine angles, as an example. In , added mass coefficients of 1.1 () for angles up to 45° and of 1.4 for angles over 45° are applied to the calculation of impact energy (Spouge Citation1999; Mohamed Citation2012).
Table 16. Impact energy of collisions with an attendant vessel using the traditional approach (only head-on collisions).
Table 17. Example of impact energy for all possible collision angles with an attendant Supply vessel_1.
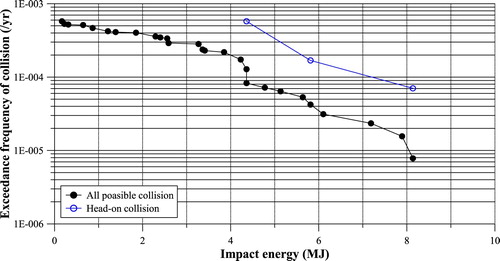
4.5.3. Attendant-vessel collision exceedance curve
shows the exceedance frequency for DAL considering the attendant-vessel in head-on collisions only and for all possible heading angles. The graph shows that considering all possible heading angles makes a large difference to the design load, just as changing the weight intervals affects the assessment of passing- and drifting-vessel collisions.
Figure 12. Major routes in the facility’s location.
4.6. Comparing DAL calculated by existing and present methods
As mentioned above, several approaches and methodologies (Spouge Citation1999; Vinnem Citation2007) are currently used to assess the frequency of ship-platform collisions for offshore platforms. In this study we propose methods for calculating the frequency of collisions between passing, drifting and attendant vessels and WTIVs based on the specific conditions of WTIVs, which have characteristics of both fixed and mobile platforms.
Recently, some researchers (Seo et al. Citation2013; Kim et al. Citation2015; Kim et al. Citation2016; Youssef et al. Citation2016) have used a probabilistic approach to predict accidents involving ships and offshore structures. Therefore, these methods are also compared with our proposed method for estimating collisions with WTIVs. These methods construct a reasonable collision scenario by applying a probabilistic model to each of the constituent variables of all possible incident scenarios. This approach is most widely used to determine the fire and explosion design loads for ship and offshore structures (Czujko Citation2001; Paik et al. Citation2011; Paik and Czujko Citation2012; Kim et al. Citation2017; Seo et al. Citation2017). The procedure is summarised as follows.
Selection of collision variables. As multiple variables are relevant in the selected scenarios, all the variables that could possibly affect collisions must be considered. In this study, the type of vessel, displacement, ship speeds and navigation heading angle (collision angle) are considered.
Data collection. To select scenarios for the probabilistic analysis, traffic data for the target sea area are required. The data used in this study are shown in and .
Probability density function. The variables’ parameters are based on the collected data. Most of the variables are discontinuous functions, and generally must be converted into continuous functions (probability density functions). The best-fit probability density function (normal, logarithmic, Weibull distribution, etc.) is applied to each variable based on the distribution of the original data. shows the original data distribution (adopted in this study) of each variable and the selected probability density function.
Scenario sampling. Credible scenarios are selected based on the probability density function of each variable. In this study, the Latin hyper-cube samplings (LHSs) are chosen, which use a probability density function for each variable (Ye Citation1998), thus generating probabilistic scenarios with different combinations of variables. LHSs can be used to consider every possible value, even those with very low probabilities.
Figure 13. Best fit of selected probability density functions. (a) Ship type, (b) Gross weight, (c) Ship speed, (d) Collision angle.
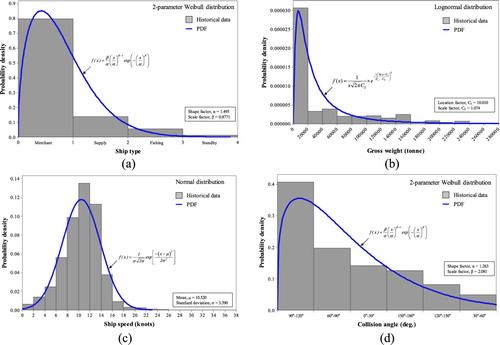
Using this probabilistic approach, 50 collision scenarios are selected representing various ship types, speed, gross tonnage, collision angle, etc.
displays the annual collision frequencies and their corresponding impact energies for passing vessels for each of the candidate methods. In all the cases, the energies quoted are the kinetic energies of the incoming ships.
Figure 14. Comparison of the candidate methods for assessing DAL for passing vessel collisions.
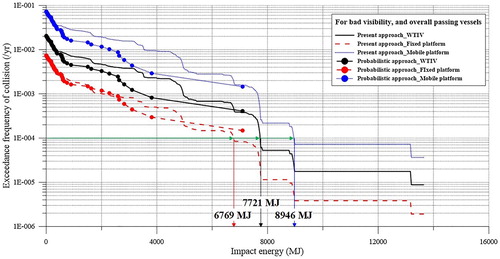
In general, passing vessels present a large collision risk with mobile and fixed platform, according to the current approach. Our proposed method, which considers the specific characteristics of WTIVs, predicts the curve of collision with WTIVs to lie between those estimated for fixed and mobile platforms by the current approach. Therefore, current industry practices either overestimate or underestimate the design collision accidental loads depending on consideration of the offshore type of WTIV.
Both the proposed probabilistic approach and the current approach show similar trends in collision frequency. The exceedance curve for the WTIVs is located between that of fixed and mobile platforms. However, the probabilistic approach slightly underestimates the collisions compared with the current approach for WTIVs, probably due to differences in the probabilistic assumptions and scenario selection sampling techniques.
5. Conclusions
In this study, we: (i) apply the existing method to estimate the collision frequency between ships and WTIVs; (ii) calculate the collision frequency and impact energy to evaluate the DAL for WTIVs in passing-, drifting- and attendant-vessel collisions; and (iii) investigate the effects of several factors on such collisions.
The study’s conclusions are as follows:
WTIVs have characteristics of both fixed and mobile platforms, as they are fixed during the installation of wind turbines, but move between locations. As a result (see ), existing approaches underestimate the DAL, because they consider WTIVs as a fixed platform (e.g. 6770 MJ for a fixed platform versus 7720 MJ for a WTIV with the acceptance criterion of 10−4/yr).
The collision frequencies of the target WTIV in the North Sea are 2.05 × 10⁻²/yr for passing vessel, 4.99 × 10⁻⁵/yr for drifting vessel and 4.53 × 10⁻³/yr for attending vessel collisions. The total collision frequency (
Collisions with offshore platforms are more frequent than other accidents (fire, explosion, etc.). Therefore, particular attention should be paid to designing features that reduce collisions.
Use of existing weight categories does not lead accurate estimates of collision frequency and collision consequences for passing and drifting vessels. Using interval weight categories produces more reliable and practical assessments of collision risk.
In calculations of the risk of collisions with attendant vessels, all possible heading angles must be considered, not only the head-on angle.
Disclosure statement
No potential conflict of interest was reported by the author(s).
ORCID
Sang Jin Kim http://orcid.org/0000-0001-9317-0479
Jung Kwan Seo http://orcid.org/0000-0002-3721-2432
Joo Shin Park http://orcid.org/0000-0001-5335-8151
Correction Statement
This article has been republished with minor changes. These changes do not impact the academic content of the article.
References
- ABS. 2013. Guidance notes on accidental load analysis and design for offshore structures. Texas (USA): American Bureau of Shipping.
- Bela A, Le Sourne H, Buldgen L, Rigo P. 2017. Ship collision analysis on offshore wind turbine monopile foundations. Mar Struct. 51:220–241. doi: 10.1016/j.marstruc.2016.10.009
- Buldgen L, Le Sourne H, Besnard N, Rigo P. 2012. Extension of the super-elements method to the analysis of oblique collision between two ships. Mar Struct. 29:22–57. doi: 10.1016/j.marstruc.2012.08.002
- Buldgen L, Le Sourne H, Pire T. 2014. Extension of the super-elements methods to the analysis of a jacket impacted by a ship. Mar Struct. 38:44–71. doi: 10.1016/j.marstruc.2014.05.002
- CEFOR. 2012. The CEFOR annual report. Oslo (Norway): Nordic Association of Marine Insurers.
- Czujko J. 2001. Design of offshore facilities to resist gas explosion hazard: engineering handbook. Oslo (Norway): CorrOcean ASA.
- Dai L, Ehlers S, Rausand M, Utne IB. 2013. Risk of collision between service vessels and offshore wind turbines. Reliab Eng Syst Safe. 109:18–31. doi: 10.1016/j.ress.2012.07.008
- Ehlers S, Tabri K, Romanoff J, Varsta P. 2010. Numerical and experimental investigation on the collision resistance of the X-core structure. Ships Offsh Struct. 7(1):21–29. doi: 10.1080/17445302.2010.532603
- Furner O, Amdahl J. 1980. Computer simulation study of offshore collisions and analysis of ship-platform impacts. Appl Ocean Res. 2:119–127. doi: 10.1016/0141-1187(80)90004-8
- Geijerstam K, Sevensson H. 2008. Ship collision risk: an identification and evaluation of important factors in collision with offshore installations [master’s thesis]. Lund (Sweden): Lund University.
- Haris S, Amdahl J. 2012. Crushing resistance of a cruciform and its application to ship collision and grounding. Ships Offsh Struct. 7(2):185–195. doi: 10.1080/17445302.2010.536392
- Hong L, Amdahl J. 2008. Plastic mechanism analysis of the resistance of ship longitudinal girders in grounding and collision. Ships Offsh Struct. 3(3):159–171. doi: 10.1080/17445300802263849
- Kim SJ, Lee J, Paik JK, Seo JK, Shin WH, Park JS. 2016. A study on fire design accidental loads for aluminum safety helidecks. Int J Nav Arch Ocean Eng. 8:519–529. doi: 10.1016/j.ijnaoe.2016.09.008
- Kim SJ, Sohn JM, Paik JK. 2017. An advanced procedure for the quantitative risk assessment of offshore installations in explosions. International J Mar Eng. 159(A2):123–138.
- Kim YS, Youssef S, Ince S, Kim SJ, Seo JK, Kim BJ, Ha YC, Paik JK. 2015. Environmental consequences associated with collisions involving double hull oil tanker. Ships Offsh Struct. 10(5):479–487.
- Mohamed A. 2012. Offshore structures: design, construction and maintenance. Amsterdam (Netherlands): Elsevier.
- Moulas D, Shafiee M, Mehmanparast A. 2017. Damage analysis of ship collisions with offshore wind turbine foundations. Ocean Eng. 143:149–162. doi: 10.1016/j.oceaneng.2017.04.050
- Mujeeb-Ahmed MP, Paik JK. 2019. A probabilistic approach to determine design loads for collision between an offshore supply vessel and offshore installations. Ocean Eng. 173:285–374. doi: 10.1016/j.oceaneng.2018.12.059
- OGP, 2010. Ship/installation collision. London (UK): OGP Risk Assessment Data Directory, International Association of Oil & Gas Producers. Report No. 434-16.
- Paik JK, Czujko J. 2012. Engineering and design disciplines associated with hydrocarbon and fire risks in offshore oil and gas facilities. Trans Soc Nav Arch Mar Eng. 120:1–39.
- Paik JK, Czujko J, Kim BJ, Seo JK, Ha YC, Janiszewski P, Musail B, 2011. Quantitative assessment of hydrocarbon explosion and fire risks in offshore installations, Mar Struct, 24(2): 73–96.
- Paik JK, Kim SJ, Ko YG, Youssef SAM. 2017. Collision risk assessment of a VLCC class tanker. The Society of Naval Architects and Marine Engineers Maritime Convention (SMC 2017), Oct 23–28; Texas (USA).
- Paik JK, Seo JK. 2007. A method for progressive structural crashworthiness analysis under collision and grounding. Thin-Walled Struct. 45(1):15–23. doi: 10.1016/j.tws.2007.01.012
- Park SI, Kim SK, Kim SJ, Paik JK. 2020. A preliminary risk assessment on the development of a small-scaled floating power plant. J Offshore Mech Arct Eng. 142:011608. (9 pages). doi: 10.1115/1.4044726
- Pedersen TP, Zhang S. 2000a. Absorbed energy in ship collisions and groundings revising Minorsky’s empirical method. J Ship Res. 44(2):140–154.
- Pedersen TP, Zhang S. 2000b. Effect of ship structure and size on grounding and collision damage distributions. Ocean Eng. 27(11):1161–1179. doi: 10.1016/S0029-8018(99)00043-8
- SAFETEC. 1997. The effectiveness of collision control and avoidance systems. Trondheim (Norway): SAFETEC. Report No. DST-96-CR-052-02.
- Seo JK, Kim DC, Ha YC, Kim BJ, Paik JK. 2013. A methodology for determining efficient gas detector locations on offshore installations. Ships Offsh Struct. 8(5):524–535. doi: 10.1080/17445302.2012.713219
- Seo JK, Lee SE, Park JS. 2017. A method for determining fire accidental loads and its application to thermal response analysis for optimal design of offshore thin-walled structures. Fire Saf J. 92:107–121. doi: 10.1016/j.firesaf.2017.05.022
- Spouge JR. 1999. A guide to quantitative risk assessment for offshore installations. Oslo, Norway: DNV Technica, Det Norske Veritas.
- Uraz E. 2011. Offshore wind turbine transportation and installation analyses: planning optimal marine operations for offshore wind project [master’s thesis]. Sweden: Department of Wind Energy, Gotland University.
- Vinnem JE. 2007. Offshore risk assessment – principles, modelling and application of QRA studies. Stavanger (Norway): Springer.
- Ye KQ. 1998. Orthogonal column Latin hypercubes and their application in computer experiments. J Am Stat Assoc. 93(444):121–128. doi: 10.1080/01621459.1998.10473803
- Youssef SAM, Faisal M, Seo JK, Kim BJ, Ha YC, Kim DK, Paik JK, Cheng F, Kim MS. 2016. Assessing the risk of ship hull collapse due to collision. Ships Offsh Struct. 11(4):335–350. doi: 10.1080/17445302.2014.993110
- Youssef SAM, Paik JK. 2018. Hazard identification and scenario selection of ship grounding accidents. Ocean Eng. 153:242–255. doi: 10.1016/j.oceaneng.2018.01.110
- Yu Z, Amdahl J. 2016. Full six degrees of freedom coupled dynamic simulation of ship collision and grounding accidents. Mar Struct. 47:1–22. doi: 10.1016/j.marstruc.2016.03.001
- Yu Z, Amdahl J, Kristiansen D, Bore PT. 2019. Numerical analysis of local and global responses of an offshore fish farm subjected to ship impact. Ocean Eng. 194:106653. (17 pages). doi: 10.1016/j.oceaneng.2019.106653
Appendix