
 ?Mathematical formulae have been encoded as MathML and are displayed in this HTML version using MathJax in order to improve their display. Uncheck the box to turn MathJax off. This feature requires Javascript. Click on a formula to zoom.
ABSTRACT
This study investigated the effects of pneumatic fenders on the prevention of structural damage from collisions between a ship-shaped offshore installation and a shuttle tanker during side-by-side offloading operations. A nonlinear finite element modelling technique was developed to simulate the kinetic energy absorption behaviour of pneumatic fenders during collisions. Full-scale pneumatic fenders were physically tested to validate the computational model at various collision speeds. The developed pneumatic fender model was integrated with a conventional finite element model of a hull structure to simulate the crashworthiness of the hull structure in collisions with a shuttle tanker during side-by-side offloading. This integrated computational model was then applied to examine case studies involving a VLCC class ship-shaped offshore installation hull with and without pneumatic rubber fenders colliding with a Suezmax class shuttle tanker. The key findings and insights of these investigations, particularly the collision energy absorption characteristics are summarised.
1. Introduction
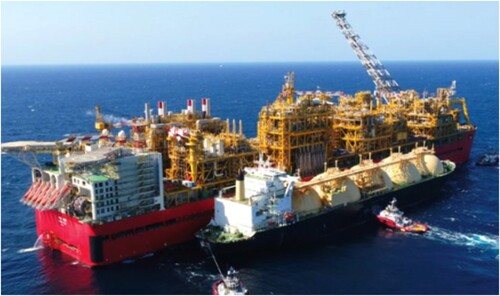
Ship-shaped offshore installations are widely used in the production, processing and storage of energy (e.g. oil and natural gas) extracted from marine environments (Paik Citation2020, Citation2022). A shuttle tanker may collide with such a ship-shaped offshore installation when working in the side-by-side configuration (Zhang et al. Citation2016; Xu et al. Citation2019; Paik Citation2020, Citation2022) ().
Figure 1. A ship-shaped offshore installation and a shuttle tanker working side-by-side.
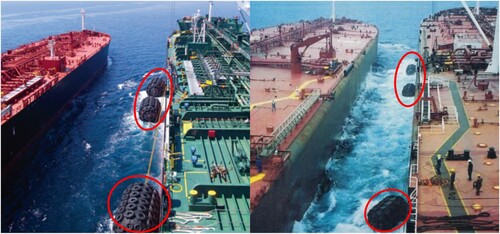
In the side-by-side working configuration, collision damage is typically minor and limited to local denting (Ozguc Citation2017). However, any major damage must be repaired immediately, which may force the offshore installation to be shut down for a prolonged period (Paik Citation2020, Citation2022). Structural damage due to such collisions can be prevented by implementing safety measures, such as installing fenders () that absorb and dampen the impact energy (PIANC Citation2002; Paik Citation2022).
Figure 2. Pneumatic rubber fenders (red ellipses) for absorbing and dampening the impact energy during side-by-side collisions between a ship-shaped offshore installation and a shuttle tanker.
The present study investigated the effect of pneumatic rubber fenders on structural damage during collisions between a ship-shaped offshore installation and a shuttle tanker working side-by-side. Few such studies have been reported (Sakakibara et al. Citation2010; Kubiczek et al. Citation2016; Paik Citation2022), despite their importance in determining the optimal size, number, and layout of fenders that maximises the collision energy absorption capacity while minimising the cost.
In the present study, a finite element model was developed to simulate the collision energy absorption behaviour of pneumatic rubber fenders composed of an outer rubber layer, a tyre cord layer, and an inner rubber layer, with air inside. The developed computational model of pneumatic rubber fenders was integrated with a conventional computational model of the hull structure and implemented into LS-DYNA (Citation2021) to simulate structural crashworthiness in side-by-side collisions between a ship-shaped offshore installation and a shuttle tanker.
2. Crushing testing of pneumatic rubber fender
No studies have reported the physical testing data of pneumatic rubber fenders under either dynamic crushing conditions. Therefore, this study conducted the crushing testing of a full-scale pneumatic rubber fender using a 500-kN dynamic loading actuator at four loading speeds (). The test was conducted with varying collision speed to investigate the effect of collision momentum. The same pneumatic rubber fender was used in all four test sessions, so a rest time of at least 10 min was maintained between the sessions to ensure its adequate recovery. As rubber is a temperature-sensitive material, the testing was conducted at room temperature (23°C ± 5°C).
Table 1. Pneumatic rubber fender crushing test conditions.
2.1 Geometric and material properties of the pneumatic rubber fender
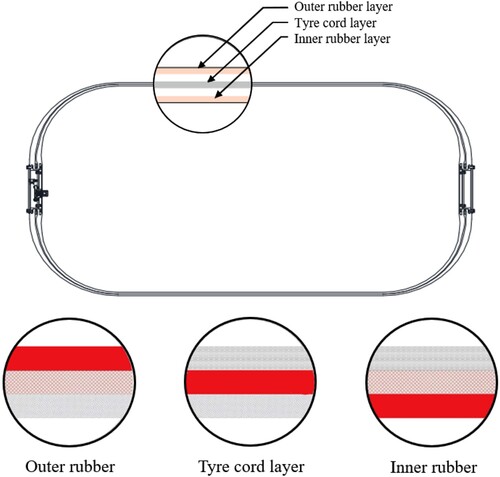
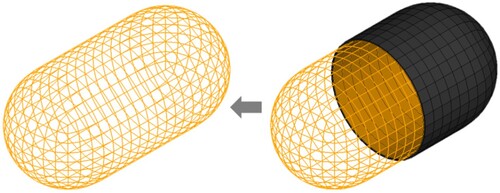
The pneumatic rubber fender is a cylindrical airbag composed of three layers: the outer rubber layer, the tyre cord layer, and the inner rubber layer (). The outer rubber layer, designed to tolerate extreme environmental conditions, protects the two inner layers from abrasion and other external forces, whereas the inner rubber layer seals compressed air inside the fender. The middle layer, made of synthetic tyre cord fabric, serves as a reinforcing layer that maintains the pressure of the compressed air and is akin to an airbag. The number of tyre cord layer varies depending on the size of the pneumatic rubber fender.
Figure 3. Structure of a pneumatic rubber fender.
illustrates the structure of the pneumatic rubber fender used in this study, which weighed 35 kg and had a diameter of 500 mm and a length of 1000 mm. The middle layer was made of 2-ply tyre cord (). The fender was filled with air at a pressure of 50 kPa.
Figure 4. Full-scale pneumatic rubber fender used for the crushing test in this study.
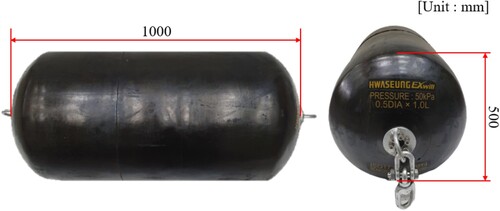
Figure 5. Synthetic tyre cord fabrics forming the middle layer that reinforces the pneumatic rubber fender.

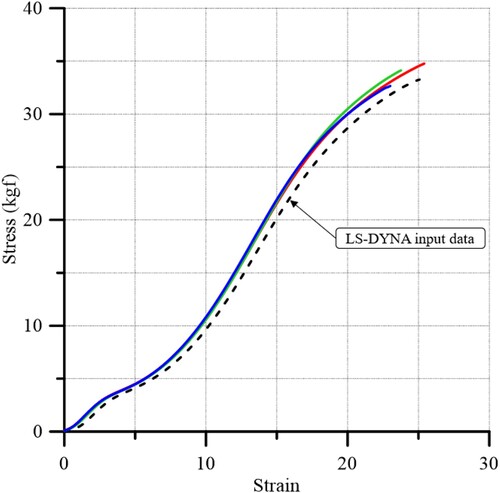
shows the tensile stress–tensile strain curves of the tyre cord as obtained from tensile load testing using a universal testing machine (Instron 5565, Boston, US) following the ASTM D885 standard (ASTM Citation2014). Four tensile tests were conducted, and the curve with the lowest tensile stress was used as the input in finite element modelling to ensure a conservative design. Floating pneumatic rubber fenders for industrial applications must conform to the material, performance, testing, and inspection standards set in ISO 17357-1: 2014.
Figure 6. Stress–strain relationship of tyre cords as obtained through tensile testing.
2.2 Test set-up
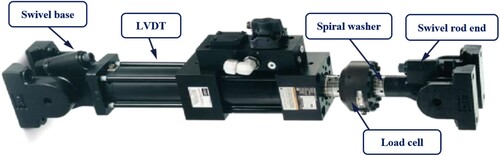
and show the test set-up at the test site of the Korea Ship and Offshore Research Institute (Lloyd’s Register Foundation Research Centre of Excellence) in Hadong, South Korea (www.icass.center) for the crushing testing of the pneumatic rubber fender. A 500-kN dynamic load was applied using a dynamic loading actuator with a maximum speed of 200 mm/s and a maximum stroke of 500 mm () fixed to a reaction force wall and positioned horizontally on the test floor. A plated structure was attached to the tip of the loading actuator as a jig to create a flat plate surface to ensure uniform contact with the tested fender. The jig was supported by a 6-inch wheel, which enabled free movement under the crushing load. In the test, the loading actuator was managed using a displacement control method until the target deformation of 250 mm was achieved. The load and stroke signals were measured using a 500-kN load cell and a linear variable displacement transducer.
Figure 7. Schematic of the crushing test set-up for the pneumatic rubber fender: (a) elevation view, and (b) plan view
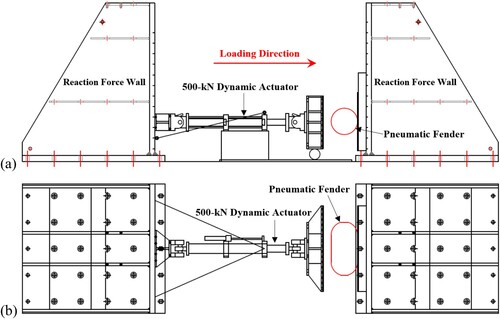
Figure 8. Photograph of the pneumatic rubber fender crushing test equipment.
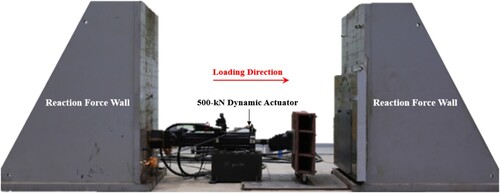
Figure 9. A 500-kN dynamic loading actuator.
3. Computational modelling of the pneumatic rubber fender
The most important characteristic of elastomers, such as rubber, is their ability to undergo large yet reversible elastic deformation (Kubiczek et al. Citation2016). Rubber is a hyper-elastic and visco-elastic material that can withstand very large elastic deformation without undergoing plastic deformation. In addition, except under certain extreme conditions, rubber exhibits a substantial level of incompressibility (Ogden Citation1972). These characteristics must be adequately captured in the computational modelling of rubber materials.
shows the finite element model of the pneumatic rubber fender developed using four-noded shell elements in the LS-DYNA nonlinear finite element analysis software package, based on the fender used for the physical testing, and lists the modelling data. The material properties of the inner and outer rubber layers () and the tyre cord were defined using the Mat 077 Ogden rubber and MAT_034_Fabric material models, respectively. The stress–strain data of the outer and inner rubber layers were manually and consecutively input using the DEFINE_CURVE function in LS-DYNA. In addition, to reduce the crushing aspect (i.e. to ensure incompressibility), rubber can be simulated as an isotropic material.
Figure 10. Finite element model of the pneumatic rubber fender developed using four-noded finite elements.
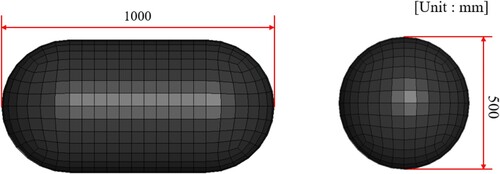
Table 2. Pneumatic fender modelling data input into LS-DYNA.
Table 3. Material properties of the rubber model.
The pneumatic rubber fender used in the physical test had a diameter of 500 mm, a length of 1000 mm, and was composed of four layers: an outer rubber layer, the 2-ply tyre cord layers, and an inner rubber layer. In the finite element modelling, each layer was defined using the Part Composite function in LS-DYNA. The reaction wall and compressive plated structure jig were modelled as rigid bodies using the Mat_020_RIGID material model in LS-DYNA. Because this rigid wall and jig come in contact with the tested fender during crushing, the contact conditions were also modelled as shown in .
Table 4. Definitions of the contact conditions.
Various methods are available to model the internal air pressure in the pneumatic rubber fender. In this work, an internal air pressure of 50 kPa was defined as a control volume airbag using the AIRBAG_SIMPLE_PRESSURE_VOLUME Card in LS-DYNA by specifying SEGMENT (). The advantage of such a control volume airbag is that the pressure changes with the volume.
Figure 11. LS-DYNA modelling of the internal pressure in the pneumatic rubber fender.
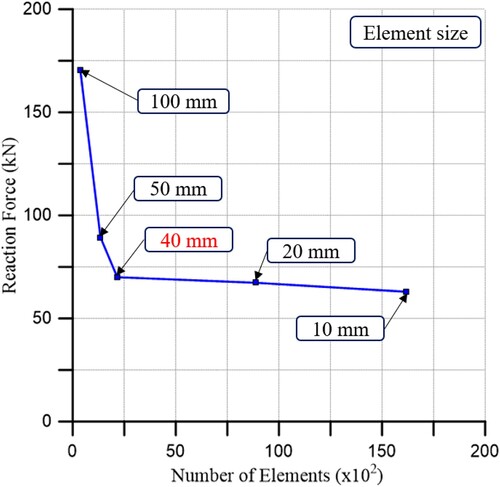
depicts the overall finite element model of the entire test set-up. To determine the optimum size of the finite elements, a convergence study was performed with element sizes of 10, 20, 40, 50, and 100 mm at a single loading speed of 200 mm/s; the results () indicated that 40 mm was the optimum element size.
Figure 12. Finite element model of the entire test set-up.
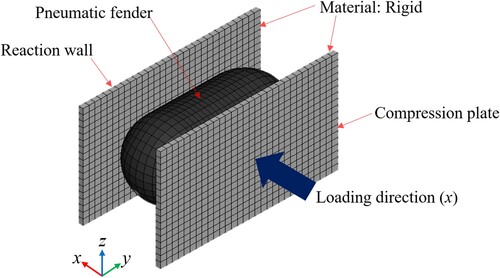
Figure 13. Result of the convergence study to determine the optimum mesh size.
4. Validation of the proposed pneumatic rubber fender model
compares the shapes of the crushed fender as seen in the physical test and the finite element method (FEM) model simulation, where the FEM model was implemented into LS-DYNA code. and show the reaction force–penetration relationship and the absorbed energy–penetration relationship, respectively, measured in the physical tests conducted at different loading speeds, and and show the corresponding relationships obtained using the proposed model. compare the reaction force–penetration relationships and the absorbed energy–penetration relationships obtained in the physical test and the model simulation. summarises the differences in the energy absorption capacity of the fender as measured in the physical test and the model simulation. The model tended to underestimate (overestimate) the energy absorption capacity of the pneumatic rubber fender at relatively low (high) loading speeds. Nevertheless, the measured and simulated energy absorption capacities differed by at most 10%, demonstrating the practical validity of the proposed computational model in simulating the crushing behaviour of pneumatic rubber fenders.
Figure 14. Crushing shapes in the (a) physical test and (b) proposed model.
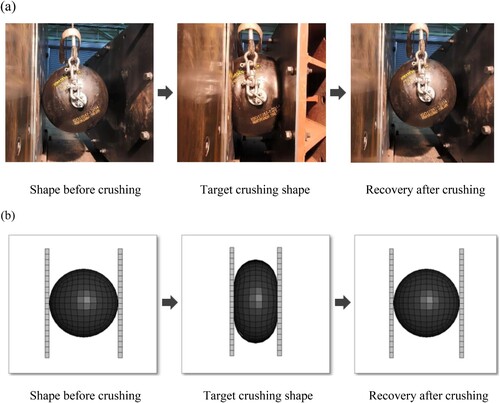
Figure 15. Reaction force–penetration relationship measured in the physical tests.
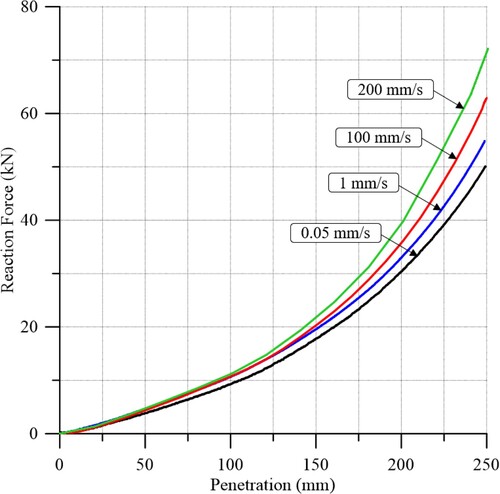
Figure 16. Absorbed energy–penetration relationship measured in the physical tests.
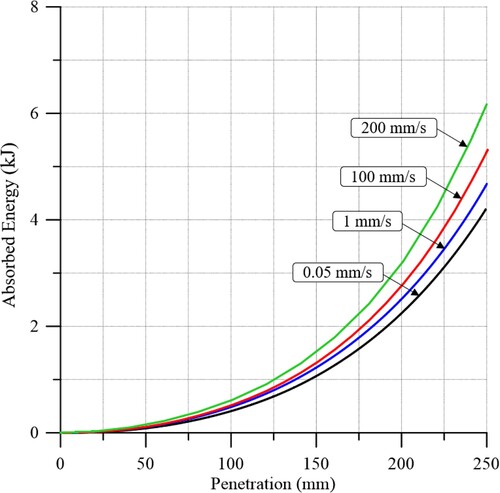
Figure 17. Reaction force–penetration relationship simulated by the proposed model.
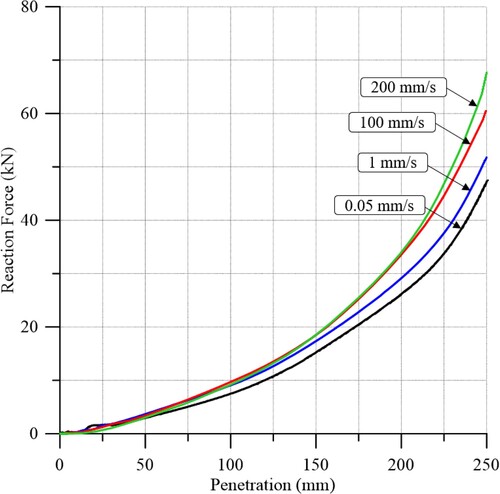
Figure 18. Absorbed energy–penetration relationship simulated by the proposed model.
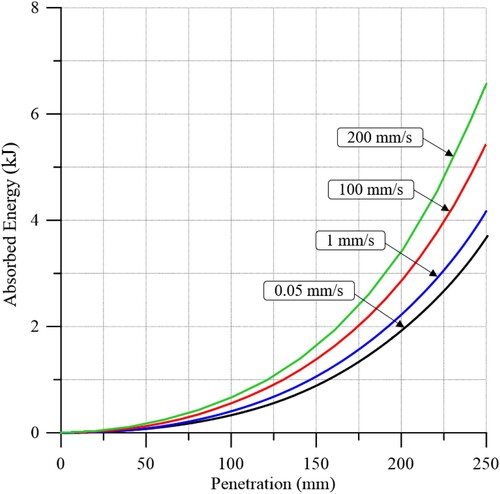
Figure 19. Experimentally measured and numerically modelled absorbed energy–penetration relationships at a loading speed of 0.05 mm/s.
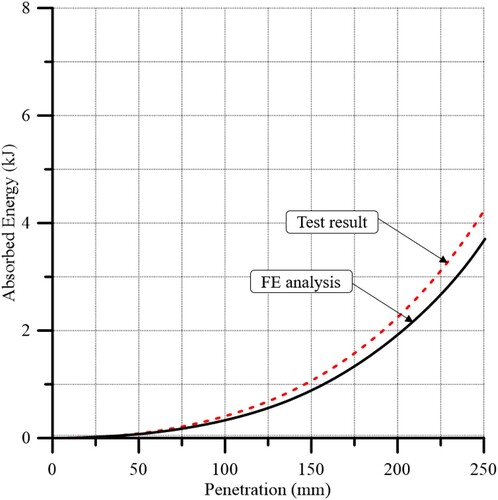
Figure 20. Experimentally measured and numerically modelled absorbed energy–penetration relationships at a loading speed of 1 mm/s.
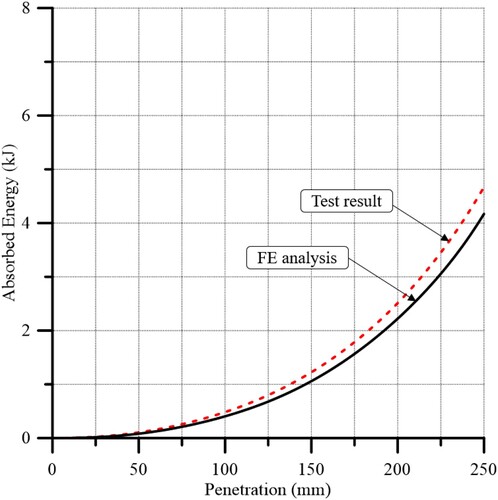
Figure 21. Experimentally measured and numerically modelled absorbed energy–penetration relationships at a loading speed of 100 mm/s.
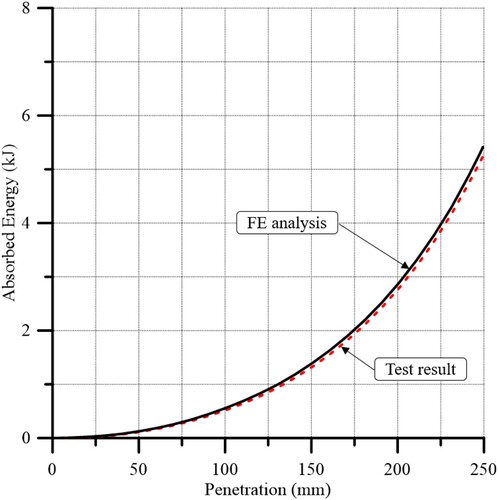
Figure 22. Experimentally measured and numerically modelled absorbed energy–penetration relationships at a loading speed of 200 mm/s.
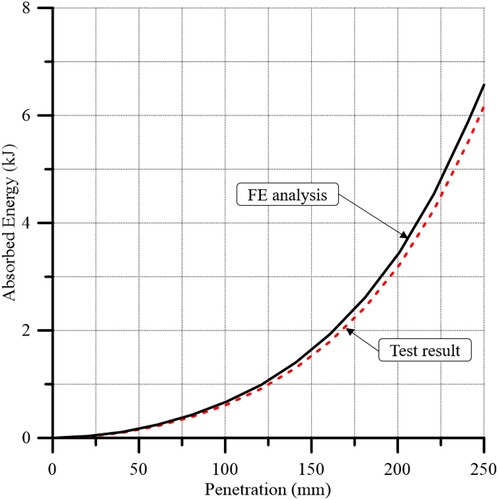
Table 5. Experimentally measured and numerically modelled absorption energy capacities of the pneumatic fender.
5. Case studies: side-by-side collisions between an FPSO unit and a shuttle tanker
5.1 Outline of case studies
The developed computational model of the pneumatic rubber fender was integrated with a conventional computational model for analysing structural crashworthiness in collisions. This integrated model was then applied to a side-by-side collision scenario involving a Suezmax class shuttle tanker and a VLCC class floating production, storage, and offloading (FPSO) unit hull equipped with pneumatic rubber fenders (). presents the principal dimensions of the FPSO and the shuttle tanker. According to the guidelines of PIANC (Citation2002), the required size and number of pneumatic rubber fenders depend on the size of the striking ship (). Middle layers of pneumatic fender with the size of 4.5 × 9.0 m consist of 8-ply tyre cord. Thus, three case studies were examined, with and without fenders, as indicated in (). Figure 24 presents a procedure for determining the recommended size and number of pneumatic rubber fenders.
Figure 23. Side-by-side collision between an FPSO unit hull and a shuttle tanker.
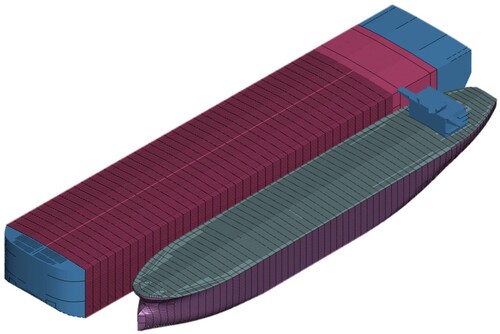
Figure 24. Procedure for determining the recommended size and number of pneumatic rubber fenders.
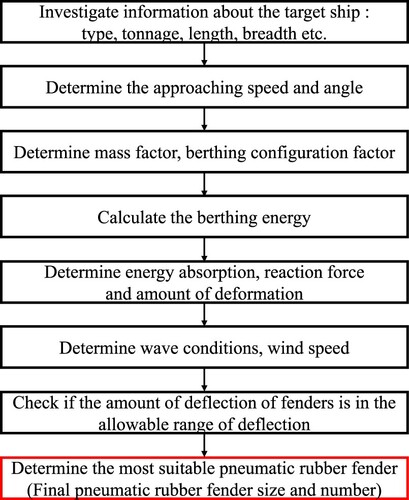
Table 6. Principal dimensions of the VLCC class FPSO and the Suezmax class shuttle tanker.
Table 7. Recommended number and size of pneumatic rubber fenders depending on the size of the tonnage (PIANC Citation2002).
Table 8. Examined case studies and the corresponding collision conditions.
5.2 Combined structural modelling of striking and struck hulls and pneumatic rubber fenders
Conventional finite element models were used to analyse the structural crashworthiness of the striking and struck hulls (made of ordinary or AH32 high-tensile steels), with only plate–shell elements used to model the plating and support members of the hull structures. Rather than by a convergence study, the necessary mesh size of the plate–shell elements was determined using a simplified method developed by Paik (Citation2018, Citation2020, Citation2022) to be 220 mm in the collision areas and 880 mm (i.e. coarse meshes) elsewhere. Similarly, the pneumatic rubber fender was also modelled using a mesh size of 220 mm (). Accordingly, the total numbers of meshes for the FPSO hull, the shuttle tanker, and the rubber fender (i.e. the entire structural system) are summarised in .
Table 9. Mesh sizes for the structural crashworthiness analysis of a side-by-side collision.
Table 10. The number of elements for the structural crashworthiness analysis of a side-by-side collision.
shows the mechanical properties of the steels used to model the hull structures. The Cowper–Symonds equation was used to model the effects of strain rate on the mechanical properties of the materials (Cowper and Symonds Citation1957; Jones Citation2012; Paik Citation2018, Citation2020, Citation2022). The dynamic yield stress is defined as follows:
(1)
(1) where
and
are the static and dynamic yield stresses, respectively,
is the strain rate, and C and q are the Cowper–Symonds coefficients (see ).
Table 11. Material properties for modelling the hull structures of the FPSO and the shuttle tanker.
The strain rates of the individual finite elements can be computed while computing the collision. However, they can also be estimated as a function of the collision speed (Ko et al. Citation2018b; Paik Citation2020, Citation2022), as follows:
(2)
(2) where
is the speed (m/s) of the shuttle tanker at collision.
The material dynamic fracture strain can be defined as follows (Ko et al. Citation2018b; Paik Citation2020, Citation2022):
(3)
(3) where
and
are the static and dynamic fracture strains used in the nonlinear finite-element computations, respectively,
is the strain rate, and C and q are the Cowper– Symonds coefficients (see ).
can be defined based on the material properties and plate thickness of involving structures, as follows (Paik Citation2018, Citation2020, Citation2022):
(4)
(4) where
is the fracture strain,
is the plate thickness, and
is the mesh size. In this study, the plate thickness of the striking and struck hull structures was 17 and 20 mm, respectively. Moreover, the mesh size was
= 220 mm, and the constants in EquationEquation (4)
(4)
(4) were
,
= 4.1, and
= 0.58.
shows the resulting properties of the steels used in the structural crashworthiness analysis. shows an illustrative finite element model of the entire system, with five pneumatic rubber fenders, in a side-by-side collision scenario. The fenders were installed at equal intervals at the water surface level assuming full load. The interaction effects between the striking and struck hull structures, both of which were assumed to be deformable, were also accounted for (Ko et al. Citation2018a; Paik Citation2020, Citation2022).
Figure 25. Finite element model of the FPSO hull equipped with five pneumatic rubber fenders and the shuttle tanker involved in a side-by-side collision.
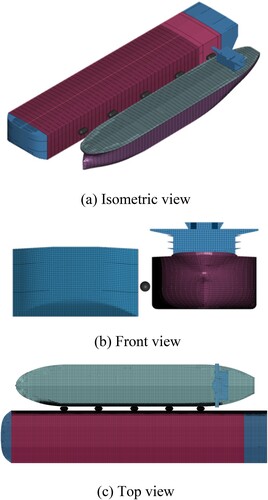
Table 12. Dynamic properties of steel for the analysis of structural crashworthiness during a side-by-side collision.
5.3 Results and discussion
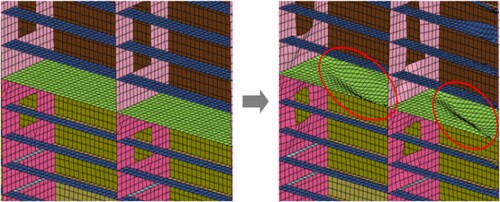
and show the modelled collision damage on the struck FPSO hull structure not equipped with any pneumatic rubber fenders. No major collision damage (no visible damage) on the FPSO hull structures was observed in the case studies where the FPSO hull was equipped with four or five pneumatic rubber fenders.
Figure 26. Structural damage on the FPSO hull with no pneumatic runner fenders at a 2-knot side-by-side collision between a Suezmax class shuttle tanker and an FPSO: (a) side view, (b) cross-sectional view.
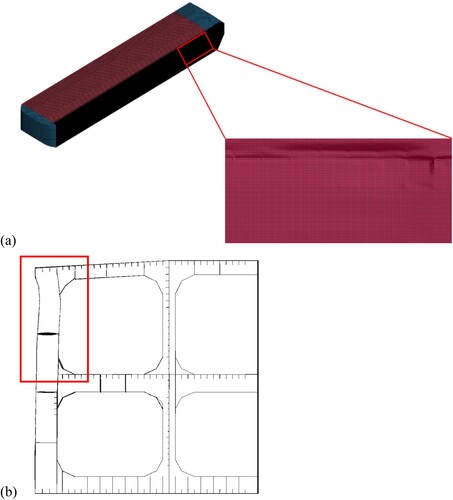
Figure 27. Collision-induced buckling of horizontal girders on the struck FPSO hull with no pneumatic rubber fenders.
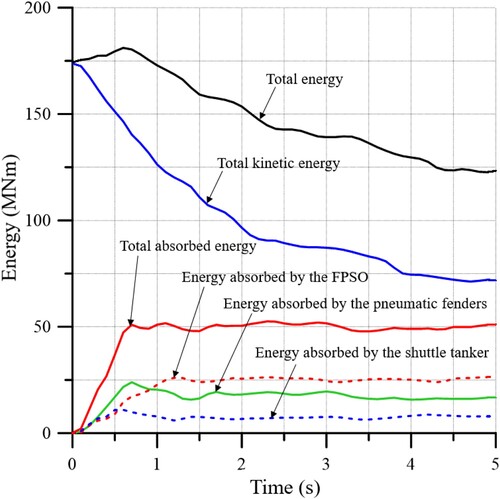
depict the changes in the absorbed energy components over time for the shuttle tanker hull and the FPSO hull without, with four, and with five pneumatic rubber fenders, respectively, at a side-by-side collision speed of 2 kt. In the absence of pneumatic rubber fenders, the striking shuttle tanker accounts for 19.7% of the energy absorption, and the FPSO hull accounts for the remaining 80.3%, leading to severe damage on the FPSO hull ( and ).
Figure 28. Change in absorbed energy components over time for the FPSO and shuttle tanker hulls with no pneumatic rubber fenders in a 2-knot side-by-side collision scenario.
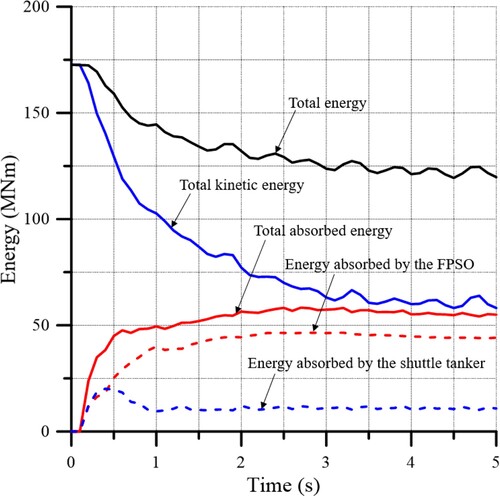
Figure 29. Change in absorbed energy components over time for the FPSO hull (equipped with 4 fenders) and the shuttle tanker hull in a 2-knot side-by-side collision scenario.
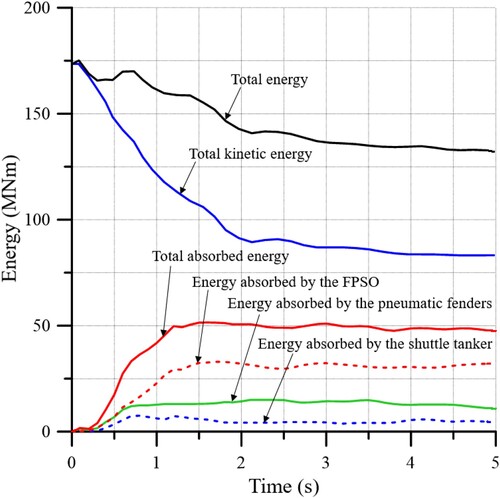
Figure 30. Change in absorbed energy components over time for the FPSO hull (equipped with 5 fenders) and the shuttle tanker hull in a 2-knot side-by-side collision scenario.
In the case study in which the FPSO hull was equipped with four fenders, the striking shuttle tanker hull absorbed 9.8% of the total collision energy (9.9 percentage points lower than that in the case with no fenders), while the struck FPSO hull absorbed 65.1% (15.2 percentage points lower than in the case with no fenders), as the four fenders absorbed 24.9%.
In the case study in which the FPSO hull was equipped with five fenders, the striking shuttle tanker hull absorbed 15.4% of the total collision energy (5.6 percentage points higher than in the case with four fenders), while the struck FPSO hull absorbed 51.9% (13.2 and 28.4 percentage points lower than in the cases with four and zero fenders, respectively), meaning that the five fenders absorbed 32.6%. Thus, in this case, no major collision damage occurred on either the striking or struck hull structures.
6. Concluding remarks
The objective of this study was to develop computational modelling techniques to simulate the structural crashworthiness of a ship-shaped offshore installation hull equipped with pneumatic rubber fenders colliding with a shuttle tanker in a side-by-side working configuration. A computational model of the pneumatic rubber fender was developed and validated against data obtained through physical tests. A conventional finite element method was applied to model the striking and struck hull structures for the structural crashworthiness analysis of ship–ship collisions. The following conclusions can be drawn from this study.
The computational model developed to simulate the collision energy absorption behaviour of pneumatic rubber fenders was validated for practical use.
The developed pneumatic rubber fender model was integrated with a conventional computational model for the structural crashworthiness analysis of ship–ship collisions. This integrated model was also validated for practical use.
The developed computational models were applied to examine side-by-side collisions between a VLCC class FPSO hull and a Suezmax class shuttle tanker hull at a collision speed of 2 kt. In the absence of pneumatic rubber fenders, the struck FPSO hull structure was severely damaged, whereas no such damage was seen in the cases in which the FPSO hull was equipped with 4 or 5 pneumatic rubber fenders.
Acknowledgements
This study was supported by BK21 FOUR Graduate Program for Green-Smart Naval Architecture and Ocean Engineering of Pusan National University. The present study was undertaken at the International Centre for Advanced Safety Studies / the Korea Ship and Offshore Research Institute (Lloyd’s Register Foundation Research Centre of Excellence, www.icass.center) at Pusan National University. This research was supported by Global Advanced Engineer Education Program for Future Ocean Structures (P0012646), funded by the Ministry of Trade, Industry and Energy. This work was also supported by Hwaseung Corporation, Busan, Republic of Korea.
Disclosure statement
No potential conflict of interest was reported by the author(s).
References
- ASTM. 2014. Standard test methods for tire cords, tire cord fabrics, and industrial filament yarns made from manufactured organic-base fibers. West Conshohocken, PA: ASTM Standard, D885.
- Cowper GR, Symonds PS. 1957. Strain-hardening and strain-rate effects in the impact loading of cantilever beams. Providence (RI): Division of Applied Mathematics, Brown University. Technical Report No. 28.
- Jones N. 2012. Structural impact. Second edition. Cambridge, UK: Cambridge University Press.
- Ko YG, Kim SJ, Paik JK. 2018a. Effects of a deformable striking ship’s bow on the structural crashworthiness in ship–ship collisions. Ships Offsh Struct. 13(S1):S228–S250.
- Ko YG, Kim SJ, Sohn JM, Paik JK. 2018b. A practical method to determine the dynamic fracture strain for the nonlinear finite element analysis of structural crashworthiness in ship–ship collisions. Ships Offsh Struct. 13(4):412–422.
- Kubiczek J, Liang B, Molter L, Ehlers S. 2016. A rubber bag for liquid cargo to improve ship collision safety. Proceedings of the 35th international Conference on Ocean, Offshore and Arctic Engineering (OMAE2016), 19–24 June; Busan, Republic of Korea.
- LS-DYNA. 2021. User’s manual volume II material model (version 971). Livermore Software Technology Corporation (LSTC), California, USA.
- Ogden RW. 1972. Large deformation isotropic elasticity on the correlation of theory and experiment for incompressible rubberlike solids. Proc R Soc A. 326(1567):565–584.
- Ozguc O. 2017. Structural damage of ship–FPSO collisions. J Mar Eng. 18(1):1–35.
- Paik JK. 2018. Ultimate limit state analysis and design of plated structures. Second edition. Chichester, UK: John Wiley & Sons.
- Paik JK. 2020. Advanced structural safety studies with extreme conditions and accidents. Singapore: Springer.
- Paik JK. 2022. Ship-shaped offshore installations: design, construction, operation, healthcare and decommissioning, Second Edition. Cambridge, UK: Cambridge University Press.
- PIANC. 2002. MarCom WG 33: Guidelines for the design of fender systems (2002-2004). Report of Working Group 33 of the Maritime Navigation Commission, The World Association for Waterborne Transport Infrastructure, Brussels. Belgium.
- Sakakibara S, Kaneko M, Yamada S, Nakatani K. 2010. A basic study on fender monitoring system by radio wave for floating type pneumatic fender. J Japan Inst Navig. 123:119–127.
- Xu X, Sahoo P, Evans J, Tao Y. 2019. Hydrodynamic performances of FPSO and shuttle tanker during side-by-side offloading operation. Ships Offsh Struct. 14(S1):292–299.
- Zhang X, Sun L, Ma C, Fassezke E, Sun H. 2016. A reliability evaluation method based on the weakest failure modes for side-by-side offloading mooring system of FPSO. J Loss Prev Process Ind. 41:129–143.