Abstract
Understanding the location patterns of firms within a region has proved to be an important factor to study the development of urban form. Moreover, the study of firms' location patterns allows the implementation of the adequate policy strategies to increase firms' location rate in certain areas, for example when practitioners are dealing with deprived zones. The aim of this paper is to map firmographic data as a function of its location over a certain period of time, and its employment weight in order to discuss which factors have a direct impact on the results and to highlight which specific areas need the adequate measures to promote employment and public transportation. As a case study, it is proposed to analyze the southwest region of Madrid. Spatial statistic methods were used for this study, which were found to be very efficient in order to evaluate which areas need special attention.
1. Introduction
In recent years, there has been a growing interest to understand the location patterns of firms within a region (CitationKrugman, 1998). They allow a better understanding of evolution of urban form toward efficient urban planning. For example, it is possible to implement the adequate policy strategies toward an increase of the firms' location rate. The former is especially relevant in the case of deprived regions because it may lead to higher employment opportunities which directly impact the regional economic growth.
These analyses are usually known as demography of firms, firm behavior, firmographic analysis or economic demography. Lately, they have drawn the attention of among others, economists, geographers, sociologists, urban engineers and demographers. These studies make use of individual firms as the unit of analysis.
The location of firms determines the spatial distribution of economic activities and employment. As explained by different authors, such as CitationVan Dijk and Pellenbarg (2000), CitationBrouwer, Mariotti, and Van Ommeren (2004), and CitationdMaoh and Kanaroglou (2007), firms do not locate randomly but rather using certain economic criteria to maximize profits. Firms co-locate becoming employment nodes and later defining urban form Citation(Maoh & Kanaroglou, 2007).
In fact, the main problem of the empirical analysis of the spatial patterns of firms is not related to the method that should be used for the analysis, but rather on the complexity to obtain detailed firmographic data due to both the lack of availability of micro datasets and confidentiality issues, as also discussed by different authors (CitationGatrell & Senior, 1999; CitationMaoh & Kanaroglou, 2007). In the case of Spain, these analyses are relatively rare especially with a high level of detail. Moreover, most of the studies fail to map the location of firms and employment over time as they generally focus on macroeconomic trends. As noted by CitationMejía-Dorantes, Páez, and Vassallo (2010, Citation2011), they notably help to understand the mobility patterns of firms.
The aim of this paper is to map firmographic data as a function of its location and its employment weight in order to understand which zones have become poles of employment within a certain suburbanized area and to discuss if these poles of economic activities have developed around major transport stations in order to foster sustainable transportation. For this purpose, spatial statistic methodologies, such as the kernel density function, were used. Finally, we present a regression model which confirms our findings and draws our attention to the importance of interchange stations. As a case study, it is analyzed the southwest region of Madrid, focusing on five municipalities, namely: Fuenlabrada, Alcorcon, Leganes, Mostoles and Getafe, due to the fact that these municipalities are connected by the metro line 12 ‘Metrosur’ since 2003. Although it is very expensive infrastructure, it has not achieved the government expectations, such as the integration and economic development of these five municipalities and the promotion of public transportation. All these municipalities have lower socio-economic characteristics than the rest of the Madrid region. For all these reasons, it is of great interest to map how enterprises and employment were located before, and after the opening of this Metro line, focusing on the areas around the stations.
2. Exploratory spatial data methods
Location of economic activities is not only related to economic reasons. Other factors such as land availability, special infrastructure, and good accessibility to customers and employees play an important role (CitationMaoh, 2007; Mejia-Dorantes, 2011). Hence, the analysis of localization of firms is related to many different spatial factors.
Recently, the analysis of spatial and spatio-temporal datasets has gained popularity among researchers due to their importance in many different fields. CitationCressie (1991) distinguishes three categories of spatial statistic analysis based on the data type under consideration: geostatistical data, lattice data, and point patterns. Point pattern analysis should be used when the important variable to be analyzed is the location of ‘events’ as it helps to answer if the events exhibit complete spatial randomness, clustering or regularity (CitationCressie, 1991), which is the case of firms location. Events could be related to other thematic such as housing, a certain group of population under study such as wildlife, epidemiology or even deforestation issues. See for example, CitationSeaman et al. (1998) for wildlife population; CitationGatrell and Senior (1999) on a thorough review focused on health care planning and epidemiology studies; and CitationDelmelle, Delmelle, Casas, and Barto (2011), regarding a study on epidemiological diseases in Colombia, Yet, only very few studies using this methodology are found for economic and urban studies (CitationCuthbert & Anderson, 2002; CitationMaoh & Kanaroglou, 2007; CitationMejia-Dorantes, Páez, & Vassallo, 2012).
These analyses are very useful for the exploration and presentation of data. As pointed out by CitationSilverman (1986), it is possible to use these analyses to illustrate the results and to draw conclusions that could not be obtained by other means.
2.1 Kernel density
Although the histogram is the oldest known density estimator, it has its limitations when analyzing spatial datasets and that is the reason of why the Kernel density estimator has become one of the most commonly used point pattern techniques. In this respect it shows how the intensity of a point pattern varies spatially. As said by different authors, it works as a ‘moving-window’ which is placed over a certain location layer or grid, and then the density of events is estimated at each location (CitationGatrell, 1996; CitationGatrell & Senior, 1999; CitationSilverman, 1986).
The Kernel function is in fact a well defined, smooth and optionally unbounded function (CitationBailey & Gatrell, 1995). Usually, a normal distribution is applied to the values, but as stated by CitationDe Smith, Goodchild, and Longle (2007), it is a bell-shaped curve extending to infinity in each direction with a finite area underneath the bell. As noticed by CitationCressie (1991) the grid resolution does not importantly affect the resulting surface. For the case of this analysis the resulting grid values provide a relative density, which are values in events per unit area, adjusted by the grid size, giving a figure as events per square meter. The value at grid location gj , at a distance dij from an event point i, is obtained as the sum of individual applications of the kernel function over all event points in the source dataset.
The univariate kernel density function used in ArcGis is known as the Quadratic (Epanechnikov or paraboloid) normalized function, where the distances dij have been divided by the kernel bandwith, h (t = dij/h). Further information regarding the theory about density functions can be found at CitationCressie (1991), CitationBailey and Gatrell (1995), and CitationDe Smith et al. (2007). Moreover, different methods have been proposed to get the best kernel functions (CitationFotheringham, Brunsdon, & Charlton, 2000).
Different methodologies have also been proposed to select the size of the bandwidth. In general terms, the smallest one would lead to the original map of events while the largest would over smooth the map (CitationGatrell, 1996; CitationSilverman, 1986).which diminishes any important detail. There are some proposed methodologies to select an efficient bandwidth, for example, the maximum clustering distance between points, using the K-function and L-function (CitationDelmelle et al., 2011) or the ‘Silverman's rule of thumb’(CitationSilverman, 1986).
However, the selection of the bandwidth has also to do with the amount of information we have and the level of detail is needed. For example, we might lose an important level of detail by analyzing a bigger grid. In the same manner, we may get spurious information if there are huge gaps among the two or more spatial datasets. Finally, an efficient bandwidth might not be the same among different locations or different years. Therefore, the selection of the correct bandwidth should also be tested by different trials and based on the size and type of the information we are dealing with, in order to get general optimized values. Once at this point, results of density values over a certain range should not change considerably since the points within the radius will be divided by a larger area.
3. Methodology for the firmographic analysis
Our research evaluates how the location of any type of business activities (offices, shops, industrial and so on) evolves throughout the years both before and after a new major transport infrastructure started operations. The data about business activities was obtained from the Bureau of Statistics of the Region of Madrid. We analyze the evolution of location of business activities of the five municipalities connected by the Metrosur metro-line (namely Fuenlabrada, Mostoles, Alcorcon, Leganes and Getafe) over a period of 10 years (1998–2007), from the time the construction of it was planned to four years after the inauguration of the line.
To carry out this analysis, a Geographic Information System (GIS) was used. The procedure is the following. First, the street network was built for geocoding purposes since it was needed for the subsequent analyses. Then, based on the information provided by the Bureau of Statistics of the Region of Madrid, we geo-located all the firms in the five municipalities connected by the Metro line 12. Afterwards, different Kernel density functions for the location of economic activities in each municipality and year were calculated. Since we did not have reliable information for the variable employment in 1998, we only mapped it for 2007. The dataset consisted of more than 31,000 firms in 2007 and more than 23,000 in 1998.
It is well known that Euclidean distances tend to overestimate the size of the area served by a transport or other facility (CitationGutiérrez & García-Palomares, 2008), therefore we used the service area approach, which is related to the real distance calculated over the street network (see ). In this case service areas were used to construct areas of 500 m walking distance around each station exit in order to obtain a value of density of firms and employment around each station. and show the kernel density values obtained for each 500 m service area. The legend of each map shows the kernel density values represented as percentage. The value shows the result by dividing the value of each cell by the highest found in the area, and afterwards multiplying the result per 100.
Figure 1. 500 m service areas around Metrosur stations.
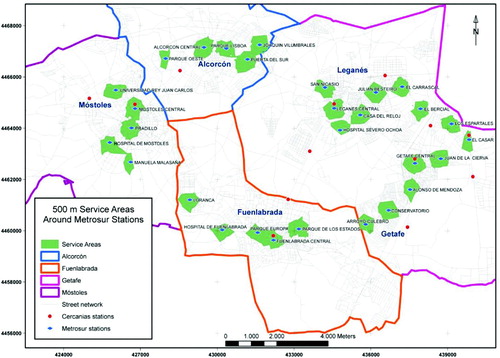
Figure 2. Sum of employment density around a 500 m service area.
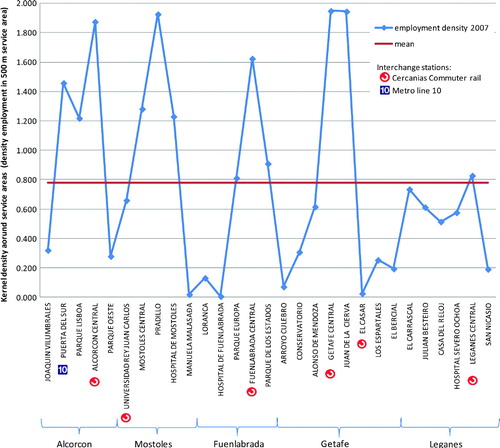
Figure 3. Increase of firms' density location between 1998 and 2007 around 500 m service areas.
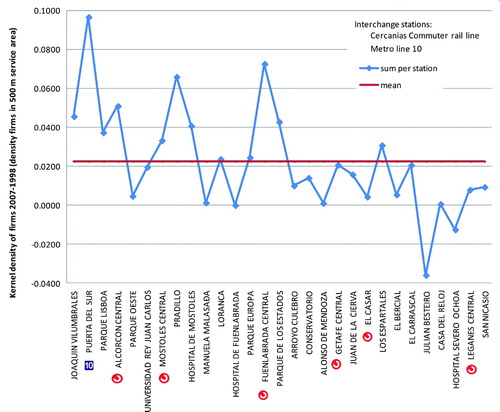
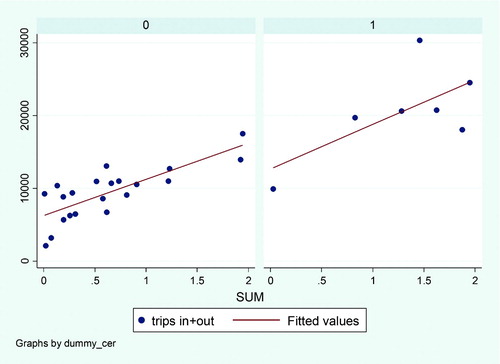
Figure 4. Regression model graph.
The reason for using 500 m service areas is based in different studies. First of all, different studies have proved that most of the riders in the region of Madrid, access to the stations by walking (CitationCRTM, 2005; CitationGutiérrez, Cardozo, & García-Palomares, 2011; CitationMetro de Madrid, 2008). Secondly, researchers agree on the fact that due to agglomeration economies and the advantages of easy access, different business activities should be concentrated very close to transport stations (CitationCambridge Systematics et al., 1998), although authors differ on the main distance from the station to the businesses affected. For example, CitationKeijer and Rietveld (2000) noted that people use more public transportation if they are located around 500 m from the station than farther away. More recently, CitationGutierrez et al. (2011) discuss that the ratio of ridership diminishes based on distance. In their models, they note that farther than 500 m from station, the probability of ridership notably diminishes in the region of Madrid. This value tends to be different depending on the cities under analysis and the resource to be reached. For example, the value of walking accessibility is notably smaller in the case of a University town in the United States Citation(Delmelle & Delmelle, 2012) The above is similar to the A-B-C policy in the Netherlands, which, among other regulations, stated that the location of firms and employment should be greater around rail or metro stations that farther away (CitationDijst, 1997; CitationSchwanen et al., 2004). Therefore, we analyze which areas are better served by employment opportunities and potential public accessibility.
Finally, to complement our analysis and based on the information obtained through kernel maps, a regression model was tested (see and figure 4). Using the study carried out by the Madrid Transport Authority in 2007, information of trips in-out of each station was obtained (CitationMetro de Madrid, 2008). In this study, it is possible to notice the huge variability among ridership of stations. While most of the interchange stations account for an important ridership of this metro line, some other stations, such as Manuel Malasaña in Mostoles have a very low rate of ridership. Therefore, in the regression model the dependent variable is related to the number of trips getting in and out, at these metro stations (tripsinout). As independent variables it is included a dummy, which gets the value of 1 if a station has an interchange to the commuter rail line, known as ‘Cercanias’ (dummy_cercanias) and the density of employment in that service area (sum_employ500m). It explains that if the Metrosur station is also interchange one, the ridership increases, but most importantly, it shows that in order to increase the ridership of stations, increasing the rate of employment is needed in the area. The results are quite similar if instead of the variable employment we use the firms' location difference between 1998 and 2007.
Table 1. Regression model.
4. Results and conclusions
The result of this study is the main map, which is a set of four data frames with firmographic datasets from the southwest of Madrid, where the metro line 12 “Metrosur” was built. The spatial techniques used reveal that this metro line could be better exploited by fostering the location of economic activities around the stations through the correct policy measures. By mapping employment densities and the location patterns of firms during a timeframe of 10 years it is possible to appreciate that around service areas of 500 m, the increase has not been important in many stations. Even worst it is to notice that around some stations, the location of economic activities has decreased. Finally, we developed a simple regression model with the information obtained by the spatial analysis represented in the map and a report carried out by the Madrid Transport Authority, where it is shown that the trips in and out of each station are related to the employment around 500 m and to the fact of having a transfer station.
As a conclusion, it is evident that urgent measures are needed in order to better exploit this major public transport infrastructure. Evidently, adequate policies for the location of economic activities will increase the ridership of this metro line and hence this metro line could be managed more efficiently.
Finally, these analyses could be used for spatial decision support in ex-ante studies when planning a new major transport infrastructure. This approach is interesting for the analysis of potential locations and accessibility along with different scenarios. Therefore, major poles of economic activities could be better served by a future transport line and the correct policy measures could be implemented before the infrastructure starts operations or even worst, uninformed decisions are made. On the other hand, transport interchanges would be better exploited, which is an issue that is recently in the spotlight thanks to European projects such as City-HUB which has recently started (CitationCity-HUB, 2012).
Finally, future assessment should also include not only the assessment of accessibility through the street network in service areas but rather an integrated assessment taking into account quality characteristics of the streets around stations (lightning, quality of sidewalks, cleanness and pollution, among others), which would be of great interest for developers, urban planners and practitioners.
Software
ESRI ArcGIS 9.X and ESRI ArcInfo Workstation were used as the analysis platform for this project. ESRI ArcGIS 9.X was used to create the maps.
Map design
It was decided to present the map on a single A1 sheet where four different maps are shown. The two maps located in the top of the page represent the kernel density for the location of economic activities in 1998 and 2007, the darker the colors are, the bigger is the density value. Below these two maps is the difference among 2007 and 1997, red is equal to a negative value and green colors are equal to positive values. In the bottom of the sheet is the Kernel density function for the employment location, the darker the colors are, the bigger is the density value. Since we did not have reliable information for the variable employment in 1998, we only mapped it for 2007. In every map the densities are represented within 500 m service areas, Firms’ location density out of service areas is shown using a transparent layer.
Supplemental Material
Download PDF (2.4 MB)Acknowledgments
Financial support from the Spanish grant TRA2006-07008 is gratefully acknowledged.
References
- Bailey, T. C. , and Gatrell, A. C. , 1995. Interactive spatial data analysis . Essex, UK: Longman Harlow; 1995.
- Brouwer, A. E. , Mariotti, I. , and Van Ommeren, J. N. , 2004. The firm relocation decision: An empirical investigation , The Annals of Regional Science 38 (2004), pp. 335–347, (doi:10.1007/s00168-004-0198-5).
- Cambridge Systematics, Cervero, R., & Aschuer, D. (1998) TCRP Report 35: Economic Impact Analysis of Transit Investment: Guidebook for Practitioners..
- City-HUB. (2012) http://www.cityhub-project.eu 12/2012.
- Cressie, N. , 1991. Statistics for spatial data . New York, USA: John Wiley and Sons, Inc; 1991.
- CRTM. (2005). Aforo y Encuesta a Los Usuarios De La Red De Metro De Metrosur (Octubre-Noviembre 2004)..
- Cuthbert, A. L. , and Anderson, W. P. , 2002. Using spatial statistics to examine the pattern of urban land development in halifax–Dartmouth , The Professional Geographer 54 (2002), pp. 521–532, (doi:10.1111/0033-0124.00347).
- Delmelle, E. M. , and Delmelle, E. C. , 2012. Exploring spatio-temporal commuting patterns in a university environment , Transport Policy 21 (2012), pp. 1–9, (doi:10.1016/j.tranpol.2011.12.007).
- Delmelle, E. , Delmelle, E. C. , Casas, I. , and Barto, T. , 2011. HELP: A GIS-based health exploratory analysis tool for practitioners , Applied Spatial Analysis and Policy 4 (2011), pp. 113–137, (doi:10.1007/s12061-010-9048-2).
- De Smith, M. J. , Goodchild, M. F. , and Longle, P. , 2007. Geospatial analysis: A comprehensive guide to principles, techniques and software tools . Leicester: Matador, Leicester; 2007.
- Dijst, M. , 1997. Spatial policy and passenger transportation , Journal of Housing and the Built Environment 12 (1997), pp. 91–111, (doi:10.1007/BF02502625).
- Fotheringham, A. S. , Brunsdon, C. , and Charlton, M. , 2000. Quantitative geography: Perspectives on spatial data analysis . London: Sage Publications Ltd; 2000.
- Gatrell, A. C. , 1996. Spatial point pattern analysis and its application in geographical epidemiology , Transactions of the Institute of British Geographers 21 (1996), p. 256, (doi:10.2307/622936).
- Gatrell, A. C. , and Senior, M. , 1999. "Health and health care applications". In: Longley, P. , Maguire, D. , Goodchild, M. , and Rhind, D. , eds. Geographical information systems: Principles techniques management and applications . 1999, 2 (pp. 925–938). London, Wiley.
- Gutiérrez, J. , Cardozo, O. D. , and García-Palomares, J. C. , 2011. Transit ridership forecasting at station level: an approach based on distance-decay weighted regression , Journal of Transport Geography 19 (2011), pp. 1081–1092, (doi:10.1016/j.jtrangeo.2011.05.004).
- Gutiérrez, J. , and García-Palomares, J. C. , 2008. Distance-measure impacts on the calculation of transport service areas using GIS , Environment and Planning B: Planning and Design 35 (2008), pp. 480–503, (doi:10.1068/b33043).
- Keijer, M. , and Rietveld, P. , 2000. How do people get to the railway station? The Dutch experience , Transportation Planning and Technology 23 (2000), pp. 215–235, (doi:10.1080/03081060008717650).
- Krugman, P. , 1998. Space: The final frontier , The Journal of Economic Perspectives 12 (1998), pp. 161–174, (doi:10.1257/jep.12.2.161).
- dMaoh, H. , 2007. Business establishment mobility behavior in urban areas: A microanalytical model for the City of Hamilton in Ontario, Canada , Journal of Geographical Systems 9 (2007), pp. 229–252, (doi:10.1007/s10109-007-0043-3).
- Maoh, H. , and Kanaroglou, P. , 2007. Geographic clustering of firms and urban form: A multivariate analysis , Journal of Geographical Systems 9 (2007), pp. 29–52, (doi:10.1007/s10109-006-0029-6).
- Mejia-Dorantes, L. (2011). Transportation infrastructure impacts on house prices and firms’ location: The effect of a new metro line in the suburbs of Madrid. (Ph.D. thesis). Spain: Universidad Politecnica de Madrid..
- Mejia-Dorantes, L., Páez, A., & Vassallo, J. M. (2010). Assessment of the influence due to a new metro line on the promotion of business activities around stations: A case study of Metrosur in Madrid. 12th World Conference for Transport Research, Lisbon, Portugal..
- Mejia-Dorantes, L. , Paez, A. , and Vassallo, J. M. , 2011. Transportation infrastructure impacts on firm location: The effect of a new metro line in the suburbs of Madrid . Washington, DC. 2011.
- Mejia-Dorantes, L. , Paez, A. , and Vassallo, J. M. , 2012. Transportation infrastructure impacts on firm location: The effect of a new metro line in the suburbs of Madrid , Journal of Transport Geography 22 (2012), pp. 236–250, (doi:10.1016/j.jtrangeo.2011.09.006).
- Metro de Madrid. (2008). Encuesta Año 2007 “Estación De Entrada-Estación De Salida” a Los Usuarios De La Red De Metro. Tomo 4: Resultados a Nivel De Estaciones..
- Schwanen, T. , Dijst, M. , and Dieleman, F. M. , 2004. Policies for urban form and their impact on travel: The Netherlands experience , Urban Studies 41 (2004), pp. 579–603, (doi:10.1080/0042098042000178690).
- Seaman, D. E. , Griffith, B. , and Powell, R. A. , 1998. KERNELHR: A program for estimating animal home ranges , Wildlife Society Bulletin 26 (1998), pp. 95–100.
- Silverman, B. W. , 1986. Density estimation for statistics and data analysis . London: Chapman & Hall/CRC; 1986.
- Van Dijk, J. , and Pellenbarg, P. H. , 2000. Firm relocation decisions in The Netherlands: An ordered logit approach , Papers in Regional Science 79 (2000), pp. 191–219, (doi:10.1007/s101100050043).