
Abstract
The aim of this paper is to investigate landslide susceptibility mapping in regional scale, considering the spatial stationarity of the relationship between landslide susceptibility and its influencing factors. Landslides are among the most severe natural hazards and their management has a key role to human safety. During the last decades, a significant number of GIS-based methods for landslide susceptibility assessment and mapping have been proposed in the literature. In this paper, contemporary methods for landslide susceptibility analysis have been applied. The latter include global and local regression analysis aiming to study the relationship between landslide occurrence and its determinants. This paper also examines if this relationship is spatial non-stationary via the application of the Geographically Weighted Regression (GWR). The proposed methodology has been applied in the Peloponnese peninsula, in South Greece. To examine the factors responsible for the occurrence of a landslide event; topographic (slope angle, elevation), geological and other environmental variables (land cover, rainfalls) were considered. The results suggest that GWR provides a potential improvement in landslide susceptibility assessment compared to traditional global regression analysis methods.
1. Introduction
Landslide phenomena have been natural earth surface processes occurring a long time before the appearance of humans on Earth. However, nowadays, the perception of the natural events into natural disasters has been transformed (CitationAlcántara-Ayala, 2002). The demand for estimating landslide susceptibility has evolved during the last decades. Landslides are characterised among the most severe natural hazards, which can cause casualties, fatalities, harm or devastation in natural and man-made environment. They are complex processes, mainly because of the many different influential factors involved in the manifestation of a landslide event. Landslide Susceptibility (LS) is defined as the likelihood of a landslide occurring in an area on the basis of local terrain conditions. LS zonation refers to the division of the land in homogeneous areas or domains according to the degree of actual or potential hazard (CitationVarnes, 1984). Landslide occurrence, in space and/or time, can be inferred from heuristic investigations, computed through the analysis of environmental information, or inferred from physical models. Therefore, a territory can be zoned into hazard classes ranked according to different probabilities for landslide occurrence.
During the last decades, the development of Geographical Information Systems (GIS) software has helped in the increasing implementation of GIS-supported hazard zonation methods for land use planning and landscape management. One of the main advantages of using GIS technology is the development and integration of different input variables which allow for the definition and calibration of hazard occurrence models.
A variety of methods for landslide susceptibility assessment and mapping were proposed in the recent literature. Many of these methods are GIS-based and are related to both qualitative and quantitative analysis. The appropriate method for a specific case study depends on factors such as the feasibility or detailed design; the working scale; the data availability and whether the sliding areas under investigation are constructed or natural. Methodology overviews have been presented in the works of CitationLeroi (1996), CitationSoeters and Van Westen (1996), CitationAleotti and Chowdhury (1999) and CitationCarrara, Guzzetti, Cardinali, and Reichenbach (1999), CitationVan Westen, Rengers, and Soeters (2003), CitationLee and Jones (2004), CitationGlade and Crozier (2005), and CitationYalcin (2008). Qualitative methods include geomorphologic analysis (CitationCorominas, Esgleas, & Baeza, 1990) and the use of index or parameter maps. Some qualitative approaches, however, incorporate the idea of ranking and weighting the parameters involved, and may turn to be semi-quantitative in nature (CitationAyalew, Yamagishi, Marui, & Takami, 2005; CitationWang, Xie, & Du, 2009). Quantitative methods are based on numerical expressions of the relationships between controlling factors and landslide occurrence. They include physically based approaches (CitationJibson, Harp, & Michael, 2000; CitationVan Westen et al., 2003; CitationThiebes, Bell, & Glade, 2007), statistical analyses (CitationAkgun, 2012; CitationAyalew & Yamagishi, 2005; CitationChang & Kim, 2004; CitationErcanoglu & Temiz, 2011; CitationFerentinou & Chalkias 2013; CitationJiménez-Perálvarez, Irigaray, El. Hamdouni & Chacón, 2009; CitationLee & Sambath, 2006; CitationMathew, Jha, & Rawat, 2009; CitationPiacentini et al., 2012; CitationVergari et al., 2011), and finally, artificial neural networks and fuzzy/neuro-fuzzy analysis (CitationErcanoglu & Gokceoglu, 2002; CitationFerentinou & Sakellariou, 2005; CitationLee et al., 2003; CitationLee, 2007; CitationMelchiorre, Matteucci, & Remondo, 2006; CitationPradhan & Lee, 2009; CitationPourghasemi, Mohammady, & Pradhan, 2012).
It is necessary to note that the literature investigating the potential use of Geographical Weighted Regression for landslide susceptibility assessment is very limited (CitationErener & Düzgün, 2010). In this paper, global and local statistical models for landslide susceptibility assessment of the Peloponnese peninsula in South Greece have been defined and calibrated. The main output from this analysis is a landslide susceptibility map (scale: 1: 400.000) of the Peloponnese peninsula presented in the Main Map.
2. Geographical and geological setting of the study area
The proposed approach was applied using data referring to the Peloponnese peninsula in South Greece which constitutes the largest peninsula of Greece (). The area of Peloponnese has an extent of 21,439 km2 and a population of 1,046,897 permanent residents according to the 2011 census for population in Greece held by the CitationHellenic Statistical Authority (2013). Administratively, the area is divided into seven prefectures (Achaia, Argolida, Arkadia, Ilia, Korinthia, Lakonia and Messinia). Peloponnese is an area highly suffered by the occurrence of severe natural disasters (such as earthquakes, floods, landslides and wild fires). Heavy rainfalls triggered several unexpected debris floods and mudflows in western Peloponnese, especially in Ilia prefecture. The latter was heavily injured by severe forest fires in August 2007 when 36 people died. Earthquakes have also triggered landslide events mainly in the northern part of the peninsula, where landslide events are related to major fault tectonics. Considering the morphological and geological conditions of Peloponnese, slope stability problems are among the most severe hazards for public safety and land use planning and management. The peninsula has a complex geomorphology, with mountainous interior, many coastal cliffs, in the south, and basins, coastal beaches, lagoons, lakes, in the west and south east coasts. The drainage network is well developed, and is highly controlled by fault tectonics. Agricultural, forest and semi-natural areas mainly cover the largest part of Peloponnese. In the coastal zone, an urban cover is dominant. The main lithological types are carbonate rocks in the western part and flysch in central and eastern parts of the peninsula. Neogene and Quaternary sediments are also evident. Moreover, the study area is an active tectonic area with extended tectonic tissue, expressed through faults, thrust zones and folds.
Figure 1. Study area (Peloponnese) with landslide events.
3. Data and Methods
3.1. Data
Landslide susceptibility mapping relies on the knowledge of slope movements and their causal factors. Thus, a detailed knowledge of the processes that have been active in a study area and the factors leading to the occurrence of a potential landslide event is required. The objective is usually to assess the critical factors contributing to landsliding in order to both decide on the appropriate remedial measures and predict future events. The factors leading to landsliding according to CitationVarnes (1984) are the following: geological, morphological, physical and human. All these factors were organised in the following data layers (, ).
Figure 2. Data layers – predictor variables.
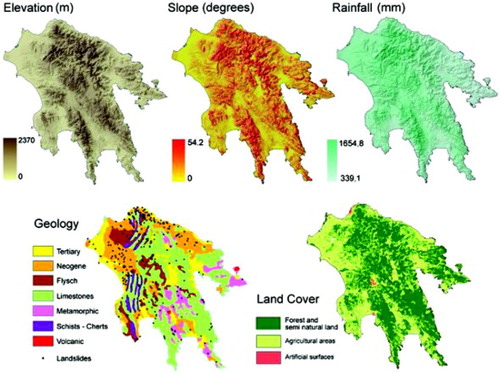
Table 1. Data layers of the spatial database representing landslide influencing factors.
The implementation of the statistical analysis was based on GIS functionality and the integration of these data layers in a geodatabase. The sources of this information are analogue maps provided from national cartographic agencies such as the Geological maps of the Greek Institute of Geology and Mineral Exploration (Geological Map of Greece at 1/500.000, CitationBornovas and Rondogianni-Tsiambaou (1983), as well as global and continental digital databases (e.g. SRTM project topographical data, CORINE land cover data).
In this study, the data representing factors affecting a landslide are organised in raster format, with a cell size of 100×100 metres. The selected cell size is as close as possible to the original data resolution so as to reduce the loss of specificity introduced in the resampling process. The processing of these layers using GIS produced secondary data layers (such as slope, etc.). The Digital Elevation Model (DEM) of the study area is a critical dataset for the GIS-based LSA as many of secondary variables can be derived from the DEM. The source of this DEM is the (SRTM)/SIR-C global database (https://earthexplorer.usgs.gov). The dataset of the examined landslide inventories covers significant landslide events in the study area. Three landslide inventory datasets were used with a total of 248 cases, covering a time period from 1910 to 2003. These datasets describe events related to landslides affecting villages, small towns and transportation network. The landslide inventories were developed from various sources: field mapping, remote sensing data and the relevant literature (CitationKoukis, Rozos, & Hadzinakos, 1997; CitationTsagas, 2011).
3.2. Logistic regression
Logistic Regression (LG) is a multivariate analysis method for predicting the presence (or the absence) of a phenomenon (in this case of a landslide) based on the values of predictor variables. The aim of the analysis here is to assess the relationship – via formulation – between landslides and potential factors influencing landsliding. Logistic regression modelling incorporates effectively different kind of variables that can be continuous or discrete. In the literature of the last decade, logistic regression appears to be one of the most popular methods for landslide susceptibility assessment and has been applied in different geographical areas and various geographical scales (see for example CitationDai & Lee, 2003; CitationSüzen & Doyuran, 2004; CitationYesilnacar & Topal, 2005).
The steps for the creation of a landslide susceptibility map with the use of a logistic regression model are the following:
Construction of final variables in raster format. Predictor variables correspond to the spatial data layers of elevation, slope, rainfall, landcover and geology.
The dependent variable refers to a landslide's occurrence at a location. Thus, data layer of landslide events was constructed. This layer is binary with value 1 for landslides and value 0 for non – landslides.
Creation of a dataset by sampling the dependent and predictor variables. The output of this step is a table with the values of the dependent (0 or 1) and the predictor variables at each location.
Application of the global and local logistic regression analysis using the above dataset. The main aim of this step is to be able to estimate the presence or absence of a landslide in correlation with the values of the independent variables (CitationHosmer & Lemeshow, 1989). The output of this step is the calculation of the coefficients for the logistic regression formula. The application of this formula for each cell provided the landslide susceptibility map of the area under investigation.
A linear form of the logistic model can be defined as follows:
where pi is the probability of landslide occurrence at location i (this is the dependent variable), a0 is the constant, ak are the parameter estimates of the k-th factor xk that may determine this occurrence (these are the independent variables); and ϵi is the error term (the model's residual).
3.3. Geographically Weighted Logistic Regression (GWLR)
It is common place to argue that a landslide is a geographical phenomenon; it occurs at a location and is affected by the characteristics of the location and its surroundings. In recent years, geographical theory challenges the assumptions made in traditional statistical modelling, such as the spatial stationary of the relationship between a phenomenon and each of its potential determinants. Inspired by CitationTobler's (1970) first law of geography (‘everything is related to everything else, but near things are more related than distant things’), one of the most cutting edge methodologies for examining the existence of spatial non-stationarity in the relationships between a geographical phenomenon and its determinants is the Geographically Weighted Regression (GWR) (CitationFotheringham, Brunsdon, & Charlton, 2002). CitationKalogirou and Hatzichristos (2007) provide empirical evidence for the superiority of GWR over traditional regression. GWR allows for local parameters to be estimated (CitationFotheringham & Brunsdon, 1999) and can thus examine for the existence of spatial non-stationarity in the effect of each factor on the occurrence of a landslide. In this paper, the Geographical Weighted Logistic Regression has been applied as a local regression method for LSA. Examples of Geographical Weighted Logistic Regression include the exploration of the relations between riverbank erosion and geomorphological controls (CitationAtkinson, German, Sear, & Clark, 2003), the spatial simulation of regional land use patterns (CitationLiao et al., 2010) and the exploration of spatial non-stationarity of fisheries survey data (CitationWindle et al., 2010).
A geographically weighted version of the above logistic model can be defined as follows:
where pi is the probability of landslide occurrence at location i with coordinates (ui , vi ); and ak are the local parameter estimates of the k-th factor xk that may determine this occurrence (CitationFotheringham et al., 2002). The stages for the creation of a landslide susceptibility map according to the Geographically Weighted Logistic Regression (GWLR) model defined above are similar to the global model. The main difference is the application of the logistic regression analysis at a local scale. This is done by fitting a weighted logistic model for each landslide location using a subset of the original dataset. Thus, a kernel that determines the size of the subset and a weighting function to calculate the weights are required in order to define the GWLR model. In this study, an adaptive kernel that uses a bi-square weighting scheme has been adopted. The optimal number of nearest neighbours is estimated by the GWR 3.0 software using an optimisation criterion; this is the minimisation of the corrected Akaike Information Criterion (AICC).
The bi-square function for calculating the weights is:
where for each landslide in location i in which a local model fits, the weight for the observation in location j of the subset is wij , dij is the distance between i and j, and hi is the distance of the Νth nearest neighbour of i to the location i (hi =diN ). N refers to the bandwidth size or number of nearest neighbours. The application of the GWLR results in unique local parameter estimates for each cell. The local parameter estimates of the landslide determinants are presented in the lower part of the Main Map that supplements this manuscript.
4. Results – Discussion
The logistic regression as well as the GWLR modelling for the LSA of the study area was implemented with the use of GWR 3.0 software (CitationFotheringham et al., 2002). presents the parameter estimates and model diagnostics of the global logistic regression model.
Table 2. Global Logistic Regression parameter estimates and model diagnostics.
shows descriptive statistics of the local parameter estimates of the landslide determinants and the goodness of fit statistics of the GWLR model. The number of nearest neighbours selected by the GWR 3.0 software was 417; this is 43.5% of the total observations. This bandwidth size minimised the corrected AIC criterion and was a result of a simulation process converged after eight function calls. The intercepts (a0 ) range from −11.64 to −0.83 with a median of −5.47; the Geology parameter estimates range from −0.65 to 1.86 with median of 0.72; the land cover parameter estimates range from 0.65 to 4.59 with a median of 2.69; the rainfall parameter estimates range from −0.0036 to 0.0049 with a median of 0.0005; the elevation parameter estimates range from −0.0033 to 0.0012 with a median of −0.0001; and the slope parameter estimates range from 0.63 to 1.13 with a median of 0.79. The intercept and the local parameter estimates for all determinants of landslides have been mapped and are presented in the lower part of the Main Map.
Table 3. Geographically Weighted Logistic Regression parameter estimates and model diagnostics.
The local parameter estimates for rainfall are negative in the northwest part of the Peloponnese peninsula and positive in the other areas of the peninsula. The local parameter estimates for slope are positive across all the study area with lower values located in west Peloponnese. These results indicate a degree of spatial variation in the relationship between landslide susceptibility and the physical factors in the study area.
Empirical evidence for the superiority of the GWLR model in comparison with the standard global logistic regression model are the lower AICC and the lower Moran's I statistic of the GWLR model residuals. The AICC is 472.45 for the GWLR model and 477.66 for the global logistic model. Since the difference of these two values is greater than 3 the local model fits better than the global model. Moreover, based on the Moran's I statistic, the residuals of the GWLR model do not exhibit significant spatial autocorrelation (Moran's I: 0.01 and z score: 1.06 stdev) whereas those of the global model exhibit significantly positive spatial autocorrelation (Moran's I: 0.09 and z score: 7.53 stdev).
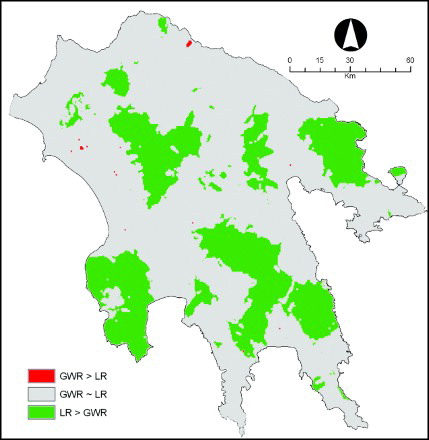
The advantage of the GWLR method compared with the logistic regression can be also demonstrated by comparing the corresponding susceptibility maps. A map of the differences between the estimates of the two models is presented in below. Generally, the use of the traditional Logistic Regression (LR) overestimates the landslide susceptibility (CitationChalkias et al., 2011). It is apparent from that in the majority of the cases there are small differences between the two models. However, there are many cases where the LR estimates are higher than those of the GWLR and only a few cases where the reverse is the case.
Figure 3. Differences of landslide susceptibility estimations between the GWLR and the global Logistic Regression.
5. Conclusions
This study presented both a standard global logistic regression and a Geographically Weighted Logistic Regression model for landslide susceptibility assessment. The interpretation of the landslide susceptibility map across the Peloponnese peninsula allows policy makers to make informed decisions for natural hazard prevention and mitigation. The high susceptibility areas are concentrated in the western and southern part of Peloponnese with few scattered high susceptibility pockets in the central and eastern part of the peninsula. Additionally, a linear concentration of high susceptibility values is located in the coastal zone at the north part of the Peninsula.
The analysis revealed that the contribution of each influencing factor to landslide occurrence varies across the study area. The spatial variation of the effect of landslide determinants provides useful information about landslide processes that would have been missed if only traditional global modelling was performed. The results indicate that a GWLR model provides a potential improvement in landslide susceptibility assessment compared to the traditional logistic regression models presented in the literature. However, more studies and empirical evidence is necessary to support this conclusion.
Software
The processing of geographic data (spatial database construction, spatial transformations) was carried out in ESRI's ArcGIS 9.3. The advanced spatial analysis (DEM creation, sampling, spatial interpolation, etc.) was implemented in ESRI's ArcGIS 9.3 with the use of the Spatial Analyst and the Geostatistical Analyst extensions. The models for the landslide susceptibility analysis of the study area were calibrated with the use of GWR 3.0 under an academic license provided by the National Centre for Geocomputation, Ireland. The maps were designed and created within ESRI's ArcGIS 9.3 and later edited in Adobe Photoshop 7.
Main Map: Landslide Susceptibility: Peloponnese Peninsula in South Greece
Download PDF (7.9 MB)Acknowledgements
The authors would like to thank the editors of the Journal of Maps for accepting this paper for the journal's special issue on ‘Mapping Environmental Risks: Quantitative and Spatial modelling approaches’, as well as the professional cartographer for the map review and the reviewers of the manuscript who helped improve the quality of the Main Map and this paper.
Related Research Data
References
- Akgun, A. (2012). A comparison of landslide susceptibility maps produced by logistic regression, multi-criteria decision, and likelihood ratio methods: A case study at İzmir, Turkey. Landslides, 9(1), 93–106. doi:10.1007/s10346-011-0283-7 doi: 10.1007/s10346-011-0283-7
- Alcántara-Ayala, I. (2002). Geomorphology, natural hazards, vulnerability and prevention of natural disasters in developing countries. Geomorphology, 47(2–4), 107–124. doi:10.1016/S0169-555X(02)00083-1 doi: 10.1016/S0169-555X(02)00083-1
- Aleotti, P., & Chowdhury, R. (1999). Landslide hazard assessment: summary review and new perspectives. Bulletin of Engineering Geology and the Environment, 58, 21–44. doi:10.1007/s100640050066 doi: 10.1007/s100640050066
- Atkinson, P. M., German, S. E., Sear, D. A., & Clark, M. J. (2003). Exploring the relations between river bank erosion and geomorphological controls using geographically weighted logistic regression. Geographical Analysis, 35(1), 58–82. doi:10.1111/j.1538-4632.2003.tb01101.x doi: 10.1353/geo.2002.0028
- Ayalew, L., & Yamagishi, H. (2005). The application of GIS-based logistic regression for landslide susceptibility mapping in the Kakuda-Yahiko Mountains Central Japan. Geomorphology, 65, 15–31. doi:10.1016/j.geomorph.2004.06.010 doi: 10.1016/j.geomorph.2004.06.010
- Ayalew, L., Yamagishi, H., Marui, H., & Takami, K. (2005). Landslides in Sado Island of Japan: Part II. GIS-based susceptibility mapping with comparisons of results from two methods and verifications. Engineering Geology, 81(4), 432–445. doi:10.1016/j.enggeo.2005.08.004 doi: 10.1016/j.enggeo.2005.08.004
- Bornovas, J., & Rondogianni-Tsiambaou, T. (Eds.) (1983). Geological map of Greece, Scale: 1:500.000. Athens: Division of general geology and economic geology: Institute of Geology and Mineral Exploration (IGME).
- Carrara, A., Guzzetti, F., Cardinali, M., & Reichenbach, P. (1999). Use of GIS technology in the prediction and monitoring of landslide hazard. Natural Hazards, 20, 117–135. doi:10.1023/A:1008097111310 doi: 10.1023/A:1008097111310
- Chalkias, C., Kalogirou, S., & Ferentinou, M. (2011). Global and local statistical modeling for landslide susceptibility assessment: A comparative analysis. In S. Kalogirou (Eds.), Proceedings of the 17th European Colloquium on Quantitative and Theoretical Geography (pp. 88–97). Athens: Harokopio University. ISBN: 978–960-87751-1-4.
- Chang, H., & Kim, N. K. (2004). The evaluation and the sensitivity analysis of GIS-based landslide susceptibility models. Geosciences Journal, 8(4), 415–423. doi: 10.1007/BF02910477 doi: 10.1007/BF02910477
- Corominas, J., Esgleas, J., & Baeza, C. (1990). Risk mapping in the Pyrenees area: a case study. In R. Sinniger, & M. Mombaron (Eds.), Hydrology in Mountainous Regions II: Artificial Reservoirs: Water and Slopes (pp. 425–428). Wallingford: IAHS Press.
- Dai, F. C., & Lee, C. F. (2003). A spatiotemporal probabilistic modelling of storm-induced shallow landsliding using aerial photographs and logistic regression. Earth Surface Processes and Landforms, 28(5), 527–545. doi:10.1002/esp.456 doi: 10.1002/esp.456
- Ercanoglu, M., & Gokceoglu, C. (2002). Assessment of landslide susceptibility for a landslide-prone area (north of Yenice, NW Turkey) by fuzzy approach. Environmental Geology, 41, 720–730. doi:10.1007/s00254-001-0454-2 doi: 10.1007/s00254-001-0454-2
- Ercanoglu, M., & Temiz, F. A. (2011). Application of logistic regression and fuzzy operators to landslide susceptibility assessment in Azdavay (Kastamonu, Turkey). Environmental Earth Sciences, 64(4), 949–964. doi:10.1007/s12665-011-0912-4 doi: 10.1007/s12665-011-0912-4
- Erener, A., & Düzgün, H. S. B. (2010). Improvement of statistical landslide susceptibility mapping by using spatial and global regression methods in the case of More and Romsdal (Norway). Landslides, 7(1), 55–68. doi:10.1007/s10346-009-0188-x doi: 10.1007/s10346-009-0188-x
- Ferentinou, M., & Chalkias, C. (2013). Mapping Mass Movement Susceptibility across Greece with GIS, ANN, and Statistical Methods. In C. Margottini, P. Canuti, & K. Sassa (Eds.), Landslide Science and Practice: Volume 1: Landslide Inventory and Susceptibility and Hazard Zoning (pp. 321–327). Berlin: Springer-Verlag.
- Ferentinou, M. D., & Sakellariou, M. G. (2005). Assessing landslide hazard on medium and large scales using self-organising maps. In O. Hungr, R. Fell, R. Couture, & E. Eberhardt (Eds.), Landslide risk Management (pp. 639–648). Abingdon: Taylor & Francis.
- Fotheringham, A. S., & Brunsdon, C. (1999). Local Forms of Spatial Analysis. Geographical Analysis, 31(4), 340–358. doi:10.1111/j.1538-4632.1999.tb00989.x doi: 10.1111/j.1538-4632.1999.tb00989.x
- Fotheringham, A. S., Brunsdon, C., & Charlton, M. (2002). Geographically Weighted Regression: the analysis of spatially varying relationships. Chichester: John Wiley and Sons.
- Glade, T., & Crozier, M. J. (2005). A review of scale dependency in landslide hazard and risk analysis. In T. Glade, M. G. Anderson, & M. J. Crozier (Eds.), Landslide risk assessment (pp. 75–138). New York: John Wiley.
- Hellenic Statistical Authority (2013). Announcement of the demographic and social characteristics of the Resident Population of Greece according to the 2011 Population - Housing Census. Retrieved from http://www.statistics.gr/portal/page/portal/ESYE/BUCKET/General/nws_SAM01_EN.PDF.
- Hosmer, D. W., & Lemeshow, S. (1989). Applied Logistic Regression. New York: Wiley.
- Jibson, R. W., Harp, E. L., & Michael, J. A. (2000). A method for producing digital probabilistic seismic landslide hazard maps. Engineering Geology, 58, 271–289. doi:10.1016/S0013-7952(00)00039-9 doi: 10.1016/S0013-7952(00)00039-9
- Jiménez-Perálvarez, J. D., Irigaray, C., El. Hamdouni, R., & Chacón, J. (2009). Building models for automatic landslide-susceptibility analysis, mapping and validation in ArcGIS. Natural Hazards, 50(3), 571–590. doi:10.1007/s11069-008-9305-8 doi: 10.1007/s11069-008-9305-8
- Kalogirou, S., & Hatzichristos, T. (2007). A spatial modelling framework for income estimation. Spatial Economic Analysis 2(3), 297–316. doi:10.1080/17421770701576921 doi: 10.1080/17421770701576921
- Koukis, G., Rozos, D., & Hadzinakos, I. (1997). Relationship between rainfall and landslides in the formations of Achaia county, Greece. In P. G. Marinos, G. C. Koukis, G. C. Tsiambaos, & G. C. Stournaras (Eds.), Proceedings of the International Symposium of I.A.E.G. in Engineering Geology and the Environment (pp. 793–798). Rotterdam: Balkema.
- Lee, S. (2007). Application and verification of fuzzy algebraic operators to landslide susceptibility mapping. Environmental Geology, 52, 615–623. doi:10.1007/s00254-006-0491-y doi: 10.1007/s00254-006-0491-y
- Lee, E. M., & Jones, D. K. C. (Eds.). (2004). Landslide risk assessment. London: Thomas Telford.
- Lee, S., Ryu, J-H., Lee, M-J., & Won, J-S. (2003). Use of an artificial neural network for analysis of the susceptibility to landslides at Boun, Korea. Environmental Geology, 44, 820–833. doi:10.1007/s00254-003-0825-y doi: 10.1007/s00254-003-0825-y
- Lee, S., & Sambath, T. (2006). Landslide susceptibility mapping in the Damrei Romel area, Cambodia using frequency ratio and logistic regression models. Environmental Geology 50, 847–855. doi:10.1007/s00254-006-0256-7 doi: 10.1007/s00254-006-0256-7
- Leroi, E. (1996). Landslide hazard – Risk maps at different scales: objectives, tools and developments. In K. Senneset (Eds.), Landslides: Proc. Int. Symp. on Landslides (pp. 35–52). Trondheim.
- Liao, Q., Li, M., Chen, Z., Shao, Y., & Yang, K. (2010). Spatial simulation of regional land use patterns based on GWR and CLUE-S model. Proceedings of the 18th International Conference on Geoinformatics (pp. 1–6). Beijing, China. doi:10.1109/GEOINFORMATICS.2010.5567963.
- Mathew, J., Jha, V. K., & Rawat G. S. (2009). Landslide susceptibility zonation mapping and its validation in part of Garhwal Lesser Himalaya, India, using binary logistic regression analysis and receiver operating characteristic curve method. Landslides, 6, 17–26. doi:10.1007/s10346-008-0138-z doi: 10.1007/s10346-008-0138-z
- Melchiorre, C., Matteucci, M., & Remondo, J. (2006). Artificial Neural Networks and Robustness Analysis in Landslide Susceptibility Zonation. International joint Conference on Neural Networks, (pp. 4375–4381). Vancouver, Canada: IEEE. doi:10.1109/IJCNN.2006.247036
- Piacentini, D., Troiani, F., Soldati, M., Notarnicola, C., Savelli, D., Schneiderbauer, S., & Strada, C. (2012). Statistical analysis for assessing shallow-landslide susceptibility in South Tyrol (south-eastern Alps, Italy). Geomorphology, 151–152, 196–206. doi:10.1016/j.geomorph.2012.02.003 doi: 10.1016/j.geomorph.2012.02.003
- Pourghasemi, H. R., Mohammady, M., & Pradhan, B. (2012). Landslide susceptibility mapping using index of entropy and conditional probability models in GIS: Safarood Basin, Iran. Catena, 97, 71–84. doi:10.1016/j.catena.2012.05.005 doi: 10.1016/j.catena.2012.05.005
- Pradhan, B., & Lee, S. (2009). Landslide risk analysis using artificial neural network model focusing on different training sites. International Journal of Physical Sciences, 4, 1–015.
- Soeters, R., & van Westen, C. J. (1996). Slope instability recognition, analysis, and zonation. In A. K. Turner & R. L. Schuster (Eds.), Landslides, investigation and mitigation (pp. 129–177). Washington, DC: National Academy Press.
- Süzen, M. L., & Doyuran, V. (2004). Data driven bivariate landslide susceptibility assessment using geographical information systems: a method and application to Asarsuyu catchment, Turkey. Engineering Geology, 71(3–4), 303–321. doi:10.1016/S0013-7952(03)00143-1 doi: 10.1016/S0013-7952(03)00143-1
- Thiebes, B., Bell, R., & Glade, T. (2007). Deterministic landslide susceptibility analysis using SINMAP – case study in the Swabian Alb Germany. In Geomorphology for the Future: Conference Proceedings (pp. 177–184). Obergurgl: ÖGC/IAG Working Group on Geomorphology.
- Tobler, W. (1970). A computer movie simulating urban growth in the Detroit region. Economic Geography, 46(2), 234–240. doi:10.2307/143141 doi: 10.2307/143141
- Tsagas, D. (2011). Geomorphological investigation and mass movements in northern Peloponnese: area of Xylokastro – Diakofto (Unpublished doctoral dissertation – in Greek). University of Athens: Athens, Greece.
- Van Westen, C. J., Rengers, N., & Soeters, R. (2003). Use of geomorphological information in indirect landslide susceptibility assessment. Natural Hazards, 30, 399–419. doi:10.1023/B:NHAZ.0000007097.42735.9e doi: 10.1023/B:NHAZ.0000007097.42735.9e
- Varnes, D. J. (1984). Landslide Hazard Zonation: a renew of principles and practice, Commission on Landslides of the IAEG, UNESCO, Natural Hazards, No 3. Paris: UNESCO.
- Vergari, F., Della Seta, M., Del Monte, M., Fredi, P., & Lupia Palmieri, E. (2011). Landslide susceptibility assessment in the Upper Orcia Valley (Southern Tuscany, Italy) through conditional analysis: A contribution to the unbiased selection of causal factors. Natural Hazards and Earth System Science, 11(5), 1475–1497. doi:10.5194/nhess-11-1475-2011 doi: 10.5194/nhess-11-1475-2011
- Wang, W. D., Xie, C. M., & Du, X. G. (2009). Landslides susceptibility mapping based on geographical information system, GuiZhou, south-west China. Environmental Geology, 58, 33–43. doi:10.1007/s00254-008-1488-5 doi: 10.1007/s00254-008-1488-5
- Windle, M. J. S., Rose, G. A., Devillers, R., & Fortin, M. J. (2010). Exploring spatial non-stationarity of fisheries survey data using geographically weighted regression (GWR): an example from the Northwest Atlantic. ICES Journal of Marine Science, 67, 145–154. doi:10.1093/icesjms/fsp224 doi: 10.1093/icesjms/fsp224
- Yalcin, A. (2008). GIS-based landslide susceptibility mapping using analytical process and bivariate statistics in Ardesen (Turkey): Comparisons of results and confirmations. Catena, 72, 1–12. doi:10.1016/j.catena.2007.01.003 doi: 10.1016/j.catena.2007.01.003
- Yesilnacar, E., & Topal, T. (2005). Landslide susceptibility mapping: A comparison of logistic regression and natural networks methods in a medium scale study, Hendek region (Turkey). Engineering Geology, 79(3–4), 251–266. doi:10.1016/j.enggeo.2005.02.002 doi: 10.1016/j.enggeo.2005.02.002