
 ?Mathematical formulae have been encoded as MathML and are displayed in this HTML version using MathJax in order to improve their display. Uncheck the box to turn MathJax off. This feature requires Javascript. Click on a formula to zoom.
ABSTRACT
The first soil map of the whole Aosta Valley Region was produced at the 1:100,000 scale. We used 691 soil profiles, attributed to 16 Cartographic (soil) Units, spatialized using a Maximum Likelihood Estimation model available in ArcGIS software. Six maps were used as base layers, representing the most important soil-forming factors: parent material, vegetation/land use, mean annual precipitation, elevation, absolute aspect and slope angle. The Maximum Likelihood Estimation was followed by an expert-based check that led to a re-assignment of some wrongly attributed cartographic polygons. The validation process revealed that the User’s and Producer’s Accuracies were rather high (between 47.5% and 84.4% for common soil types). A particularly high pedodiversity, associated to strong geological, vegetational and climatic gradients was observed.
1. Introduction
Soils are considered a limited and non-renewable resource that plays a crucial role for ecosystems and human life (CitationBaruck et al., 2016; CitationFAO, 2015). In fact, soils provide a huge amount of valuable ecosystem services (e.g. CitationBarrios, 2007), such as a vital substratum for biological communities, food and biomass production, regulating nutrient and water cycling, regulating climate at the local scale via evapotranspiration and at the global scale storing large amounts of organic carbon. Soils are part of the precious natural and cultural landscapes thus satisfying recreational needs. They also retain memory of the environmental conditions that contributed to their formation, thus providing scientific knowledge to humans, and acting as natural and historical archives (CitationGeitner et al., 2019). In particular, soils of mountain environments have the potential to generate a significant diversity and magnitude of ecosystem services that extend far beyond terrestrial support (CitationVargas et al., 2015). The preservation of mountain soils and their knowledge (e.g. soil type, physical and chemical properties, morphology, spatial distribution, etc.) is thus of paramount importance to ensure the provision of ecosystem services, representing a prerequisite of land planning and management. In this context, soil maps represent the fundamental basis for soil knowledge as well as a powerful tool for decision makers in the framework of land planning and management policies.
However, mapping soils in mountain areas can be a difficult task due to their high small-scale variability (CitationZanini et al., 2015) and the intrinsic complexity of mountain landscape (e.g. steepness, elevation, etc., CitationBaruck et al., 2016). In addition, soils in mountainous regions like the Alps are also highly vulnerable due to disturbances by intense natural processes (CitationHagedorn et al., 2010) and are also strongly influenced by ancient and current human activities (e.g. CitationFAO, 2015). Thus, Alpine soils are highly variable over short distances, leading to complex patterns of soil properties and humus forms (CitationHagedorn et al., 2010). Additionally, soil information in mountain regions, such as the Alps, is often sparse and not available (e.g. it is often not digitalized or included in unpublished project reports) for practitioners such as regional administrations, public bodies, but also farmers and professionals. Despite these difficulties, regional soil maps can be extremely useful for land management and planning. In particular, soil maps help in the identification of vulnerable areas to soil loss and soil degradation, and contribute to the knowledge of carbon stocks and climate change mitigation (CitationPereira et al., 2017). Examples of regional maps have been provided in Italy for a variety of scopes such as mapping and prevention (e.g. CitationLazzari et al., 2018; CitationPiana et al., 2017).
The work was carried out in the Aosta Valley Region, located in the north-western Italian Alps, where from 1990s to 2018 many soil sampling campaigns were carried out in the framework of several national and EU-projects. 691 profiles, scattered around the whole surface of the Aosta Valley Region, were used and inserted in a database for the soil map realization.
Within the project EU-Links4Soil, this work aims at providing the first systematic contribution to the knowledge of the soils of the Aosta Valley Region on a semi-detailed scale (1:100,000). This tool will be available to the research community and stakeholders (e.g. land use planners, decision makers, practitioners), and will be the basis for further insights at more detailed scale.
2. Methods
2.1. Environmental setting and base maps
The Aosta Valley Region is a rather small region (3,262 km2) located entirely in the NW Italian Alps (), between 321 and 4810 m a.s.l.; more than 80% of the surface lies above 1500 m a.s.l., and the total soil surface, including debris, talus and all loose materials, is about 78% of the area (CitationAmedei et al., 2009). The remaining land surface is covered by glaciers, rocky outcrops, lakes, urban areas and infrastructures, i.e. non-soil surfaces.
Figure 1. The Aosta Valley Region, in the NW Italian Alps.
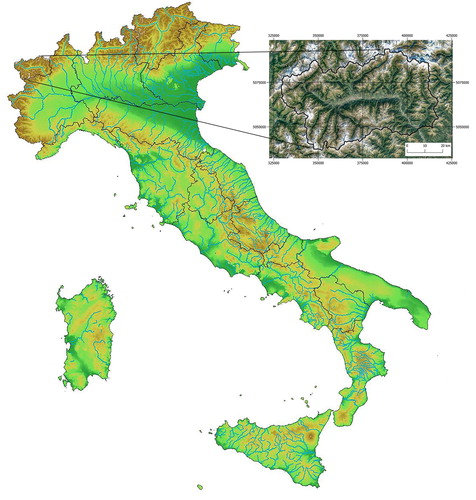
Most of the rock types found in the entire Alpine range are found in the region, where lithologies belonging to the African and European continental and oceanic plates coexist over a limited surface (CitationBonetto et al., 2010): in particular, sialic rocks (gneiss and micaschists) belonging to the African tectonic plate outcrop in the south-eastern sector; ultramafic (serpentinites), mafic (gabbros and amphibolites) and calcschists, belonging to the Piedmontese ophiolitic complex, cross the whole region from the south to the North-East, followed by sialic rocks, calcschists and flysch belonging to the European plate to the north-west. Glacial till and slope deposits cover wide areas. The climate of the region is mostly inner-alpine continental, with the exception of the south-eastern sector, influenced by humid air masses of Mediterranean origin, and the areas close to the western and northern borders, partially influenced by Atlantic western and north-western air masses. The average precipitation values (including snow-water equivalent, (b)) range between less than 500 and 2000 mm yr−1 (CitationMercalli, 2003); the central and western parts of the region, surrounded by high mountains on all sides, are dry (Ustic moisture regime, according to CitationSoil Survey Staff, 2014). The precipitation regimes change from east to west, with summer maxima in the eastern part, connected with warm and humid Mediterranean air masses, and winter maxima in the western parts (mostly falling as snow), connected with western and north-western Atlantic air flows.
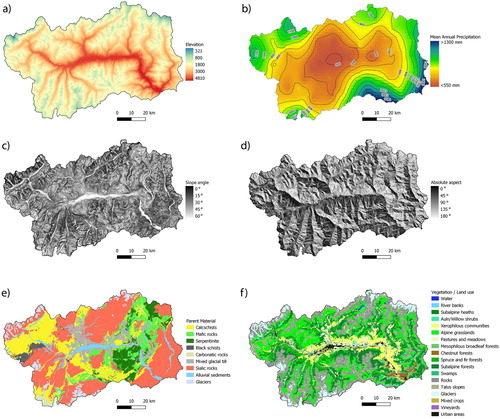
Figure 2. (a) Elevation map derived from the 10 m DEM of the Aosta Valley Region; (b) Mean Annual Precipitation (MAP); (c) slope angle; (d) Absolute Aspect; (e) Parent Material, reclassified from CitationBonetto et al. (2010); (f) vegetation/land cover maps, simplified from CitationAmedei et al. (2009).
The vegetation and land uses follow aspect, elevation and rainfall gradients; a high variety of ecosystems are thus found in the region (CitationAmedei et al., 2009).
Based on Jenny’s equation (CitationJenny, 1941), according to which:
six base maps have been used to spatialize soil types and properties () according to the soil-forming factors, with the exclusion of the factor ‘time'. Four of these maps represented continuous variables:
-
elevation, represented by the Digital Elevation Model (DEM, 10 m, available on webgis at https://mappe.regione.vda.it/pub/GeoNavSCT/index.html?repertorio=modelli, (a));
-
mean annual cumulated precipitation (including snow water equivalent, later on MAP), spatialized using kriging methods from 70 rain gauges scattered in the region belonging to the Centro Funzionale ((b));
-
slope angle, derived from the DEM ((c));
-
absolute aspect ((d)) derived from the DEM (10 m), which considers the SW slopes as the warmest, calculated according to the equation (CitationMcCune & Leon, 2002):
Two of the base maps were categorical:
-
the geological maps (scale 1:100,000; CitationBonetto et al., 2010, available on webgis at http://geologiavda.partout.it/GeologiaVDA/default/GeoCartaGeo. The geological map was simplified, associating rock types with similar effects on pedogenesis, while slope deposits were reclassified according to their lithological composition into 8 types (), obtaining a parent material (PM) map ((e));
-
the Nature Map (CitationAmedei et al., 2009, available at https://mappe.regione.vda.it/pub/GeoNavSCT/index.html?repertorio=Uso_Suolo), which has been reclassified as well, reducing the number of typologies to associate vegetation communities and land uses similarly associated to pedogenetic processes (, (f))).
Table 1. Parent material classification based on the 1:100,000 scale geological map; landslide and slope deposits and unclassified sediments have been reclassified according to their lithological composition and then attributed to the other existing categories.
Table 2. Land use/vegetation classification used for the production of the soil map.
Other commonly used layers (e.g. slope convexity) were tested but, as they did not influence the output, they were omitted in the finalized model.
A total of 691 soil profiles were stored in a database and used for spatialization of soil types after harmonization of field and laboratory data and classification according to WRB taxonomy (CitationIUSS Working Group WRB, 2015). These profiles were obtained from soil sampling campaigns performed between the 1990s and 2018. In particular, 333 soil profiles were obtained from several collaborations between Aosta Valley Region and the DISAFA – University of Turin, Italy, which resulted in many publications (i.e. CitationCurtaz et al., 2015; CitationD’Amico, Bonifacio et al., 2014; CitationD’Amico, Freppaz et al., 2014; CitationD’Amico, Freppaz et al., 2015; CitationD’Amico, Gorra et al., 2015; CitationPintaldi et al., 2016, Citation2018, Citation2019; CitationScalenghe et al., 2002; CitationStanchi et al., 2012, Citation2013, Citation2015) or from master theses under the supervision of DISAFA faculty members; 24 profiles were obtained from an ongoing project between the University of Milano Bicocca and Gran Paradiso National Park (dr. C. Canedoli and R. Comolli, unpublished); 18 profiles in vineyards were obtained from CitationMinelli (2008, available at Institute Agricole Regional, unpublished); 41 were opened in 1995–1997 by IPLA (Istituto per le Piante da Legno e l’Ambiente, unpublished); 130 derived from CitationD’Amico et al. (2008) and CitationD’Amico and Previtali (2012), located in Mont Avic Natural Park; 18 were produced in 2004 by Michele D’Amico for ARPA VDA (unpublished data) in the area between Pontey and Chambave. After collecting all the available soil data, during summer 2018, 138 additional profiles were opened to get further information in understudied areas of the region. All the used data are available at https://mappe.regione.vda.it/pub/geonavsct/?repertorio=SOIL_MAP.
An additional 25% of the total number of the profiles was discarded because it was impossible to harmonize data, mainly because of unsure environmental setting and parent material characterization, or because of missing parts in the description. Histosols (n = 22) were discarded from this phase as well, as they are strongly dependent on small-scale site conditions and thus cannot be mapped at the considered scale.
The 691 soil profiles were subdivided into 23 soil types, which in turn were partly associated and grouped into 16 Cartographic Units, according to pedogenic processes and similar ecological functioning ().
Table 3. Cartographic Units in the Aosta Valley soil map 1:100,000, and the most important environmental properties in which they can be found.
2.2. GIS mapping
The soil map of the Valle d’Aosta Region at the 1:100,000 scale (https://mappe.regione.vda.it/pub/geonavsct/?repertorio=SOIL_MAP) was elaborated using automatic GIS technique associated with expert-based knowledge of the Aosta Valley landscape, used to check the actual output of the GIS analysis. In particular, we used the Maximum Likelihood Estimation algorithm on ArcGIS 8.3, a technique that allows classifying every cell of a raster by calculating its probability density distribution, i.e. the probability that each pixel belongs to a specific class, i.e. the cartographic units-CUs (CitationCox & Wemuth, 1999), based on environmental data. Given 15 CUs (CU 11 – Hypocalcic Rhodic Cambisol was excluded as it was highly localized and not found in other areas of the region), the algorithm computes the probability for each cell of the raster map to belong to each of the classes (CUs), according to the input variables (PM, Luse, MAP, elevation, slope angle, absolute aspect), and assigns it to the most probable class, using variance and covariance matrices. This method is suitable to be applied to a combination of continuous (MAP, elevation, slope angle, absolute aspect), and discrete variables (CUs, PM, Luse) (CitationRoderick & Schluchter, 1985; CitationZare et al., 2018).
The resulting spatialization was then refined by using raster filtering techniques, merging isolated pixels and small patches (<10 hectares) with surrounding areas; additionally, the shape of the resulting patches was smoothed using PAEK (Polynomial Approximation with Exponential Kernel) geometric algorithms.
The obtained polygons were checked and visually reclassified, where the model produced unlikely soil types according to expert-based judgement. This often happened where all variables but geology were associated with specific soil types. A common example is represented by large areas on sialic parent materials in inner-alpine areas, under steppe-like grassland or steppic xerophilous forests: the model led to Calcisols (CU7), while this soil type was never found on sialic PM. These polygons were thus reclassified to UC 13 – Regosols; another common example is represented by polygons characterized by subalpine vegetation on calcschists, which at first were classified as Podzols (UC1, 2, 3) while in reality Podzols were almost never found on calcschists. The CU of these polygons was thus changed to UC12 – Dystric Cambisols.
A validation was performed by checking how well each soil profile belonging to the training data set fitted in the produced map. Additionally, 46 profiles from Valsavaranche and Val di Rhemes, in the central-southern sector of the Region (Università degli Studi di Milano Bicocca, unpublished data) and 18 from Lys Valley, in the SE sector (CitationZanini et al., 2007 and unpublished profiles dug during field trips with Forest Science students in 2017–2019), originally not included in the model building, were used to check the polygon classification error (validation data set). The User’s and the Producer’s accuracies were calculated for individual CUs and also for pedogenically associated CUs (i.e. ‘broadly correct’ in , such as profiles classified as Albic Podzol – CU1, included in Entic Podzol – CU2, or in Umbric Entic Podzols – CU3 polygons; or profiles classified as Kastanozems – UC6 included in Calcisols – CU7 polygons; or Umbrisols – CU9 included in Umbric Podzols – CU3 polygons). In particular, the User’s Accuracy shows how well the presence of specific CUs in the map indicates the presence of the same soil types on the ground, and it is calculated from the rows of the confusion matrix; the Producer’s Accuracy indicates how well the presence of CUs in the field is reflected in the output, i.e. if profiles attributed to each CU are in the correct polygons in the map (calculated from the column values in the confusion matrix, ). 50% accuracies are usually considered a good result (e.g. CitationAitkenhead & Coull, 2019).
3. Results and discussions
Twenty one Soil Types (ST) have been grouped into Sixteen Cartographic Units (CU), occupying a total of 3086 polygons (Main Map). Each is characterized by specific pedogenic processes leading to analogous soils types with similar relationships with ecosystems and land use. The main environmental properties and soil types characterizing the CUs are shown in and . A few CUs had rather few soil profiles as they were typical of specific and well characterized but little widespread environments (e.g. CU3, CU11, CU14, CU15 and CU16, ). Most of the CUs represent common zonal soils, derived from specific combinations of soil forming factors. Climate (the balance between precipitation and evapotranspiration) is one of the most important, influencing leaching or base and carbonate accumulation. CU 6, 7 and partly 8 can be only found in Ustic pedoclimatic regimes, where evapotranspiration exceeds MAP, thus favoring carbonate precipitation in Bk horizons and limiting leaching. CU1, 2, 3, 4, 9, 12 can be only found in Udic pedoclimatic regimes: in the inneralpine area, in fact, they are found at high elevations, where low temperatures limit evapotranspiration. CU 5, 10 and 11 are also found in inneralpine areas with Ustic pedoclimates, but on CaCO3-poor parent materials. CU3, 4, 5, 6, 9 are mostly developed under natural or anthropogenic grassland. CU 14 is locally found at the alpine belt, in areas exposed to winds and thus subjected to intense freeze-thaw cycles which cause cryoturbation (visible from solifluction or different types of patterned ground).
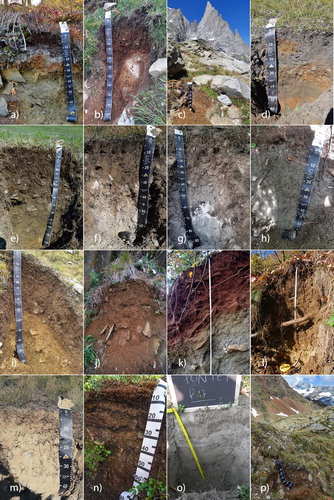
Figure 3. Examples of soil types belonging to the 16 CUs (). (a) CU1 – Albic Ortsteinic Podzol; (b) CU2 – Entic Ortsteinic Podzol; (c) CU3 – Umbric Entic Podzol; (d) CU4 – Protospodic Dystric Cambisol; (e) CU5 – Haplic Phaeozem; (f) CU6 – Calcic Kastanozem; (g) CU7 – Petric Calcisol; (h) CU8 – Calcaric Regosol; (i) CU9 – Cambic Umbrisol; (j) CU10 – Eutric Skeletic Cambisol; (k) CU11 – Hypocalcic Cambisol (Rhodic); (l) CU12 – Dystric Cambisol; (m) CU13 – Eutric Regosol; (n) CU14 – Turbic Regosol; (o) CU15 – Haplic Fluvisol (Arenic); (p) CU16 – Dystric Leptosol.
CU 16, 15 and 13 are azonal soils, developed respectively on steep rocky slopes, in alluvial areas and in eroded, disturbed areas such as talus slopes, proglacial areas, recent landslides. CU13 (Regosols) is also common in Ustic climatic regimes on sialic parent materials, where mineral weathering and the formation of thick A horizons are inhibited by the lack of a sufficient humidity.
CU11 can be considered a real soil endemism (CitationBockheim, 2004), localized on few square km on montane northward slopes in the eastern part of the Central Valley, between Fenis and Pontey, on serpentinite mixed with calcschists debris.
The validation procedure using the training data set () showed that the overall Producer’s Accuracy was 60.1%, while the overall User’s Accuracy was 55.3%. Considering the pedogenically associated CUs (e.g. Albic Podzols – CU1, Entic Podzols – CU2 and Umbric Podzols – CU3), the two accuracies increased to 78.4% and 75.6% respectively. The Producer’s Accuracies ranged between 15.3 and 100%; six values were below 50% (for CU2, CU9, CU10, CU12, CU15 and CU16). Azonal soils (CU15 and CU16) had the lowest Producer’s Accuracy values, as they were probably observed in small-scale disturbed slopes or alluvial plains included in other CU polygons.
Table 4. Confusion matrix for the training data set, showing the number of profiles included in polygons attributed to different CUs in the produced soil map.
The 21.7–76.3% of the training data set was correctly classified in the resulting map (User’s Accuracy); the values increased to 56.5–96.4% when considering associated soil types. Broadly correct attributions usually correspond to associated soil types in polygons. Five CUs had a User’s Accuracy below 50%: CU2, CU3, CU8, CU9, CU14. These CUs were based on a limited number of profiles, well characterized pedogenically and ecologically but difficult to be mapped at the 100,000 scale; CU9 had quite a high number of profiles, but, as it is usually developed under grassland and pastures at the subalpine altitudinal belt, which were weakly spatialized at the considered scale (CU9), it had a rather low accuracy. Azonal soils, located in disturbed locations such as landslides or eroded surfaces, or on small particularly steep or flat areas, such as Regosols and Fluvisols, were sometimes included in different CUs for scale reasons as well.
In the validation data set, the overall Producer’s Accuracy was 61.5%, while the overall User’s Accuracy was 65.6% (). Considering the pedogenically associated CUs, the two overall accuracies increased to 81.0% and 75.0% respectively. The 18 samples in the Lys Valley (SE sector), in particular, were all correctly classified in the map (100% accuracy). The User’s Accuracy in the dataset from Valsavarenche and Val di Rhemes (Central sector of the Region) was 52.8%, ranging between 33.3 and 100%, while the Producer’s Accuracy was on average 46.8%, ranging between 0 and 100%. Considering ‘broadly correctly' attributed soils (associating CUs by related pedogenic processes), the User’s and Producer’s Accuracies increased to an average of 65.2% and 62.1% respectively. 12.8% of the profiles in these valleys were wrongly classified, while 27.7% were instead azonal soils located in geomorphically disturbed locations, impossible to map at the 100,000 scale. The higher level of inaccuracy in these valleys is related to the complexity of the geology, as mafic amphibolites are often intermixed with calcschists or even gneiss, creating very different soil types over small scales, particularly in ustic soil climatic regimes which limit weathering and carbonate and base leaching which would lead to a homogenization of soil types.
Overall, ca. 13.4% of the profiles were wrongly attributed, i.e. the polygons in which they were located were attributed to CUs genetically and ecologically unrelated to the actual soil profiles (e.g. Kastanozem instead of Dystric Cambisol). The accuracy of the produced map can be considered, thus, successful, particularly considering the extreme variability of mountain soils across small scales (CitationBaruck et al., 2016).
Soils that occur less commonly tend to low User’s Accuracies but high Producer's Accuracies. This indicates that their occurrence in the Aosta Valley can be often overestimated. In order to reduce the uncertainty of certain CUs, more soil profiles would be necessary in the small areas in which those soils are common.
4. Conclusions
The new Soil Map of Aosta Valley (1:100,000) shows the main soil types distribution in a complex alpine region, where large elevation, geological, vegetational and climatic gradients exist over just few km. The 16 mapped CUs show very different soil types, which, on a global scale, correspond to soils typically found across a wide range of biomes, ranging from the deserts (CU7) and the steppes (CU6), to the temperate forests (CU10, CU12) and grasslands (CU5), to the humid boreal forests (CU1, 2, 3) and grasslands (CU9), to the tundra (CU4) and the cold desert Arctic areas (CU14). The maps derived from the information included in this soil map will be of great help in land planning at a regional scale, that will benefit soil practitioners and land planners.
The method used (automatic GIS analysis – Maximum Likelihood Estimation together with expert based control of the GIS output) proved to be rather effective in obtaining an accurate output, considering the high complexity of mountain soils.
Software
The GIS elaboration and the map production were performed using Esri ArcGIS 9.3. The used map projection was the Universal Transverse Mercator WGS84 fuse 32N (EPSG 32632).
Main Map.pdf
Download PDF (120.4 MB)Acknowledgements
This work was co-financed by the European Regional Development Fund in Interreg Alpine Space project 518 Link4Soils (ASP399): Caring for Soils – Where Our Roots Grow (http://www.alpine519space.eu/projects/links4soils/en/home). The use of soil data was authorized by Regione Autonoma Valle d’Aosta (authorization N. 3712, 16/04/2020).
Disclosure statement
No potential conflict of interest was reported by the author(s).
Additional information
Funding
References
- Aitkenhead, M. J. , & Coull, M. C. (2019). Digital mapping of soil ecosystem services in Scotland using neural networks and relationship modelling – Part 1: Mapping of soil classes. Soil Use and Management , 35 (2), 205–216. https://doi.org/10.1111/sum.12492
- Amedei, M. , Angelini, P. , Cremonese, E. , di Cella U., M. , Pari, E. , & Siniscalco, C. (2009). Carta degli Habitat. Regione Valle d’Aosta . ISPRA, Dipartimento Difesa della Natura, Servizione Carta della Natura.
- Barrios, E. (2007). Soil biota, ecosystem services and land productivity. Ecological Economics , 64 (2), 269–285. https://doi.org/10.1016/j.ecolecon.2007.03.004
- Baruck, J. , Nestroy, O. , Sartori, G. , Baize, D. , Traidl, R. , Vrščaj, B. , Bräm, E. , Gruber, F. E. , Heinrich, K. , & Geitner, C. (2016). Soil classification and mapping in the Alps: The current state and future challenges. Geoderma , 264 (B), 312–331. https://doi.org/10.1016/j.geoderma.2015.08.005
- Bockheim, J. G. (2004). Soil endemism and its relation to soil formation theory. Geoderma , 129 (3-4), 109–124. https://doi.org/10.1016/j.geoderma.2004.12.044
- Bonetto, F. , Dal Piaz, G. V. , De Giusti, F. , Massironi, M. , Monopoli, B. , & Schiavo, A. (2010). Carta geologica della Valle d’Aosta al 1:100000 con note illustrative. Regione Aut. Valle d’Aosta, Ass. Territorio Ambiente OOPP. http://geologiavda.partout.it/GeologiaVDA/default/GeoCartaGeo
- Cox, D. R. , & Wermuth, N. (1999). Likelihood factorizations for mixed discrete and continuous variables. Scandinavian Journal of Statistics , 26 (2), 209–220. https://doi.org/10.1111/1467-9469.00145
- Curtaz, F. , Stanchi, S. , D’Amico, M. E. , Filippa, G. , Zanini, E. , & Freppaz, M. (2015). Soil evolution after land-reshaping in mountains areas (Aosta Valley, NW Italy). Agriculture, Ecosystem and Environment , 119 , 238–248. https://doi.org/10.1016/j.agee.2014.09.013
- D’Amico, M. E. , Bonifacio, E. , & Zanini, E. (2014). Relationships between serpentine soils and vegetation in a xeric inner-alpine environment. Plant and Soil , 376 (1-2), 111–128. https://doi.org/10.1007/s11104-013-1971-y
- D’Amico, M. E. , Freppaz, M. , Filippa, G. , & Zanini, E. (2014). Vegetation influence on soil formation rate in a proglacial chronosequence (Lys Glacier, NW Italian Alps). Catena , 113 , 122–137. https://doi.org/10.1016/j.catena.2013.10.001
- D’Amico, M. E. , Freppaz, M. , Leonelli, G. , Bonifacio, E. , & Zanini, E. (2015). Early stages of soil development on serpentinite: The proglacial area of the Verra Grande Glacier, western Italian Alps. Journal of Soils and Sediments , 15 (6), 1292–1310. https://doi.org/10.1007/s11368-014-0893-5
- D’Amico, M. E. , Gorra, R. , & Freppaz, M. (2015). Small-scale variability of soil properties and soil–vegetation relationships in patterned ground on different lithologies (NW Italian Alps). Catena , 135 , 47–58. https://doi.org/10.1016/j.catena.2015.07.005
- D’Amico, M. E. , Julitta, F. , Previtali, F. , & Cantelli, D. (2008). Podzolization over ophiolitic materials in the western Alps (Natural Park of Mont Avic, Aosta Valley, Italy). Geoderma , 146 (1-2), 129–137. https://doi.org/10.1016/j.geoderma.2008.05.025
- D’Amico, M. E. , & Previtali, F. (2012). Edaphic influences of ophiolitic substrates on vegetation in the western Italian Alps. Plant and Soil , 351 (1-2), 73–95. https://doi.org/10.1007/s11104-011-0932-6
- FAO (2015). Understanding mountain soils. A contribution from mountain areas to the International Year of Soils 2015 . Food and Agriculture Organization of the United Nations.
- Geitner, C. , Freppaz, M. , Lesjak, J. , Schaber, E. , Stanchi, S. , D’Amico, M. E. , & Vrščaj, B. (2019). Soil ecosystem services in the Alps. An introduction for decision-makers . Agricultural Institute of Slovenia.
- Hagedorn, F. , Mulder, J. , & Jandl, R. (2010). Mountain soils under a changing climate and landuse. Biogeochemistry , 97 (1), 1–5. https://doi.org/10.1007/s10533-009-9386-9
- IUSS Working Group WRB . (2015). World Reference Base for Soil Resources 2014, Update 2015. International Soil Classification System for Naming Soils and Creating Legends for Soil Maps. World Soil Resources Reports No. 106: FAO.
- Jenny, H. (1941). Factors of soil formation . Dover Publications.
- Lazzari, M. , Gioia, D. , & Anzidei, B. (2018). Landslide inventory of the Basilicata region (Southern Italy). Journal of Maps , 14 (2), 348–356. https://doi.org/10.1080/17445647.2018.1475309
- McCune, B. , & Leon, D. (2002). Equations for potential annual direct incident radiation and heat load. Journal of Vegetation Science , 13 (4), 603–606. https://doi.org/10.1111/j.1654-1103.2002.tb02087.x
- Mercalli, L. (2003). Atlante climatico della Valle d'Aosta . Subalpina, Torino : Società Meteorologica
- Minelli, R. (2008). Zonazione viticola della DOC Valle d'Aosta. Descrizione dei profili di riferimento. Institute Agricol Régional, unpublished.
- Pereira, P. , Brevik, E. C. , Muñoz-Rojas, N. , Miller, B. A. , Smetanova, A. , Depellegrin, D. , Misiune, I. , Nivara, A. , & Cerdà, A. (2017). Chapter 2 – Soil mapping and processes modeling for sustainable land managemente. In P. Pereira (Ed.), Soil mapping and process modeling for sustainable land use management (pp. 29–60). Elsevier.
- Piana, F. , Fioraso, G. , Irace, A. , Mosca d’Atri, P. A. , Barale, L. , Falletti, P. , Monegato, G. , Morelli, M. , Tallone, S. , & Vigna, B. (2017). Geology of Piemonte region (NW Italy, Alps – Apennines interference zone). Journal of Maps , 13 (2), 395–405. https://doi.org/10.1080/17445647.2017.1316218
- Pintaldi, E. , D’Amico, M. E. , Siniscalco, C. , Cremonese, E. , Celi, L. , Filippa, G. , Prati, M. , & Freppaz, M. (2016). Hummocks affect soil properties and soil-vegetation relationships in a subalpine grassland (North-Western Italian Alps). Catena , 145 , 214–226. https://doi.org/10.1016/j.catena.2016.06.014
- Pintaldi, E. , D’Amico, M. E. , Stanchi, S. , Catoni, M. , Freppaz, M. , & Bonifacio, E. (2018). Humus forms affect soil susceptibility to water erosion in the Western Italian Alps. Applied Soil Ecology , 123 , 478–483. https://doi.org/10.1016/j.apsoil.2017.04.007
- Pintaldi, E. , Viglietti, D. , D’Amico, M. E. , Magnani, A. , & Freppaz, M. (2019). Abiotic Parameters and pedogenesis as controlling factors for soil C and N cycling along an elevational gradient in a Subalpine Larch Forest (NW Italy). Forests , 2019 (10), 614. https://doi.org/10.3390/f10080614
- Roderick, J. A. L. , & Schluchter, M. D. (1985). Maximum likelihood estimation for mixed continuous and categorical data with missing values. Biometrika , 72 (3), 497–512. https://doi.org/10.2307/2336722
- Scalenghe, R. , Bonifacio, E. , Celi, L. , Ugolini, F. , & Zanini, E. (2002). Pedogenesis in disturbed alpine soils (NW Italy). Geoderma , 109 (3-4), 207–224. https://doi.org/10.1016/S0016-7061(02)00176-3
- Soil Survey Staff . (2014). Keys to soil taxonomy (12th ed.). USDA-Natural Resources Conservation Service.
- Stanchi, S. , D’Amico, M. E. , Zanini, E. , & Freppaz, M. (2015). Liquid and plastic limits of mountain soils as a function of the soil and horizon type. Catena , 135 , 114–121. https://doi.org/10.1016/j.catena.2015.07.021
- Stanchi, S. , Freppaz, M. , Godone, D. , & Zanini, E. (2013). Assessing the susceptibility of alpine soils to erosion using soil physical and site indicators. Soil Use and Management , 29 (4), 586–596. https://doi.org/10.1111/sum.12063
- Stanchi, S. , Freppaz, M. , & Zanini, E. (2012). The influence of alpine soil properties on shallow movement hazards, investigated through factor analysis. Natural Hazards and Earth System Sciences , 12 (6), 1845–1854. https://doi.org/10.5194/nhess-12-1845-2012
- Vargas, R. , Castro, A. , & Ziadat, F. (2015). Mountain soils and ecosystem services. FAO, Understanding Mountain Soils, 7–9.
- Zanini, E. , Freppaz, M. , Filippa, G. , Celi, L. , Oberto, E. , & Caimi, A. (2007). Studio dei trend evolutivi dei suoli nativi della Riserva Naturale del Mont Mars (Comune di Fontainemore) come riferimento del pedo-dinamismo del piano montano della bassa Valle d’Aosta. Relazione finale, Riserva Naturale del Mont Mars.
- Zanini, E. , Freppaz, M. , Stanchi, S. , Bonifacio, E. , & Egli, M. (2015). Soil variability in mountain areas . In R. Romeo , A. Vita , S. Manuelli , E. Zanini , M. Freppaz , & S. Stanchi (Eds.) , Understanding mountain soils: A contribution from mountain areas to the International Year of soils 2015 (pp. 60–62). FAO.
- Zare, E. , Ahmed, M. , Malik, R. , Subasinghe, R. , Huang, J. , & Triantafilis, J. (2018). Comparing traditional and digital soil mapping at a district scale using residual maximum likelihood analysis. Soil Research , 56 . https://doi.org/10.1071/SR17220