
ABSTRACT
The Clarion Clipperton Zone (CCZ) hosts the most valuable deposit of polymetallic nodules yet discovered. International Seabed Authority exploration contractors, such as Tonga Offshore Mining Limited, Nauru Ocean Resources Incorporated and Marawa Research and Exploration Limited, routinely conduct ship-based 12 kHz multibeam echosounder surveys over all or parts of their exploration contract areas. This is often supported by physical seabed samples, side-scan sonar, sub-bottom profile sonar and seabed photographs. Geological maps for seven discrete mapped areas are presented. Basaltic abyssal plains of mid-Eocene to early Miocene age are overlain by 75–100 m of mid-Eocene and younger deep-sea chalks of the Marquesas Oceanic Formation. In turn, the chalk is overlain by up to 27 m of early Miocene to present, often mobile, siliceous clay-ooze sediment of the Clipperton Oceanic Formation. This stratigraphy is crosscut by a very wide variety of mostly volcanic magmatic rock units.
1. Introduction
The CCZ hosts a major seabed deposit of polymetallic nodules located between the Clarion and Clipperton fracture zones in the tropical north Pacific (CitationHorn et al., 1973; CitationInternational Seabed Authority, 2010b; CitationLipton et al., 2016). Polymetallic (also called ferro-manganese) nodules are found in all of the world’s oceanic basins at the seabed surface, however, the nodules in the CCZ have consistently high metal grades, particularly of nickel, cobalt, copper and manganese. This is thought to result from significant metal supply via net bio-carbonate/silicate export from the sea-surface; critical metal release near the seabed via a combination of water depth relative to the lysocline; and distance from continental land masses meaning an absence of competitor detrital sediments (CitationInternational Seabed Authority, 2010a; CitationLipton et al., 2016; CitationMorgan, 2003). In the CCZ, the nodules are found at the seabed surface in a very soft sediment – seawater mix termed as the semi-liquid layer or geochemically active layer (CitationBender et al., 1966; CitationCallender & Bowser, 1980). Biological material provides trace metals in a reduced state that can be oxidised and adsorbed into the open structures of the slowly precipitating phyllomanganate minerals within nodules.
States parties to the United Nations Convention on the Law of the Sea can sponsor public or private groups or enterprises, that may apply to the International Seabed Authority (ISA) for approval of plans of work for exploration for minerals resources (such as polymetallic nodules) in the area, which corresponds to the ocean floor and subsoil thereof, beyond the limits of national jurisdiction (International Seabed Authority, Citation2001). In an early-stage exploration of their contract areas, the contractors typically employ 12 kHz multibeam echosounder (MBES) to get high-resolution bathymetric data (CitationDeWolfe & Ling, 2018; CitationGlobal Sea Mineral Resources, 2018; CitationInteroceanmetal Joint Organization, 2014; CitationLipton et al., 2016; CitationRuhlemann et al., 2011). The digital datasets generated in a MBES survey are readily manipulated in classification schema, usually with the intent to elucidate seabed geology, geomorphology and marine habitats (CitationFrejer et al., 2021; CitationLipton et al., 2016). However, extensive classical surface geological interpretation is not known to have been published from the CCZ.
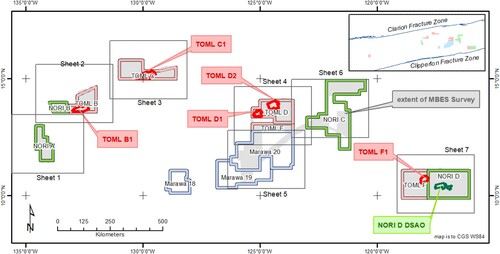
Combining the MBES datasets from three ISA exploration contractors, Tonga Offshore Mining Limited (TOML), Nauru Ocean Resources Incorporated (NORI) and Marawa Research and Exploration Limited (Marawa), allows for a wide range of CCZ areas to be mapped, both in terms of location in the central and eastern CCZ and in terms of geological composition (). These contractors have also conducted some sampling, side-scan sonar, sub-bottom profile and seabed photography surveying that provides additional data to support the geological interpretation of the MBES data. The resultant 1:250,000 geological map sheets comprise the main maps presented here.
Figure 1. Survey areas, sub-areas and 1:250 K map sheets. NORI stands for Nauru Ocean Resources Incorporated; TOML for Tonga Offshore Mining Limited; Marawa for Marawa Research and Exploration Limited.
As geological domaining is an essential part of both mineral resource and mineral reserve estimation, and as geological setting may play a role in ecosystem makeup, the results of the mapping are expected to be of interest to a range of stakeholders.
2. Methods
Collected data extents are summarised in . The datasets cover parts of the abovementioned exploration contract subareas and so are discontinuous.
2.1. Multibeam echosounder data
The maps here are based foremost on 12 kHz Multibeam echosounder data (MBES). The MBES data was collected using a gondola mounted Kongsberg EM120 on the R/V Mt Mitchell, during oceanographic campaign in 2012 and 2013. The system is notionally capable of operation in up to 11,000 m water depth (CitationKongsberg, 2005), and has 2°×2° angular resolution, yielding seafloor sounding resolution on the order of 3.5% of oblique range. During the 2013 expedition data from ca. 4500 m water depth were processed into grids with lateral resolutions of 60 and 30 m for bathymetry and backscatter respectively. Within the two survey programmes this equated to a line spacing of about 12 km to ensure complete coverage.
Three main Multibeam products were used in the interpretation:
Bathymetric images served to define the extents of volcanic rocks, basins and rises as well as the abyssal hills and valleys and collapse potholes. While the backscatter could well discriminate volcanic rocks and limits of nodule bearing sediment units, the bathymetry often provided more accurate locations for contacts.
Bathymetric slope and slope aspect grids emphasised steeper slopes (≥6°) and helped discover collapse potholes and the more subtle volcanic mounds.
Backscatter grids and images served to define areas with higher and lower potential for higher abundance and sediment cover as well as to discriminate volcanic rock types and exposed geology in most steeply sloping areas.
Normally during the process of interpretation, it proved the best alternate between bathymetry and backscatter backdrops, but draping of backscatter onto bathymetry was also often useful.
2.2. Other data
Definition of the mapped units was supported by other, more spatially limited data, that helped to characterise the units. Data systems and collection are described in more detail in (CitationLipton et al., 2016, Citation2021) and involve:
boxcore and dredge sampling;
towed and AUV mounted side-scan sonar;
towed and AUV mounted sub-bottom profiling; and
towed and AUV mounted seabed photography.
3. Results
The interpretation results in seven 1:250,000 scale maps which are described further below from west to east. While each area has distinctly different geology, the defined units are listed in , and they can be readily compiled into a common basic stratigraphy (summarised in ), namely:
Basement is oceanic crust comprising basalts of mid-Eocene to early Miocene age formed by extension at mid-ocean ridges with resultant extensional faulting into abyssal hill/plains, often displaying with long sub-parallel fault scarps/slopes.
This is overlain by 75–100 m of mid-Eocene to recent deep-sea chalks of the Marquesas Oceanic Formation (CitationTracey et al., 1971) that formed when the seafloor was located immediately to the southeast on the equatorial ‘mega-mound’ (CitationPälike et al., 2014). On some abyssal hills the chalks can form potholes (), and in some valleys carbonate strata breccias () which can be in breakthrough and stratabound forms much like caves on land (CitationLoucks, 1999; CitationOhle, 1985).
In turn, the chalk is overlain by up to 27 m of early Miocene to present, often mobile (), siliceous clay-ooze sediment of the Clipperton Oceanic Formation (CitationTracey et al., 1971). This change in sediment type is the result of the seafloor moving below the calcite lysocline (CitationLipton et al., 2016) due to seafloor spreading and/or long-term climate change.
This stratigraphy is unconformable or crosscut by a very wide variety of magmatic rock units, including knolls (), seamounts, dykes and sills ().
Figure 2. Deposit scale survey areas (a) basement ages and (b) extrapolated stratigraphy. Green isochrons at left are from CitationBarckhausen et al. (2013), while the brown isochrons are from CitationMüller et al. (2016) DSDP site 159 information is from Citationvan Andel et al. (1973a), site 160 from Citationvan Andel et al. (1973b) and migration estimates based on the work of Citationvan Andel et al. (1975).
An illustrative map and comparative section of the age of seabed and the types and ages of sediment in each area as deduced from nearby drill-holes.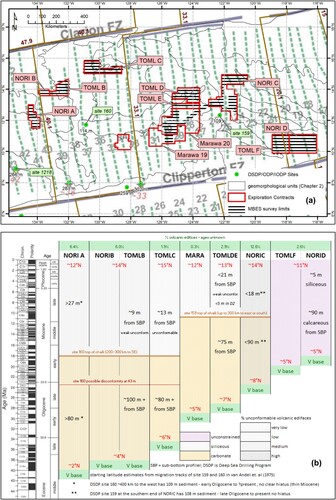
Figure 3. Example potholes. (a) Circular and ‘trough’ shaped features in Sheet 1, (b) potholes grading to escarpments in western Sheet 2, (c) line of potholes associated with a dyke off the volcanic edifice to the NW in eastern Sheet 2, (d) association of potholes only with a wider hill in Sheet 3, (e) smaller potholes in Sheet 4D, (f) potholes amongst artefacts in the bathymetry in western Sheet 7.
Example images of multibeam bathymetry with pot-hole formations circled.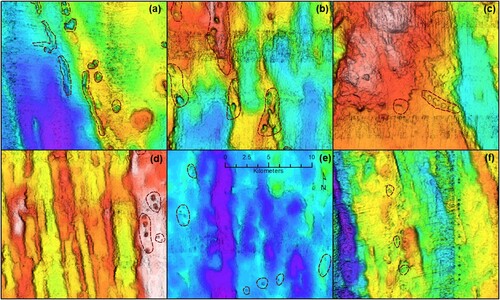
Figure 4. Example Carbonate Strata Breccia in sub-bottom profile (SBP) data. (a) Breakthrough type carbonate strata breccia (CSB) bounded by a large dyke in map sheet 2; (b) breakthrough CSB transitioning to a stratabound CSB in map sheet 3; (c) stratabound CSB in centre and breakthrough CSB’s nearer to the valley margin in map sheet 2; (d) small stratabound CSB in map sheet 4.
Sub-bottom sonar profiles from different parts of the mapped areas showing calcic-sedimentary and volcanic features of interest.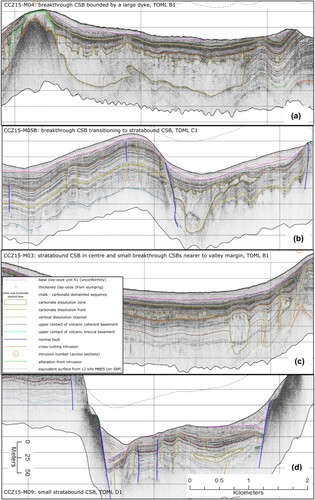
Figure 5. Example variable clay-ooze map in SBP data. SBP line is CCZ15-M08, in sheet 4. Clay-ooze of the Clipperton formation is above the pink dashed line.
Sub-bottom sonar profile from one part of the mapped areas showing siliceous-sedimentary features of interest.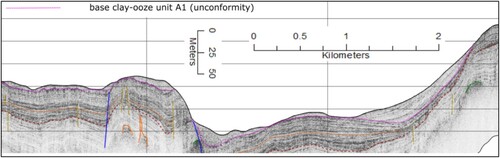
Figure 6. Example knolls and seamount on MBES. (a) Carbonate capped ‘pancake’ mound, sheet 1; (b) low backscatter reflectance knolls, sheet 2; (c) composite knolls, sheet 2; (d) coherent-lava seamount, sheet 4; (e) knolls aligned along a depression, sheet 3; (f) knoll split across an abyssal ‘valley’.
Example images of multibeam bathymetry and backscatter responses for a variety of different volcanic units.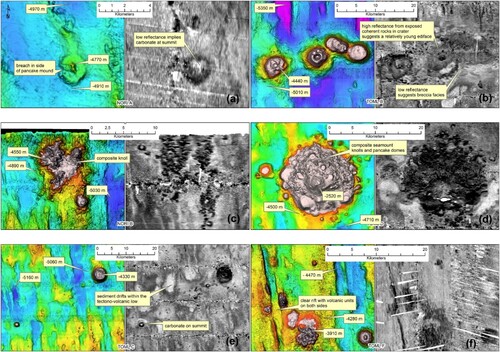
Figure 7. Example intrusions in SBP data. (a) Dyke swarm (with hornfels); (b) and sill with feeders.
Sub-bottom sonar profiles from different parts of the mapped areas showing volcanic-intrusion features of interest.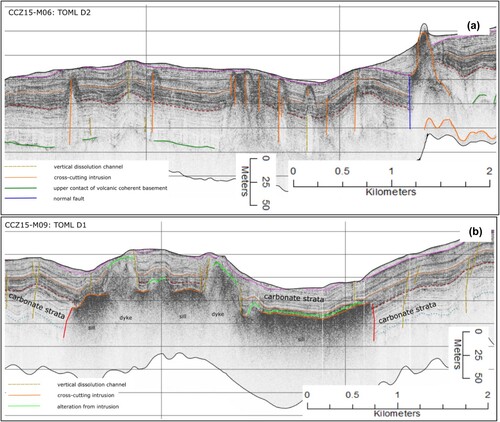
Table 1. MBES 1:250,000 interpretation – detailed legend.
The mapped units express as combinations of the above units and are described in more detail in .
3.1. Sheet 1 – NORI area A
Basement abyssal hills are well formed in the southern part of the area, but almost entirely absent in a flatter area in the north. Conversely, volcanic knolls are much more common in the north, indicating a higher geothermal gradient in this area. There is also extensive sediment cover on some of the knolls, including chalk, indicating that they are over 18 Ma in age (per change in sedimentation in ). The sediment thickness is likely to exceed 100 m based on the closest DSDP/ODP drill sites (located ca. 300 km to east and southwest; ). The chalks on the abyssal hills in the south contain potholes that in some cases form discontinuous chains over 10 km long ().
The northern flatter area also has extensive higher backscatter reflectance sediment (often only −20 to −23 dB), which is associated with larger and/or abundant polymetallic nodules (CitationKuhn & Rühlemann, 2021). A relationship between flatter areas and high backscatter related to nodules is supported by sampling and photo profiles and further supported by the fact that priority areas for exploration at TOML B1, TOML D2 TOML F1 and NORI DSAO are all located on such a setting.
3.2. Sheet 2 – NORI area B and TOML area B
In this area, the basal abyssal hills generally trend to 350° except for a secondary set at western TOML B. The hills to the north-east have generally higher and broader hills (5–10 km wavelength, 200–300 m amplitude) than to the west (1–5 km wavelength 100 m amplitude), and there is a topographic break at about 4990 mbsl between these areas with the north-eastern parts being slightly deeper.
Sediment thickness from SBP profiles in western TOML B is on average about 9 m of clay ooze over at least 100 m of chalk, although both units may be absent, and the clay-ooze locally thickened to over 30 m. This area also has distinctive sediment (clay-ooze) drifts, some of which are likely contourites. Shoaling carbonates are interpreted to be relatively common in both areas especially in association with the secondary abyssal hills and likely recent magmatic rocks (knolls, fissure lavas and dykes). Potholes and carbonate strata breccias are both relatively common ( and ).
The northern part of TOML Area B contains an unusual line of irregular volcanic knolls and composite knolls. These are V2 type units with relatively moderate backscatter values compared to normal volcanic knolls (, ).
3.3. Sheet 3 – TOML area C
In this area, the basal abyssal hills mirror image those in the Sheet 2 in that it is the western side that often has wider and more pronounced abyssal hills of about 5–15 km wavelength and 150–300 m amplitude while in the centre-east they narrow to 2–10 km wavelength for 100-150 m amplitude; There is a distinct topographic break at about 4970 mbsl. The western side also includes many more volcanic edifices, in part associated with ENE to NE striking areas of subdued abyssal hills and common hilltop areas with low backscatter interpreted to be shoaling carbonate ().
Potholes are common throughout Area C and may reflect a greater depth below the lysocline than for many of the other areas. Clay-ooze units with the high backscatter reflectance interpreted as high potential for nodule coverage are uncommon.
3.4. Sheet 4 – TOML areas D and E
Abyssal hills occur through the area (5–10 km wavelength, 100–300 m amplitude; trending 350–360°), and this area’s deeper valley-‘troughs’ (ca. 400 m amplitude) are found in several places. There is a small area of secondary slopes in the centre-eastern part of the area near the tectono-volcanic features within northeast Marawa 19.20 and southwest NORI C. A broad 20 km wide ‘plateau’ comprises the so called TOML D2 priority area (see below), above 4550 mbsl.
SBP profiles from TOML D1 and D2 (below) images ca. 80 m interpreted as chalk found on the basement basalts, the thickness of clay ooze varying widely. Both TOML D and E have very well-defined sediment drifts within some of the abyssal valleys, with a suggestion in TOML D that stripping of clay-ooze from TOML D2 may have been re-deposited in at the base of the plateau to the south. Off that plateau, potholes are common, but carbonate strata breccias are not well defined on or off the plateau. Higher than normal re-deposition of sediment may also be supported by the fact that the nodules in TOML D1 and D2 have much higher rates of cover than any of the other TOML and NORI areas photographed.
Volcanic edifices such as knolls and fissure lavas are found throughout the area, but are most common on the eastern side of the area. Dykes and sill are also much in evidence (). Located in the northeast the only true seamount within the TOML areas (informally named Mt Mo during the 2013 expedition; ) appears to be composed entirely of lava and rises almost 2000 m above the seafloor with slopes often reaching 20° and in some places 30°.
3.5. Sheet 5 – Marawa areas 19 and 20
In this area, abyssal hills almost entirely trend 350-355°, with minor secondary development across to 010° in the SW side of the survey area. Hill wavelengths are 2–10 km and amplitudes generally 100–200 m. Part of the central-southern part of the survey area is above a topographic break at about 4640 mbsl.
As there is no SBP data available, almost nothing is known about the sedimentary stratigraphy in this area, however the backscatter response is interpreted as resulting from an extensive clay-ooze cover with small nodules or small amounts of nodules. Discriminating any shoaling carbonate is thus really not possible. DSDP site 159 located over 150 km to the east but at similar latitudes () has 18 m of clay-ooze over 90 m of chalk (Citationvan Andel et al., 1973a). Potholes are common especially in the southern part of the survey area.
Volcanic edifices (knolls) are very rare within the survey area, increasing only towards the NE (and the NORIC area).
3.6. Sheet 6 – NORI area C
Much of the surveyed area within NORI C is ‘flatter areas’ with common volcanic edifices (ca. 13% of total or roughly double that of any other area). The remainder comprises variable abyssal hills (wavelengths are 1–10 km and amplitudes up to 400 m).
As for the Sheet 5 area, almost nothing is known about the sedimentary stratigraphy in this area. The backscatter response is interpreted as resulting from a fairly typical proportion of sediment drifts within the ‘normal’ abyssal hill areas. The abovementioned DSDP site 159 is located almost immediately to the south with 18 m of clay-ooze over 90 m of chalk. Potholes seem to be quite rare, most being among the abyssal hills in the SW corner of the survey area closest to TOML D and E.
Areas with very high backscatter reflectance (>−30 dB), interpreted to be nodule bearing, are common in the area especially in some of the flatter areas amongst the volcanic knolls as shown by (CitationKuhn & Rühlemann, 2021) this can be quite prospective in terms of nodule abundance.
Most of the volcanic edifices are single or composite knolls. They can be very significant in terms of size often exceeding 600 m and largest composite being over 32 km across and 1200 m higher (i.e. technically a seamount). In the NE corner is located complex of rifts, sills/laccoliths, sheet lavas and a seamount that are interpreted to represent the tip of a propagating seamount chain.
3.7. Sheet 7 – TOML area F and NORI area D
Both TOML F and NORI D have extensive areas of abyssal hills of 5–10 km wavelength, but in TOML F they generally tend to be of distinctly higher amplitude, 100–200 m, compared to 70–150 m in NORI D. Both areas include some flatter areas without many abyssal hills, but they are much more extensive in NORI D (e.g. NORI DSAO area in Sheet 7). A deep (450–500 m) graben in the SE corner of NORI D is associated with a change in abyssal hill direction and proximity to the Clipperton Fracture Zone. There are two topographic break levels, one at about 4290 mbsl and another at 4180 mbsl.
Sediment cover from AUV-SBP in the central NORI D area (see below) is interpreted as up to 23 m of clay ooze over about 70 m of chalk, although the clay-ooze can be locally absent. A generally lower level of backscatter reflectance in the southern and eastern parts of the area, is interpreted to reflect either a slightly higher level of carbonate in the clay-ooze or the influence of a near surface carbonate unit. This contact could be re-interpreted in a more gradational manner at a closer scale and perhaps with additional supporting data. Clay-ooze sediment drifts area often lying on the eastern sides of abyssal valleys. Shoaling carbonate is mapped on hill/ridge tops. Potholes are also rare in this area.
Volcanic edifices are mostly knolls that trend WNW and that are often associated with flatter areas. Several fissure lavas were mapped in TOML F, some look quite recent based on very high backscatter reflectance.
4. Conclusions
12 kHz ship-mounted MBES bathymetry and backscatter is the basis for mapping of a significant area of seabed (ca. 173,000 km2) in 7 discrete survey areas in the central and eastern CCZ. These areas span from 116° to 134.5° W (ca. 2000 km) and 10° to 16° N (ca. 700 km). This study helps to understand the geological character of the different survey areas. The areas are remarkably diverse considering they are all fundamentally composed of abyssal hills of volcanic basement and carbonate overlain by nodule bearing clay-ooze. This interpretation should be of interest to workers looking to develop and protect the nodules fields, as well as their regulators and sponsors.
Software
For the MBES data, sound velocity profiles were prepared using SVP Editor and system positioning using MB POSview. Calibration was done both in SIS and Caris HIPS and SIPS and survey data processed using the later software suite. Image processing was also done in Geosoft.
The map series was built up mostly from grid data in GIS (either ArcMap v10.4.1 for desktop or qGIS v3.10 depending on the processing being employed). The bulk of the compilation was conducted at 1:100,000 scale, varying to capture detail or context. All of the digitising for products in this chapter used a 27” 1920 × 1080p display. At 1:100,000 scale, 1 km on the map was about 1.2 cm on the screen. The map is assembled using a series of sequenced layers to improve flexibility in review and reduce the complexity associated with a single integrated polygonal product (for example the slopes layer comprises over 10,000 polygons). QGIS referred routines used included: Slope; SAGA Mesh Denoise; Aspect; Raster Calculator; Contour; Lines to polygons; Calculate Geometry; Add Geometry Attributes; Oriented Minimum Bounding Box; Zonal Statistics; and Terrain Ruggedness Index. Rose diagrams were prepared using GeoRose 0.5.1.
Figures were drafted either in ArcGIS 10.4.1, qGIS 3.10.7 or Inkscape 0.92.3.
Supplemental Material
Download Zip (80.2 MB)Acknowledgments
This research was completed by one of the authors (Parianos) while under the employment of Nautilus Minerals Pacific Pty Ltd. Deep Green Metals provided access to the data interpreted.
Disclosure statement
No potential conflict of interest was reported by the author(s).
Data availability statement
GIS data can be provided on written request to the authors.
Additional information
Funding
Related Research Data
References
- Barckhausen, U., Bagge, M., & Wilson, D. S. (2013). Seafloor spreading anomalies and crustal ages of the Clarion-Clipperton Zone. Marine Geophysical Research, 34(2), 79–88. https://doi.org/10.1007/s11001-013-9184-6
- Bender, M. L., Ku, T.-L., & Broecker, W. S. (1966). Manganese nodules: Their evolution. Science, 151(3708), 325–328. https://www.jstor.org/stable/1717209. https://doi.org/10.1126/science.151.3708.325
- Callender, E., & Bowser, C. J. (1980). Manganese and copper geochemistry of interstitial fluids from manganese nodule-rich pelagic sediments of the northeastern equatorial Pacific Ocean. American Journal of Science, 280(10), 1063–1096. https://doi.org/10.2475/ajs.280.10.1063
- DeWolfe, J., & Ling, P. (2018). NI 43-101 technical report for the NORI Clarion - Clipperton Zone Project, Pacific Ocean. Golder Associates Ltd. www.sedar.com
- Frejer, A., Cecino, G., & Flynn, A. (2021). Habitat mapping for ecosystem-based management of deep-Sea mining. Marine Technology Society Journal, 55(6), 53–64. https://doi.org/10.4031/MTSJ.55.6.4.
- Global Sea Mineral Resources. (2018). Environmental impact statement. DEME Group. https://www2.deme-group.com/sites/default/files/isa_eia_2018_gsrnod2019.pdf
- Horn, D. B., Delach, M. N., & Horn, B. (1973). Metal content of ferromanganese deposits of the oceans. Office for the International Decade of Ocean Exploration.
- International Seabed Authority. (2001). The Law of the Sea - compendium of basic documents. International Seabed Authority. https://www.isa.org.jm/files/documents/EN/Pubs/LOS/index.html
- International Seabed Authority. (2010a). A geological model of polymetallic nodule deposits in the Clarion-Clipperton Fracture Zone.
- International Seabed Authority. (2010b). A prospector’s guide for polymetallic nodule deposits in the Clarion-Clipperton Fracture Zone.
- Interoceanmetal Joint Organization. (2014). Activities of the IOM within the scope of geological exploration for polymetallic nodule resources. Workshop on Polymetallic Nodule Resources Classification. Kingston: International Seabed Authority. https://www.isa.org.jm/files/documents/EN/Workshops/2014a/IOM.pdf
- Kongsberg. (2005). 12 kHz multibeam echo sounder. Seabed mapping to full ocean depth. bodc.ac.uk/data/documents/nodb/pdf/kongsberg_em120_20jun2011.pdf.
- Kuhn, T., & Rühlemann, C. (2021). Exploration of polymetallic nodules and resource assessment: A case study from the German contract area in the Clarion-Clipperton Zone of the tropical northeast pacific. Minerals, 11(6), Article 618. https://doi.org/10.3390/min11060618
- Lipton, I., Nimmo, M., & Parianos, J. (2016). TOML Clarion Clipperton Zone project, Pacific Ocean. AMC Consultants Pty Ltd. www.sedar.com
- Lipton, I., Nimmo, M., & Stevenson, I. (2021). NORI area d Clarion Clipperton Zone mineral resource estimate - update. AMC Consultants Pty Ltd.
- Loucks, R. G. (1999). Paleocave carbonate reservoirs: Origins, burial-depth modifications, spatial complexity, and reservoir implications. AAPG Bulletin, 83(100), 1795–1834. https://doi.org/10.1306/E4FD426F-1732-11D7-8645000102C1865D
- Morgan, C. L. (2003). Proposed model data inputs. In Office of Resources and Environmental Monitoring. (Eds.), Geological Model of polymetallic nodule deposits in the Clarion-Clipperton Fracture Zone of the equatorial north Pacific Ocean (pp. 80–95). International Seabed Authority.
- Müller, R. D., Seton, M., Zahirovic, S., Williams, S. E., Matthews, K. J., Wright, N. M., Shephard, G. E., Maloney, K. T., Barnett-Moore, N., Hosseinpour, M., Bower, D. J., & Cannon, J. (2016). Ocean basin evolution and global-scale plate reorganization events since Pangea breakup. Annual Review of Earth and Planetary Sciences, 44(1), 107–138. https://doi.org/10.1146/annurev-earth-060115-012211
- Ohle, E. L. (1985). Breccias in Mississippi valley-type deposits. Economic Geology, 80(6), 1736–1752. https://doi.org/10.2113/gsecongeo.80.6.1736
- Pälike, H., Lyle, M. W., Nishi, H., & Raffi, I. (2014). The Pacific equatorial age transect. Developments in Marine Geology, 7, 329–357. https://doi.org/10.1016/B978-0-444-62617-2.00013-X
- Ruhlemann, C., et al. (2011). Current status of manganese nodule exploration in the German licence area. Proceedings of the Ninth ISOPE Ocean Mining Symposium Maui, Hawaii, International Society of Offshore and Polar Engineers, pp. 19–24.
- Tracey, J. I. J., Sutton, G. H., Nesteroff, W. D., Gatehouse, J., von der Borch, C. C., Moore, T. C., Z, U., Haq, B. u., & Beckmann, J. P. (1971). Leg VIII Summary. Initial Reports of the Deep Sea Drilling Project, 8, U.S. Government Printing Office. https://doi.org/10.2973/dsdp.proc.8.102.1971.
- van Andel, T. H., Heath, G. R., & Moore, T. C. (1975). Cenozoic history and paleoceanography of the central equatorial Pacific Ocean: A regional synthesis of Deep Sea Drilling Project data. Geological Society of America, 143, 1–223. https://doi.org/10.1130/MEM143-p1
- van Andel, T. H., Ross Heath, G., Bennett, R. H., David Bukry, J., Charleston, S., Cronan, D. S., Dinkelman, M. G., Kaneps, A. G., Rodolfo, K. S., & Yeats, R. S. (1973a). Site 159. Initial Reports of the Deep Sea Drilling Project, 16, U.S. Government Printing Office. https://doi.org/10.2973/dsdp.proc.16.106.1973.
- van Andel, T. H., Ross Heath, G., Bennett, R. H., David Bukry, J., Charleston, S., Cronan, D. S., Dinkelman, M. G., Kaneps, A. G., Rodolfo, K. S., & Yeats, R. S. (1973b). Site 160. Initial Reports of the Deep Sea Drilling Project, 16, U.S. Government Printing Office. https://doi.org/10.2973/dsdp.proc.16.107.1973.