
 ?Mathematical formulae have been encoded as MathML and are displayed in this HTML version using MathJax in order to improve their display. Uncheck the box to turn MathJax off. This feature requires Javascript. Click on a formula to zoom.
ABSTRACT
Ground motion modification over large areas is generally evaluated by focusing on source effects disregarding local lithostratigraphic site conditions. Hence, amplification maps of peak ground acceleration and peak ground velocity are proposed to improve the forecast of ground motion on a national scale. Topological information about litho-type successions and soil mechanical behaviour were retrieved from the Italian database of seismic microzonation and more than 30 million of seismic site response analyses were performed to quantify the amplification factors (i.e. the ratio between expected ground motion at the site of interest and that at the outcropping engineering bedrock). The maximum value of the amplified peak ground acceleration on the Italian territory results in about twice as much as the value expected at the outcropping of the engineering bedrock. Finally, damage scenario maps based on the amplified ground motion could be produced as a supporting tool for urban planning and emergency system management.
1. Introduction
Estimation of seismic ground motion over large areas (regional, national), aimed to support urban planning and seismic emergency system evaluation, is a non-trivial task (CitationBarani et al., Citation2020; CitationBrando et al., Citation2020; CitationFalcone et al., Citation2021; CitationShreyasvi et al., Citation2019). In fact, the modification of ground motion with respect to what is expected at the outcropping engineering bedrock (i.e. material characterised by shear wave velocity, VS, at least equal to 800 m/s and by flat ground surface) should be quantified based on detailed sub-soil models and numerical simulations of local seismic site response (CitationFalcone et al., Citation2020b, Citation2018; CitationMakra & Chávez-García, Citation2016; CitationMaufroy et al., Citation2015; CitationMoczo et al., Citation2018). The available amount of data, in general, does not allow to define sub-soil models consistent with the site conditions of the whole area of interest (CitationHuber et al., Citation2015; CitationMoscatelli et al., Citation2020a); moreover, it is a hard task to carry out numerical simulations of Local Seismic Site Response (LSSR) over large areas. Therefore, numerous works show maps of earthquake intensity based on simplified sub-soil models (i.e. defined according to key-mechanical and geometrical parameters, such as the mean shear wave velocity in the upper 30 m of the soil deposit, VS30) as, for example, shown by CitationFalcone et al. (Citation2020a) and CitationMichelini et al. (Citation2019). Forte and co-workers (CitationForte et al., Citation2019) provided a seismic classification of Italy based on the VS30 map presented in the same work. Such seismic classification has been proposed also in terms of peak ground acceleration, briefly PGA, both at ideal outcropping rock and considering the sub-soil condition (i.e. the VS30), where the amplification factors have been quantified according to the Italian Building Code (CitationItBC, Citation2018) depending on the so-called soil category. In a similar way, Falcone et al. (Citation2020a) provided a seismic classification of Italy. Instead, CitationMichelini et al. (Citation2019) presented seismic classification using ShakeMap workflow (the paper of Michelini and co-workers can unveil further insight on such ShakeMap workflow). Despite what is reported in CitationForte et al. (Citation2019) and CitationFalcone et al. (Citation2020a), in the present paper only amplification factors, AF (that is the ratio of the motion at the site of interest over that at the outcropping engineering bedrock) for PGA and peak ground velocity, PGV, are presented referring to 475 years return period. Moreover, such AF were derived by means of numerical simulations of seismic site response based on site-specific data from the national seismic microzonation database rather than based on CitationItBC (Citation2018) prescription or ShakeMap workflows. On the other hand, Italian seismic microzonation studies, based on numerical seismic site response analyses and site-specific sub-soil data, are carried out only over the urban area (CitationMoscatelli et al., Citation2020b) not providing homogeneous sub-soil information for the whole Italian territory.
Estimating ground motion is a key parameter for formulating damage scenarios. As a matter of fact, damage scenario maps or the seismic demand on buildings are generally proposed considering the ground motion at the outcropping engineering bedrock (e.g. CitationDolce et al., Citation2020; CitationFontana et al., Citation2020); ground motion modifications are not included in such kind of forecast, thus leading to a possible underestimation of the structures and infrastructures failures induced by an earthquake (CitationGraziani et al., Citation2019).
Bearing in mind that damage scenario maps are usually based on PGA and PGV and that point information on subsurface characteristics is unevenly distributed, the AFs for PGA and PGV based on the IGAG_20 workflow suggested by CitationFalcone et al. (Citation2021) are proposed in this study, aiming to support territorial planning and evaluation of the seismic emergency system. Italian territory was classified based on morpho-geological information according to the clustering reported in CitationMori et al. (Citation2020). Data archived in the Italian DataBase for Seismic Microzonation (DB-SM in CitationDPC, 2018), were collected to define sub-soil one-dimensional (1D) models with reference to 42 morpho-geological clusters. A set of 630 input motions were determined in agreement with the study proposed by the Italian Institute of Geophysics and Volcanology, INGV, for the 475 years return period (CitationMeletti & Montaldo, Citation2007; CitationMontaldo & Meletti, Citation2007). About 30 million numerical simulations of LSSR were performed adopting the linear equivalent approach in the frequency domain (CitationKottke et al., Citation2013; CitationKottke & Rathje, Citation2013; CitationKramer, Citation1996). A set of 126 AFPGA_PGV-VS30 correlations were obtained depending on the cluster and intensity of the input motion. Hence, the maps of AFPGA and AFPGV were obtained based on the Italian VS30 map proposed by CitationMori et al. (Citation2020).
Finally, the AFPGA_PGV maps were compared with the results based on numerical simulation of LSSR referred to detailed sub-soil 1D models to validate the IGAG_20 methodology.
2. IGAG_20 methodology
The IGAG_20 methodology, proposed by CitationFalcone et al. (Citation2021) with reference to AF defined in three intervals of periods, was adopted to obtain the AFPGA and AFPGV. The IGAG_20 main steps are described in the following.
Morpho-geological clustering of the Italian territory (CitationIwahashi et al., Citation2018; CitationMori et al., Citation2020) by means of the global terrain geomorphological classification based on normalised slope, local convexity, and surface texture (after CitationIwahashi et al., Citation2018). The morpho-geological clustering allows to spatialise both input (i.e. site investigations, primarily continuous boreholes, Down-hole and MASW) and output data (i.e. AF values) over large areas. Hence, reliable sub-soil models were defined even where site-specific data were not available.
Definition of detailed 1D sub-soil models. Site data (i.e. stratigraphic logs from continuous boreholes; mechanical properties from geophysical investigation and laboratory data) were retrieved from a large database: the Italian Civil Protection Department has made available the DB-SM (CitationDPC, 2018), where geological, geotechnical and geophysical data are archived (accessible at www.webms.it). About 2 million of 1D soil columns were identified and adopted for the numerical simulation of the LSSR. Each 1D soil column differs from others in terms of topological information (i.e. stratigraphic succession of lithotypes), in terms of VS-z gradient and in terms of depth to the engineering bedrock (HEB), that is the depth below which the harmonic mean of shear wave velocity is at least equal to 800 m/s.
A set of 630 response spectra (15 spectra multiplied by 42 morpho-geological clusters) in terms of pseudo-acceleration were determined according to the seismic hazard study made available by the INGV (CitationMeletti & Montaldo, Citation2007; CitationMontaldo & Meletti, Citation2007), accessible at http://esse1.mi.ingv.it/.
About 30 million numerical simulations of the LSSR were performed by means of an original numerical code, build up by the authors, adopting the linear equivalent approach in the frequency domain (CitationKottke et al., Citation2013; CitationKottke & Rathje, Citation2013; CitationKramer, Citation1996). With reference to each 1D soil column, the AFs were determined according to the following equations:
(1)
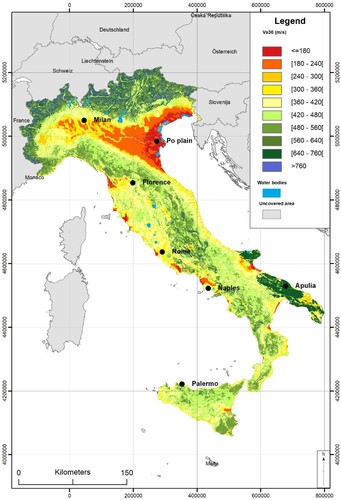
With reference to each of the 42 morpho-geological clusters and three intensity levels of the seismic input, the AFPGA-VS30 and AFPGV-VS30 correlations were estimated in terms of the 16°, 50°, and 84° percentiles from IGAG_20 results adopting the stepwise multiple quantile regression (CitationLiu & Wu, Citation2009). Therefore, the AF maps were determined by adopting such AFPGA-VS30 and AFPGV-VS30 correlations, the Italian reference seismic hazard maps available at http://esse1.mi.ingv.it/, and the Italian VS30 map, see , reported in CitationMori et al. (Citation2020). The authors are aware that VS30 should not be used as the unique soil parameter to describe seismic amplification (CitationLee & Trifunac, Citation2010; CitationZhu et al., Citation2020). Nevertheless, national maps of additional parameters such as the fundamental period of the deposit or depth to the seismic bedrock are not provided for large areas (e.g. entire Italy), at most for the regional area (CitationMartelli, Citation2021; CitationMascandola et al., Citation2019). However, the AF-VS30 correlations derived according to the IGAG_20 workflow are specific for each morpho-geological cluster, in turn, characterised by different sub-soil conditions (e.g. VS gradient with depth and depth to the seismic bedrock). In this way, the AF also includes the site-specific conditions even if quantified based on the only VS30 value.Italian map showing the distribution of the harmonic mean of the shear wave velocity in the upper 30 m of the soil, leading to recognize soft soil as in the case of the Po plain or stiff material as in the case of the rocky sub-flat areas of the Apulian block.
Figure 1. Italian map of VS30 (50° percentile) modified after CitationMori et al. (Citation2020). Po plain and Apulia, discussed in the text, are shown in the figure.
3. AFPGA and AFPGV maps
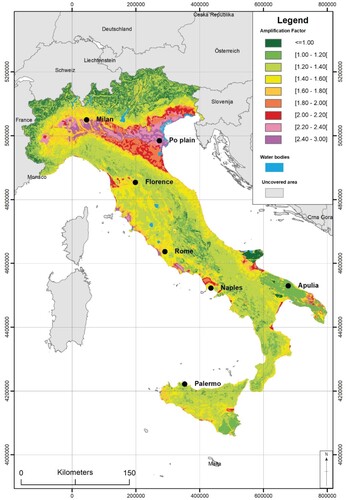
Following what is discussed in Section 2, the AFs were assigned to a regular 50 × 50-m grid. The AFPGA and AFPGV maps are shown in and , respectively, with reference to the only 50° percentile for sake of brevity (16° and 84° percentiles are reported as ). As a matter of fact, the proposed AFPGA and AFPGV maps depend on the morpho-geological cluster and intensity of the input motion expected at the outcropping engineering bedrock with reference to the return period of 475 years.
Figure 2. Italian map of AFPGA (50° percentile). Po plain and Apulia, discussed in the text, are shown in the figure.
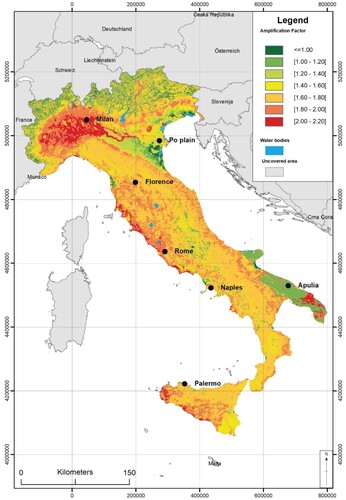
Figure 3. Italian map of AFPGV (50° percentile). Po plain and Apulia, discussed in the text, are shown in the figure.
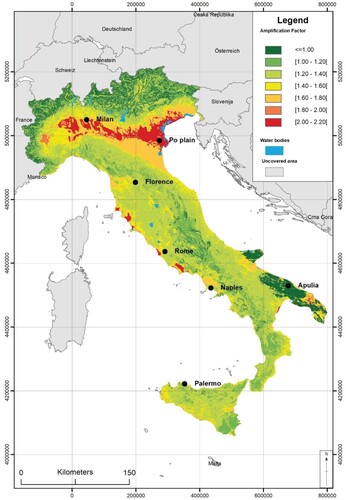
The main relationship between soil deposit properties and seismic performance of the deposit itself, in general, can be presented by means of the following key points (Gazetas, Citation1982; CitationKramer, Citation1996; Rollins et al., Citation1998, Citation2020; Seed & Idriss, Citation1970): (k1) assuming the VS constant with depth, the higher the depth to the engineering bedrock (HEB) the lower the fundamental frequency of the soil deposit (i.e. the higher the fundamental period), (k2) for a fixed value of the HEB, the higher the deposit VS the higher the fundamental frequency (i.e. the lower the fundamental period), (k3) for a specific deposit, the higher the intensity of the input motion the lower the AF due to the non-linear response of soils. Bearing in mind that AFPGA and AFPGV are related to amplification effects at very low and intermediate periods, respectively, the above-mentioned key points are included in the proposed maps. In fact, in the east side of the Po plain, where HEB > 100 m (the reader should refer to the work of CitationMascandola et al., Citation2019) and VS30 < 300 m/s, AFPGV is higher than AFPGA, while in the southern Apulia, where HEB < 30 m (CitationMori et al., Citation2020) and VS30 < 300 m/s, AFPGA is higher than AFPGV (i.e. accordingly to key-point k1). In addition, with reference to the southern part of Apulia, where the PGA of input motion is higher than 0.1 g (the reader should refer to the Italian reference seismic hazard available at http://esse1-gis.mi.ingv.it/) and HEB is lower than 30 m, the AFPGA of that part characterised by VS30 < 300 m/s is higher than the AFPGA in that part where VS30 is higher than 300 m/s (in agreement with key-point 2). Moreover, with reference to the eastern area of the Po plain characterised by VS30 < 300 m/s, the AFPGV (or AFPGA) in the northern part, where input PGA is lower than 0.1 g, is higher than the AFPGV (or AFPGA) in the southern part, where input PGA is higher than 0.1 g (i.e. in agreement to what reported at the key-point k3). Thus, in general, the lithostratigraphic effects related to the vertical heterogeneity of 1D soil column could highly increase the seismic demand on a structure or infrastructure at a site with respect to what expected in case of the outcropping engineering bedrock at the same site. As an example, in the southern Apulia, Salento area, the AFPGA () is the highest compared to the rest of Apulia well in agreement with the observed historical damage pattern referred to the 1743 earthquake (CitationGalli & Naso, Citation2008; CitationNappi et al., Citation2017).
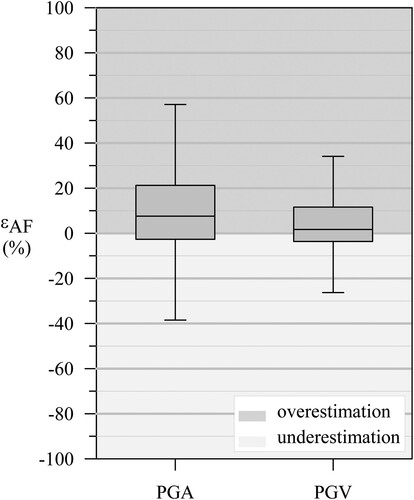
Finally, with reference to about 4,500 sites, for which detailed sub-soil models were available, the AFPGA and AFPGV values obtained by means of IGAG_20 and site-specific LSSR analyses were compared. The error was computed according to the following equation:
(3)
(3) where AFIGAG_20 and AFLSSR are referred to the AF obtained by means of IGAG_20 methodology and site-specific LSSR, respectively. The IGAG_20 forecast and the results of site-specific LSSR are in satisfactory agreement, as shown by the box plots of the error ϵAF sketched in , since the median error is lower than 10%. It is worth noting that the AFPGV IGAG_20 forecast is characterised by a better precision and accuracy than AFPGA, see , since the recurrent site condition is characterised by VS30 in the range of 200–600 m/s and HEB in the range of 6–30 m, hence, the main amplification phenomena and related uncertainties are referred to low periods as in the case of PGA rather than of PGV.
Figure 4. Box plots of the error ϵAF obtained comparing IGAG_20 AFs and results from site-specific LSSR analyses with reference to about 4,500 locations.
4. Conclusions
Italian maps of amplification factors for peak ground acceleration and peak ground velocity are proposed, based on the IGAG_20 methodology (CitationFalcone et al., Citation2021), to modify the ground motion referred at the outcropping engineering bedrock considering the lithostratigraphic site effects. About 2 million one-dimensional soil columns were determined based on the site data archived in the Italian database of seismic microzonation. A set of 630 response spectra related to the return period of 475 years were defined according to the Italian seismic hazard referred to as the outcropping engineering bedrock. A total of about 30 million numerical simulations of the local seismic site response were carried out adopting the linear equivalent approach in the frequency domain. The IGAG_20 forecast was in satisfactory agreement with the results of site-specific analyses based on detailed sub-soil models.
The proposed maps are expected to improve (i) real-time prediction of ground motion after an earthquake (shakemaps), (ii) scenario maps of seismic-induced landslides and rockfalls, (iii) seismic risk maps referred to lifelines and (iv) scenario damage-maps at regional or inter-municipality scale to support planning strategies, estimation of seismic retrofitting costs, and improvement of seismic emergency system.
Figure 5. An Italian map of AFPGA (16° percentile).
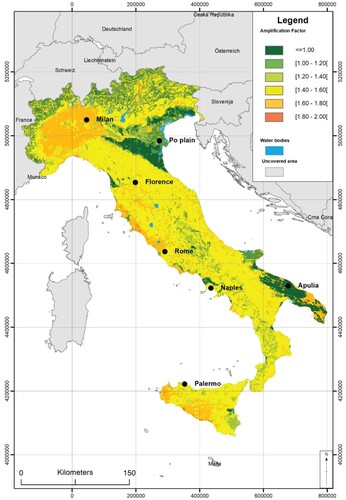
Figure 6. Italian map of AFPGV (16° percentile).
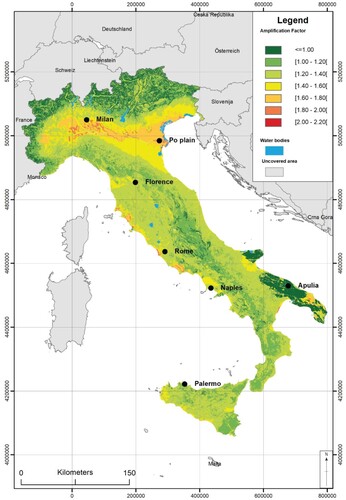
Figure 7. Italian map of AFPGA (84° percentile).
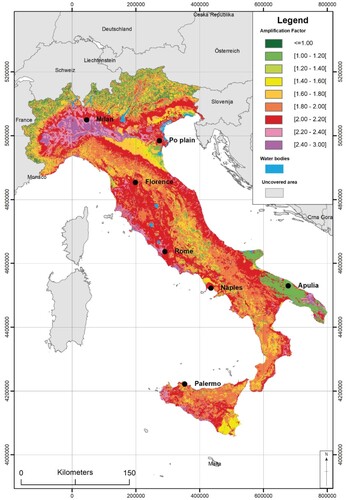
Figure 8. Italian map of AFPGV (84° percentile).
Software
The raster datasets were created with GRASS GIS V.7.6.1 software, using a bash script written specifically for the purpose. The maps were generated using the ArcGIS V.10.8.1 software.
TJOM_2101947_Supplemental_files
Download Zip (13.4 MB)Acknowledgements
Authors would like to thank Fabrizio Bramerini, Sergio Castenetto, Antonella Gorini, and Daniele Spina (all of them from the Italian Civil Protection Department of the Presidency of Council of Ministers) for the useful discussions. We also thank Junko Iwahashi (Geospatial Information Authority of Japan) for providing the vectors of the geomorphological classes of Italy, and Dario Albarello (University of Siena, Italy) and Emanuele Tarquini (Indra, Italy) for supporting us in the definition of proper sub-soil conditions.
Disclosure statement
No potential conflict of interest was reported by the author(s).
Data availability statement
The data that support the findings of this study are available from Istituto di Geologia Ambientale e Geoingegneria (Institute of Environmental Geology and Geoengineering of the Italian National Council of Research). Restrictions apply to the availability of these data, which were used under license for this study. Data are available from the authors with the permission of Istituto di Geologia Ambientale e Geoingegneria (Institute of Environmental Geology and Geoengineering of the Italian National Council of Research).
Additional information
Funding
Related Research Data
References
- Barani, S., Ferretti, G., & De Ferrari, R. (2020). Incorporating results from seismic microzonation into probabilistic seismic hazard analysis: An example in Western Liguria (Italy). Engineering Geology, 267, Article 105479. https://doi.org/10.1016/j.enggeo.2020.105479
- Brando, G., Pagliaroli, A., Cocco, G., & Di Buccio, F. (2020). Site effects and damage scenarios: The case study of two historic centers following the 2016 Central Italy earthquake. Engineering Geology, 272, Article 105647. https://doi.org/10.1016/j.enggeo.2020.105647
- Dipartimento della Protezione Civile (DPC). (2018). Commissione tecnica per il supporto e monitoraggio degli studi di Microzonazione Sismica (ex art.5, OPCM3907/10), (2018) – WebMs; WebCLE. A cura di: Maria Sole Benigni, Fabrizio Bramerini, Gianluca Carbone, Sergio Castenetto, Gian Paolo Cavinato, Monia Coltella, Margherita Giuffrè, Massimiliano Moscatelli, Giuseppe Naso, Andrea Pietrosante, Francesco Stigliano. www.webms.it
- Dolce, M., Prota, A., Borzi, B., da Porto, F., Lagomarsino, S., Magenes, G., Moroni, C., Penna, A., Polese, M., Speranza, E., Verderame, G. M., & Zuccaro, G. (2020). Seismic risk assessment of residential buildings in Italy. Bulletin of Earthquake Engineering, 1–34. https://doi.org/10.1007/s10518-020-01009-5.
- Falcone, G., Acunzo, G., Mendicelli, A., Mori, F., Naso, G., Peronace, E., Porchia, A., Romagnoli, G., Tarquini, E., & Moscatelli, M. (2021). Seismic amplification maps of Italy based on site-specific microzonation dataset and one-dimensional numerical approach. Engineering Geology, 289, Article 106170. https://doi.org/10.1016/j.enggeo.2021.106170
- Falcone, G., Boldini, D., & Amorosi, A. (2018). Site response analysis of an urban area: A multi-dimensional and non-linear approach. Soil Dynamics and Earthquake Engineering, 109, 33–45. https://doi.org/10.1016/j.soildyn.2018.02.026
- Falcone, G., Mendicelli, A., Mori, F., Fabozzi, S., Moscatelli, M., Occhipinti, G., & Peronace, E. (2020a). A simplified analysis of the total seismic hazard in Italy. Engineering Geology, 267, Article 105511. https://doi.org/10.1016/j.enggeo.2020.105511
- Falcone, G., Romagnoli, G., Naso, G., Mori, F., Peronace, E., & Moscatelli, M. (2020b). Effect of bedrock stiffness and thickness on numerical simulation of seismic site response. Italian case studies. Soil Dynamics and Earthquake Engineering, 139, Article 106361. https://doi.org/10.1016/j.soildyn.2020.106361
- Fontana, C., Cianci, E., & Moscatelli, M. (2020). Assessing seismic resilience of school educational sector. An attempt to establish the initial conditions in Calabria region, southern Italy. International Journal of Disaster Risk Reduction, 51, Article 101936. https://doi.org/10.1016/j.ijdrr.2020.101936
- Forte, G., Chioccarelli, E., De Falco, M., Cito, P., Santo, A., & Iervolino, I. (2019). Seismic soil classification of Italy based on surface geology and shear-wave velocity measurements. Soil Dynamics and Earthquake Engineering, 122, 79–93. https://doi.org/10.1016/j.soildyn.2019.04.002
- Galli, P., & Naso, G. (2008). The “taranta” effect of the 1743 earthquake in Salento (Apulia, Southern Italy). Bollettino di Geofisica Teorica e Applicata, 49, 177–204.
- Gazetas, G. (1982). Vibrational characteristics of soil deposits with variable wave velocity. International Journal for Numerical and Analytical Methods in Geomechanics, 6(1), 1–20. https://doi.org/10.1002/nag.1610060103
- Graziani, L., del Mese, S., Tertulliani, A., Arcoraci, L., Maramai, A., & Rossi, A. (2019). Investigation on damage progression during the 2016–2017 seismic sequence in Central Italy using the European macroseismic scale (EMS-98). Bulletin of Earthquake Engineering, 17(10), 5535–5558. https://doi.org/10.1007/s10518-019-00645-w
- Huber, M., Marconi, F., & Moscatelli, M. (2015). Risk-based characterisation of an urban building site. Georisk, 9(1), 49–56. https://doi.org/10.1080/17499518.2015.1015574
- ItBC. (2018). CS.LL.PP. Decreto Ministeriale: norme tecniche per le costruzioni. Gazz. Uff. della Repubb. Ital. n. 42, 20 febbraio, Suppl. Ordin. n. 8. Ist. Polig. Rome e Zecca dello Stato S.p.a. 2018.
- Iwahashi, J., Kamiya, I., Matsuoka, M., & Yamazaki, D. (2018). Global terrain classification using 280 m DEMs: Segmentation, clustering, and reclassification. Progress in Earth and Planetary Science, 5(1), 1. https://doi.org/10.1186/s40645-017-0157-2
- Kottke, A., Wang, X., & Rathje, E. M. (2013). Technical manual for strata.
- Kottke, A. R., & Rathje, E. M. (2013). Comparison of time series and random-vibration theory site-response methods. Bulletin of the Seismological Society of America, 103(3), 2111–2127. https://doi.org/10.1785/0120120254
- Kramer, S. (1996). Geotechnical earthquake engineering. Prentice Hall.
- Lee, V. W., & Trifunac, M. D. (2010). Should average shear-wave velocity in the top 30 m of soil be used to describe seismic amplification. Soil Dynamics and Earthquake Engineering, 30(11), 1250–1258. https://doi.org/10.1016/j.soildyn.2010.05.007
- Liu, Y., & Wu, Y. (2009). Stepwise multiple quantile regression estimation using non-crossing constraints. Statistics and Its Interface, 2(3), 299–310. https://doi.org/10.4310/SII.2009.v2.n3.a4
- Makra, K., & Chávez-García, F. J. (2016). Site effects in 3D basins using 1D and 2D models: An evaluation of the differences based on simulations of the seismic response of Euroseistest. Bulletin of Earthquake Engineering, 14(4), 1177–1194. https://doi.org/10.1007/s10518-015-9862-7
- Martelli, L. (2021). Assessment of seismic bedrock in deep alluvial plains. Case studies from the Emilia-Romagna plain. Geosciences, 11(7), 297–297. https://doi.org/10.3390/geosciences11070297
- Mascandola, C., Massa, M., Barani, S., Albarello, D., Lovati, S., Martelli, L., & Poggi, V. (2019). Mapping the seismic bedrock of the po plain (Italy) through ambient-vibration monitoring. Bulletin of the Seismological Society of America, 109(1), 164–177. https://doi.org/10.1785/0120180193
- Maufroy, E., Chaljub, E., Hollender, F., Kristek, J., Moczo, P., Klin, P., Priolo, E., Iwaki, A., Iwata, T., Etienne, V., De Martin, F., Theodoulidis, N. P., Manakou, M., Guyonnet-Benaize, C., Pitilakis, K., & Bard, P-Y. (2015). Earthquake ground motion in the Mygdonian Basin, Greece: The E2VP verification and validation of 3D numerical simulation up to 4 Hz. Bulletin of the Seismological Society of America, 105(3), 1398–1418. https://doi.org/10.1785/0120140228
- Meletti, C., & Montaldo, V. (2007). Stime di pericolosità sismica per diverse probabilità di superamento in 50 anni: valori di ag. Progetto DPC-INGV S1, Deliverable D2. http://esse1.mi.ingv.it/d2.html
- Michelini, A., Faenza, L., Lanzano, G., Lauciani, V., Jozinović, D., Puglia, R., & Luzi, L. (2019). The new shakemap in Italy: Progress and advances in the last 10 yr. Seismological Research Letters, 91(1), 317–333. https://doi.org/10.1785/0220190130
- Moczo, P., Kristek, J., Bard, P. Y., Stripajová, S., Hollender, F., Chovanová, Z., Kristeková, M., & Sicilia, D. (2018). Key structural parameters affecting earthquake ground motion in 2D and 3D sedimentary structures. Bulletin of Earthquake Engineering, 16(6), 2421–2450. https://doi.org/10.1007/s10518-018-0345-5
- Montaldo, V., & Meletti, C. (2007). Valutazione del valore della ordinata spettrale a 1sec e ad altri periodi di interesse ingegneristico. Progetto DPC-INGV S1, Deliverable D3. http://esse1.mi.ingv.it/d3.html
- Mori, F., Mendicelli, A., Moscatelli, M., Romagnoli, G., Peronace, E., & Naso, G. (2020). A new Vs30 map for Italy based on the seismic microzonation dataset. Engineering Geology, 275, Article 105745. https://doi.org/10.1016/j.enggeo.2020.105745
- Moscatelli, M., Albarello, D., Scarascia Mugnozza, G., & Dolce, M. (2020a). The Italian approach to seismic microzonation. Bulletin of Earthquake Engineering, 18(12), 5425–5440. https://doi.org/10.1007/s10518-020-00856-6
- Moscatelli, M., Vignaroli, G., Pagliaroli, A., Razzano, R., Avalle, A., Gaudiosi, I., Giallini, S., Mancini, M., Simionato, M., Sirianni, P., Sottili, G., Bellanova, J., Calamita, G., Perrone, A., Piscitelli, S., & Lanzo, G. (2020b). Physical stratigraphy and geotechnical properties controlling the local seismic response in explosive volcanic settings: The Stracciacappa maar (central Italy). Bulletin of Engineering Geology and the Environment, 1–21. https://doi.org/10.1007/s10064-020-01925-5.
- Nappi, R., Gaudiosi, G., Alessio, G., De Lucia, M., & Porfido, S. (2017). The environmental effects of the 1743 Salento earthquake (Apulia, Southern Italy): A contribution to seismic hazard assessment of the Salento Peninsula. Natural Hazards, 86(S2), S295–S324. https://doi.org/10.1007/s11069-016-2548-x
- Rollins, K. M., Evans, M. D., & Diehl, N. B. (1998). Shear modulus and damping relationships for gravels. Journal of Geotechnical and Geoenvironmental Engineering, 124(5), 396–405. https://doi.org/10.1061/(ASCE)1090-0241(1998)124:5(396)
- Rollins, K. M., Singh, M., & Roy, J. (2020). Simplified equations for Shear-Modulus degradation and damping of gravels. Journal of Geotechnical and Geoenvironmental Engineering, 146(9). https://doi.org/10.1061/(ASCE)GT.1943-5606.0002300
- Seed, H. B., & Idriss, I. M. (1970). Soil moduli and damping factors for dynamic response analyses. Report No. EERC 70–10, Earthquake Engineering Resource Center, University of California, Berkley, California.
- Shreyasvi, C., Venkataramana, K., & Chopra, S. (2019). Local site effect incorporation in probabilistic seismic hazard analysis – A case study from southern peninsular India, an intraplate region. Soil Dynamics and Earthquake Engineering, 123, 381–398. https://doi.org/10.1016/j.soildyn.2019.04.035
- Zhu, C., Pilz, M., & Cotton, F. (2020). Which is a better proxy, site period or depth to bedrock, in modelling linear site response in addition to the average shear-wave velocity? Bulletin of Earthquake Engineering, 18(3), 797–820. https://doi.org/10.1007/s10518-019-00738-6