
 ?Mathematical formulae have been encoded as MathML and are displayed in this HTML version using MathJax in order to improve their display. Uncheck the box to turn MathJax off. This feature requires Javascript. Click on a formula to zoom.
ABSTRACT
The selection of the most appropriate window and blind design is a challenging task due to the existence of potential conflicts between visual comfort, thermal comfort, energy consumption and life cycle cost. Resolving these conflicts relies on a trade-off window and blind design. This research applied a decision-making framework to select a trade-off window and blind design for an office room in Sweden. The decision-making framework was developed based on integrating the non-dominated sorting genetic algorithm-II and the analytical hierarchy process. The first step in the application of the framework was to generate a model of the office room using EnergyPlus. Six types of window and four types of blind; an internal venetian blind, an internal roller curtain, an external venetian blind and an external overhang panel, were modelled in EnergyPlus. The second step was to run an optimisation using non-dominated sorting genetic algorithm-II. For this purpose, various window and blind design variables were specified in modeFRONTIER platform. The third and last step in the application of the decision-making framework was to select a trade-off window and blind design using analytical hierarchy process. The results show the strength of the decision-making framework in selecting a trade-off design, and thereby the ability to resolve conflicts through intelligent use of simulation in analyzing big-data in built environment, energy and cost sectors. Since, the computation and processing power for performing simulations is constantly increasing, architects and designers can exploit the decision-making framework and locate a trade-off design in a relatively short period of time.
Introduction
Total energy consumption for offices and educational buildings in Sweden was about 6.25 TWh in 2016, which translates to 32.5% of the total energy consumption for the non-residential building sector for the same year (Swedish Energy Agancy, Citation2017). Windows are a crucial aspect in terms of meeting the Energy Performance of Building Directive (EPBD) requirements concerning the reduction of energy consumption and improvement of indoor comfort in buildings (Carlucci, Cattarin, Causone, & Pagliano, Citation2015b; Tsikaloudaki, Laskos, Theodosiou, & Bikas, Citation2012).
However, selecting proper windows remains a challenging task due to three main difficulties. The first relates to the contradictory effects of windows on energy consumption and indoor comfort. Windows are responsible for heat gain and heat loss through transmission, which adds energy needed for space cooling and space heating during summer and winter respectively (Avasoo, Citation2007). Furthermore, windows play a substantial role in providing daylight penetration and improving visual comfort (Zemella, De March, Borrotti, & Poli, Citation2011), thereby enhancing occupants’ productivity in office rooms and educational buildings (Boyce, Hunter, & Howlett, Citation2003; Zemella et al., Citation2011). Improving visual comfort by increasing daylight penetration may promote the installation of large windows (Mangkuto, Rohmah, & Asri, Citation2016). However, larger windows can intensify glare problems due to the extensive amount of daylight that they allow into the building. Larger windows may also cause overheating problems by increasing unwanted heat gain through transmission. According to Rodriguez, Yamín Garretón, and Pattini (Citation2016) and Zhang and Dear (Citation2017), controlling glare and overheating in office rooms and educational buildings can improve occupants’ productivity by boosting their ability to perform cognitive interpretations. Architects and designers may therefore choose to use blinds with the intention of managing glare and overheating. However, larger windows in combination with blinds can increase the life cycle cost (LCC) by incurring additional investment, maintenance (Nikoofard, Ugursal, & Beausoleil-Morrison, Citation2014) and consumption costs (O’Brien, Kapsis, & Athienitis, Citation2013).
The second difficulty relates to the availability of a variety of window and blind designs in different sizes, positions and forms, making the selection of windows and blinds an intricate decision challenge for architects and designers. In Sweden the variation in solar intensity and angle of the solar elevation between summer and winter varyies to a great extent (Bülow-Hübe, Citation2007; Dubois, Citation2001), which compounds the problem. The third difficulty involves decisions on the selection of windows and blinds, that should include all criteria and their interactions simultaneously (Zemella et al., Citation2011). Accordingly, decisions based on a single criterion are not recommended (Monghasemi, Nikoo, Fasaee, & Adamowski, Citation2015; Zemella et al., Citation2011).
To resolve the abovementioned difficulties, architects and designers should be able to select a design based on the trade-off between visual comfort, thermal comfort, energy consumption and LCC (Jalilzadehazhari, Johansson, Johansson, & Mahapatra, Citation2018). Selecting a trade-off design relies on the application of a decision making framework, which can be developed by integrating an optimisation algorithm with a multi-criteria decision-making method (MCDM method) (Hadas & Nahum, Citation2016). Jalilzadehazhari et al. (Citation2018) introduced a theoretical decision-making framework, which was developed based on integration between the non-dominated sorting genetic II algorithm (NSGA-II) as an optimisation algorithm and the analytical hierarchy process (AHP) as a MCDM method. The decision-making framework was intended for architects and designers who attempts to select a trade-off window and blind design. One of the main limitations of the decision-making framework is the feasibility of analysing subjective issues, such as quality of view through windows. This means that the decision-making framework solely allows analysing the objective criteria of visual comfort, thermal comfort, energy consumption and LCC.
No attempt has been previously made to exploit this framework in practice. Hence, this study applies the decision-making framework to select a trade-off window and blind design for an office room and thereby evaluates the strength of the framework in resolving the difficulties.
Method
The office room was situated on the top floor of an educational building, which was to be renovated with new windows and blinds. The building was located in the climate zone III in Växjö, Sweden. The National board of housing building and planning (Citation2015) has classified Sweden into four climate zones with different climate conditions. Climate zone I represents the northernmost and coldest zone, while climate zone IV represents the southernmost and warmest zone in the Swedish classification. The office room had windows on both the south and the west façades. Only the façades with windows were external walls: the other walls and the floor were adiabatic. shows a section and a plan layout of the office room.
Figure 1. Section and plan layout of the office room.
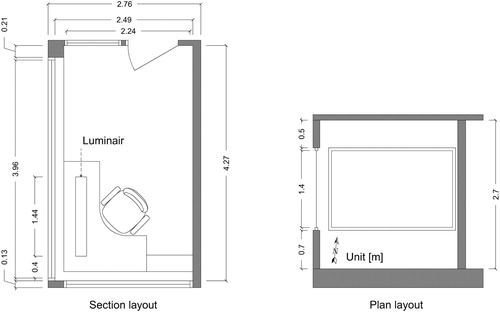
The thermal specifications of the office room comply with the national requirements at the time it was constructed in 2001–2002 (). The airtightness was assumed to be 1.6 l/s.m2 at a pressure of ±50 Pa, which is also in accordance with national requirements at the time (National board of housing building and planning, Citation2002). The office room was connected to district cooling and biomass-based district heating systems in order to provide the energy needed for space cooling and space heating. Biomass-based district heating systems in Sweden have less environmental impact than other energy supply systems, and are therefore the most commonly used systems in this country (Gustafsson, Gustafsson, Myhren, Bales, & Holmberg, Citation2016). The district heating and cooling systems, with distribution temperatures of 80°C and 14°C respectively, were assumed to be ideal. Hence, the efficiency of all subsystems was equal to unit. The heat distribution system was a water-based radiator system with a temperature setpoint of 60°C. Furthermore, the building was equipped with a mechanical ventilation system comprising a mechanical supply and exhaust fan, a water-cooling coil and a heat recovery system. The ventilation system operated for a period of 11 h between 7am and 6pm on working days, with an air flow rate of ±0.035 l/m2. The efficiency of the supply fan and heat recovery system was 70% and 75% respectively.
Table 1. Thermal specifications for the office room.
In accordance with Sweden's national requirements, when the ventilation system was operational the upper and lower temperature limits were set to 22°C and 18°C respectively (National board of housing building and planning, Citation2015). An occupancy time of 10 h between 7.30am and 5.30pm was also assumed on working days. The occupancy internal gain was set to 120 W per person, which represents an activity level equivalent to seated and very light activity (ISO7730-Standard, Citation2005). The occupancy density was assumed to be 0.09 person per m2. The thermal resistance of clothing is in accordance with ISO7730-Standard (Citation2005) and was set to 0.5 (clo) in summer and 1 (clo) in winter. Office equipment and the electrical lighting system were assumed to be energy-efficient types, contributing a heat gain of 7 and 11.6 W/m2 respectively during occupancy time (Gustafsson et al., Citation2017). The luminaire included two 35 W fluorescent lamps controlled by a simple on/off switch at the bottom. The reflectance of interior surfaces, including walls, the ceiling and the floor, is compliant with the Swedish standard (Månsson & Schönbeck, Citation2003) and was defined as 60%, 80% and 20% respectively.
Decision-making framework
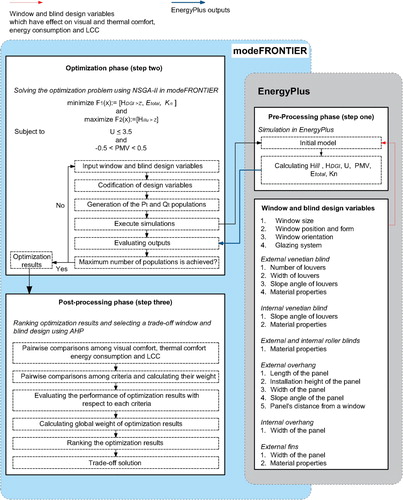
shows the integration between NSGA-II and AHP in the decision-making framework for selecting a trade-off window and blind design (Jalilzadehazhari et al., Citation2018). The framework comprises three main phases; pre-processing, optimisation and post-processing phases. The pre-processing phase is the first step in the application of the framework, which starts by generating an initial model of a room or a building using EnergyPlus. EnergyPlus is a commonly used simulation tool, which allows architects and designers to evaluate the performance of various window and blind designs considering visual comfort, thermal comfort, energy consumption and LCC. Furthermore, 19 window and blind design variables are presented in the pre-processing phase. The optimisation phase is the second step in the application of the decision-making framework; it concentrates on the use of NSGA-II algorithm to perform an optimisation in modeFRONTIER. ModeFRONTIER as an integration platform can handle both continuous and district variables when running an optimisation. The post-processing phase is the third step in exploiting the decision-making framework, which refers to the application of AHP for selecting a trade-off window and blind design using modeFRONTIER.
Figure 2. the decision-making framework (Jalilzadehazhari et al., Citation2018).
The application of the decision-making framework on the office room is thoroughly explained below.
Pre-processing phase
An initial model of the office room was generated in EnergyPlus by specifying data regarding the room's geometry and location, thermal specifications, occupancy schedule, heating, cooling and ventilation system. Later, six distinct window types based on combinations of different glass layers and air gaps were modelled in EnergyPlus. Window types 1–5 were 3-pane windows with aluminium cladding, while window type 6 was an electrochromic window. All windows had similar wooden frames. presents various properties of the windows considered in this study.
Table 2. Various properties of the windows
Furthermore, four distinct types of blinds were considered; an internal venetian blind, an internal roller curtain, an external venetian blind and an external overhang panel. The abovementioned blinds were selected as they are commonly used in office rooms in Sweden. shows various properties of the blinds analysed in this study.
Table 3. The properties of the internal and external blinds.
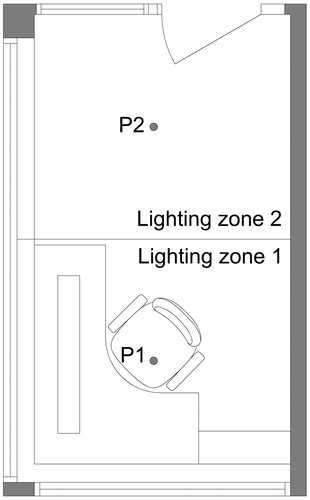
To perform visual comfort evaluations, two identical lighting zones were considered for the office room (). Two reference points, each positioned at the middle of the lighting zones, were also defined. Reference point P1 was closer to the window on the south façade and shows the occupant's position in the office room, while reference point P2 was closer to the back of the room. It was assumed that office tasks were performed with an illuminance threshold of 500 lx, in compliance with SS-EN 12464-1:2011 (Swedish Standard Institute, Citation2011). An automatic control system based on a maximum allowable daylight glare index of 22 was also defined for controlling the blinds and tinting the electrochromic window (Lee & Tavil, Citation2007).
Figure 3. The position of lighting zones and two reference points.
Visual comfort evaluations were performed by quantifying the amount of daylight, glare and uniformity in the office room. Daylight uniformity indicates daylight distribution in the office room at 0.8 m above floor level. Three evaluation metrics were calculated for this purpose, including (i) the number of hours when daylight illuminance exceeded 500 lx at P1 (), (ii) the number of hours when the daylight glare index exceeded 22 at P1 (
) and daylight uniformity (U). EnergyPlus (8.8.0) is incapable of calculating daylight uniformity, it was therefore calculated using equation 1 (Ochoa, Aries, van Loenen, & Hensen, Citation2012). According to Ochoa et al. (Citation2012), a U equal to or less than 3.5 is capable of providing a comfortable visual environment in an office room.
(1)
(1) Considering thermal comfort, the predicted mean vote (PMV) metric was obtained for the office room using EnergyPlus. A PMV within the −0.5–+0.5 range represents a comfortable thermal environment (Pourshaghaghy & Omidvari, Citation2012). Energy consumption evaluations included calculation of the total energy consumption, which comprised the energy needed for space heating and cooling also the electricity needed for the lighting and ventilation systems. With respect to LCC, present value – as an evaluation metric – was determined using EnergyPlus. Present value not only considers the investment, consumption and maintenance cost, but also takes inflation and interest rates into account (Karaguzel, Zhang, & Lam, Citation2003). The mathematical formula for calculating the present value is shown in equations 2 and 3;
(2)
(2)
(3)
(3) where:
is present value during a lifespan of n years;
is the annual maintenance cost;
is the annual energy consumption cost; r: interest rate; t: lifespan of n years; E is the annual energy consumption (kWh/m2);
is the energy price per kWh/m2;
is the inflation in energy price (%);
is the investment cost
EnergyPlus automatically estimates the total investment cost based on the unit price of the windows and blinds, multiplied by the total window area. When calculating , an interest rate of 3%, an inflation rate of 1% and a lifespan of 30 years were used. The energy price for heating and cooling was 0.74 (SEKFootnote1/kWh), but 1.38 (SEK/kWh) for electricity, which corresponds to the price of energy in Sweden in 2016 (Gustafsson et al., Citation2017). shows the investment cost per unit for the window types and blinds. It was assumed that windows and blinds require no maintenance in their 30-year lifespans.
Table 4. Cost per unit for windows and blinds.
The EnergyPlus was later coupled to modeFRONTIER by writing a script file using a DOSBatch node in modeFRONTIER. When the coupling process was successfully completed, the optimisation and later post-processing phases were performed.
Optimisation phase
The optimisation phase starts by specifying the window and blind designs variables. The window design variables for this study were the window size, position and form, as well as the window type. The window design variables were selected as they concurrently affect visual comfort, thermal comfort, energy consumption and LCC (Acosta, Munoz, Campano, & Navarro, Citation2015; Atzeri, Cappelletti, Gasparella, & Tzempelikos, Citation2013; Kämpf, Wetter, & Robinson, Citation2010; Lee & Tavil, Citation2007; Mainini, Bonato, Poli, & Speroni, Citation2015; Singh, Lazarus, & Kishore, Citation2015; Suga, Kato, & Hiyama, Citation2010; Wright, Citation2009; Zemella et al., Citation2011).
The design variables for internal and external venetian blinds consisted of the slope angle (Chan & Tzempelikos, Citation2015; González & Fiorito, Citation2015) and visible reflectance of louvres (Chan & Tzempelikos, Citation2015; González & Fiorito, Citation2015), while the design variable for the roller curtain only included the curtain's visible reflectance (Chan & Tzempelikos, Citation2015). A variation in the visible reflectance value represents a change in the colour of the louvres or the roller curtain. The design variables for the overhang panel comprised of the panel tilt (Chua & Kiang, Citation2010) and its width as a fraction of the window height (De Carli, Citation2009; Wetter & Wright, Citation2003). The abovementioned design variables were determined using an input variable node in modeFRONTIER.
The second step in the optimisation phase was to codify the selected window and blind design variables. Codification refers to the determination of upper and lower boundaries of design variables. The upper and lower boundaries of the window size, position and form were defined by modifying the coordinate points of windows in relation to external wall coordinate points in modeFRONTIER. The process of codifying the window size, position and form was explained using a 3D layout of the office room, with windows on both the south and the west façade (). The window on the south façade was specified by coordinate points a, b, c and d, while the external wall was indicated by coordinate points A, B, C and D. However, the window on the west façade was determined by coordinate points e, f, g and h and installed in the west façade, with coordinate points C, D, E and F.
Figure 4. A 3D layout of an office room.
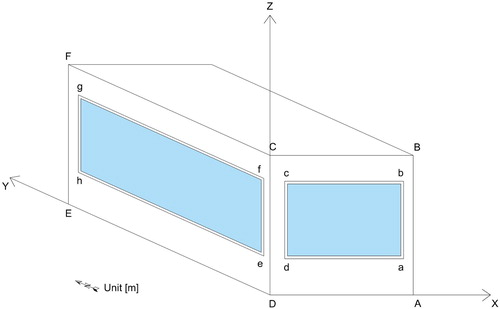
The codification of points a, b, c and d in relation to points A, B, C and D is presented in . The settings presented provide two main benefits, as they allow the window size, position and form to be changed simultaneously, while also allowing the window to remain rectangular. Furthermore, the codification settings ensure a suitable view of the outside through the window. According to Altomonte (Citation2009), a suitable view should include both the skyline and the foreground. The upper boundary of and
was set to 0.5 m above floor level in order to provide the foreground view. In addition, the lower boundary of
and
was set to 0.5 m from ceiling level, so ensuring a view of the skyline. A similar process was used to define the upper and lower window size, position and form boundaries on the west façade.
also shows the specified upper and lower boundaries of the window type in modeFRONTIER. A one-unit increase in window types (in one-unit intervals) represents a distinct window as defined in the pre-processing phase. The codification settings for design variables of internal and external blinds, including their upper and lower boundaries, were also presented in . With respect to the internal and external venetian blinds, a slope angle of 10° and 90° represents closed and opened louvres respectively. This decision was made due to the large variation in solar intensity and solar elevation height in Sweden and their effect on visual and thermal comfort. Moreover, the highest visible reflectance of louvres in the internal and external venetian blinds corresponds to white blinds, while the lowest visible reflectance corresponds to black blinds. Comparably, the highest and lowest visible reflectance of the roller curtain corresponds to a white and a black curtain respectively. The intermediate visible reflectance values indicate different shades of grey.
Table 5. Codification settings.
An optimisation problem was developed by specifying optimisation objectives and constraints. According to Carlucci et al. (Citation2015b), optimisation objectives are the metrics used for evaluating visual comfort, thermal comfort, energy consumption and LCC. The mathematical formulation of the optimisation problem was shown in equation 4. The U 3.5 and PMV within the −0.5–+0.5 range were selected as optimisation constraints, ensuring the minimum required U and PMV in the office room.
(4)
(4)
where: refers to the number of hours when daylight illuminance exceeded 500 lx at P1;
represents the number of hours when daylight glare index exceeded 22 at P1;
refers to the total energy need for space heating, cooling and electricity for lighting and artificial ventilation;
represents the present value of various window and blind designs;
represents a daylight uniformity equal to or less than 3.5, and;
refers to PMV within the −0.5–+0.5 range.
The third step in the optimisation phase was to specify features such as the population size (), number of generations (
) and mutation and crossover probabilities. Specifying the abovementioned features is a challenging task as they depend on the complexity of the optimisation problem. Earlier studies, which used algorithms to optimise building envelopes and systems considered a maximum population size of 1000 and a generation number of 2000, but the mutation and crossover probabilities varied between 0 and 0.4 and between 0.5 and 1 respectively (Carlucci et al., Citation2015b). The following settings were defined in this study for consistency with the abovementioned features: population size = 100, generation number = 200, mutation = 0.035 and crossover probability = 0.9. The combination of 100 populations with 200 generations permitted execution of 20,000 simulations in EnergyPlus. When NSGA-II was terminated, the results of 20,000 simulations were presented in modeFRONTIER.
Post-processing phase
The post-processing phase involved applying the AHP to rank the optimisation results and later select a trade-off window and blind design. A hierarchy model was developed, which comprised of the goal of the AHP, the objectives of the AHP and their respective criteria ().
Figure 5. The hierarchy model developed for the AHP.
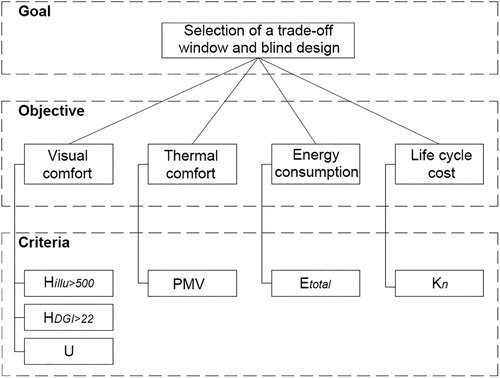
The first step in the application of AHP was to perform pairwise comparisons between the objectives of the AHP and between their respective criteria, thereby creating comparison matrixes. Numerical ratings in were used for this purpose, presenting the relative importance of objectives of the AHP and their respective criteria.
Table 6. Pairwise numerical rating (Saaty, Citation2008).
Matrix A shows the pairwise comparisons performed between objectives of AHP. A literature study was conducted in order to specify the relative importance of visual comfort, thermal comfort, energy consumption and LCC. According to Kats, Alevantis, Mills, and Perlman (Citation2003), improving visual and thermal comfort can provide economic benefits that are approximately seven times greater than decreasing energy consumption and life cycle cost throughout the lifetime of a building. The relative importance of visual comfort and thermal comfort was also retrieved from previous studies. Frontczak, Andersen, and Wargocki (Citation2012) developed a multivariate linear regression model in order to analyse the correlation between occupants’ satisfaction with the overall indoor environment and their satisfaction with visual comfort, thermal comfort, acoustic quality and air quality. Comparing coefficient values showed that improving visual comfort may enhance occupants’ overall satisfaction with the indoor environment slightly more than improving thermal comfort.
Later, the weights for the AHP objectives were then obtained by (i) calculating the sum of each column in matrix A, (ii) dividing the pairwise comparisons in each column by the sum of the respective column calculated in the previous step to normalise matrix, and (iii) calculating the average of each row in the normalised matrix.
Table
The consistency ratio (CR) of matrix A was also quantified using equation 5. The CR evaluates whether the pairwise comparisons applied in matrix A are consistent. The CR should be less than 0.08 when n = 3 or less than 0.1 when n > 3. (Ordouei, Elkamel, Dusseault, & Alhajri, Citation2015)where
is the maximum eigenvalue of a comparison matrix; n is the number of elements in the developed matrices; RI is the random consistency index.
The average RI of sample size n = 10 is shown in (Hotman, Citation2005).
Table 7. Random consistency index (RI).
The number of elements in matrix A is equal to 4 (n = 4), since four objectives were compared with one another. The CR calculated for matrix A was around 0.033, which shows the consistency of applied pairwise comparisons.
Applied pairwise comparisons between visual comfort criteria in matrix B were also specified by conducting a literature study. The results presented by previous studies showed that the amount of daylight ( in this study) is more important than glare (
in this study) to a small degree (Chung & Ng, Citation2016), while it is slightly more important than uniformity (U in this study) (Chung & Ng, Citation2016). The CR calculated for matrix B was approximately 0.1, which means that applied pairwise comparisons between visual comfort criteria were consistent.
Table
No further comparison matrix was developed in respect of thermal comfort, energy consumption and LCC, as PMV, and
were the only evaluation metrics. The final weights of the criteria were the product of the weight of the objectives and the weight of their respective criteria (). The final weight of all criteria was then imported to modeFRONTIER to rank the optimisation results and select a trade-off window and blind design.
Table 8. Final weight of the criteria.
Results
The first part of the results describes the variation of the evaluation metrics among 20,000 window and blind designs, while the second part presents a design based on trade-off between visual comfort, thermal comfort, energy consumption and LCC.
Variation of the evaluation metrics
The variation in was presented in . Analysing the results shows that designs incorporating an electrochromic window on both façades provide a higher
than other window and blind designs. The visible transmittance of the electrochromic window under clear and fully tinted conditions was 66% and 2% respectively, while the visible transmittance of the internal venetian blind, internal roller curtain and external venetian blind was 0%. Accordingly, the electrochromic window still allowed daylight to penetrate the office room when it was fully tinted to control daylight glare. However, other blinds intercepted the daylight penetration to a large degree when they were fully closed to control daylight glare. Furthermore, the minimum
provided by designs incorporating a electrochromic window at tinted condition was greater than the minimum
provided by designs incorporating a fully closed overhang blind, although their performance was relatively similar in respect of the maximum
.
Figure 6. Amount of daylight and glare among window and blind designs.
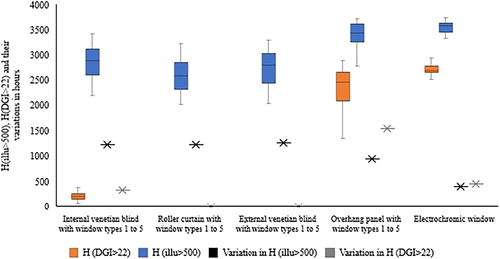
In addition, the lowest variation in was attained in designs incorporating an electrochromic window, while the highest variation occurred in designs incorporating a roller curtain. A large variation indicates the sensitivity of
, considering changes in the design variables of the roller curtain.
With regard to , daylight glare was eliminated successfully in the 100% of designs incorporating a roller curtain or an external venetian blind. The roller curtain with a visible transmittance of 0% prevented unwanted direct daylight penetration into the office room. The external venetian blind also blocked daylight penetration before entering the office room. In contrast, the performance of designs incorporating an overhang panel and designs incorporating an electrochromic window were less successful at avoiding daylight glare as they permitted direct daylight to extensively penetrate the office room.
The lowest variation in was seen in designs incorporating a roller curtain or an external venetian blind, while the highest variation was observed in designs incorporating an overhang panel, thereby indicating the sensitivity of
regarding changes in overhang panel design variables.
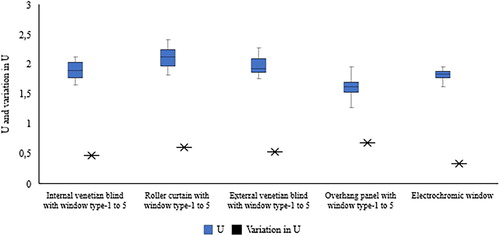
The highest U was achieved by designs incorporating a roller curtain, while the lowest was obtained by designs incorporating an overhang blind. However, the variation in U was relatively similar in all window and blind designs (). This is because the office room had two windows on the south and west façades, allowing daylight to penetrate deeply into the office room and resulting in an analogous daylight uniformity.
Figure 7. Uniformity among window and blind designs.
Considering thermal comfort, the PMV of the window and blind designs was demonstrated in . Analysing the results shows that designs incorporating an interior venetian blind performed better in terms of improving thermal comfort, as 100% of the abovementioned designs provided a PMV in the −0.5–+0.5 range. This is because designs incorporating an internal venetian blind scattered penetrated direct solar radiation into the office room, thereby maintaining the operating temperature within the comfort zone (18°C–22°C in this study). Hence the internal venetian blind is a beneficial option in Sweden due to the country's cold climate. In addition, about 95% of designs incorporating a roller curtain had a PMV in the −0.5–+0.5 range, while the PMV of the remaining 5% was greater than 0.5. The visible reflectance of the roller curtain in designs with a PMV greater than 0.5 was 0.1, which indicates the deficient performance of the black roller curtain in improving thermal comfort in cold climates similar to Sweden. This is because the black roller curtain extensively absorbs penetrated solar radiation, while only slightly reflecting solar radiation into the office room. Therefore, the operating temperature is outside the limits (18°C–22°C in this study) with the black roller curtain. Furthermore, the analyses of results show that about 97% of the designs incorporating an external venetian blind had a PMV in the −0.5–+0.5 range, while the PMV of the remaining 3% was smaller than −0.5. This is because the abovementioned designs blocked direct solar radiation before it penetrated the office room, thereby decreasing the heat gain through the windows. Accordingly, the operating temperature in 3% of designs incorporating an external venetian blind was outside the limits (18°C–22°C in this study). In addition, about 98% of the designs incorporating an overhang had a PMV in the −0.5–+0.5 range, while the PMV of the remaining 2% was greater than 0.5.
Figure 8. PMV among window and blind designs.
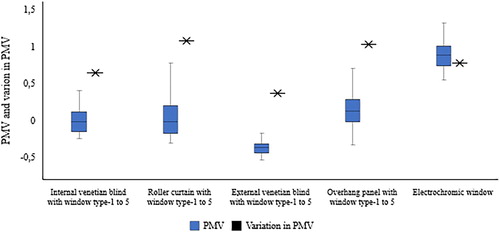
The lowest improvements to thermal comfort was observed in designs, which incorporated an electrochromic window, as neither of these designs provided a PMV in the −0.5–+0.5 range. This is because the electrochromic window had a relatively great SHGC, which allowed for extensive direct solar radiation to enter the office room, increasing the heat gain through the windows. Accordingly, the operating temperature for designs incorporating an electrochromic window was outside the limits (18°C–22°C in this study).
The smallest variation in PMV was seen in designs incorporating an external venetian blind, while the highest variation occurred in designs incorporating a roller curtain. High variation indicates the sensitivity of PMV considering changes of the roller curtain's design variables.
shows the performance of various window and blind designs with regard to energy consumption and LCC. Analysing the results shows that designs incorporating an external venetian blind helped to reduce energy consumption. The abovementioned designs were mainly beneficial when reducing the energy needed for space cooling, while slightly increasing the energy needed for space heating. This is because designs incorporating an external venetian blind intercepted direct solar radiation, thereby decreasing heat gain through the windows. In contrast, designs incorporating an electrochromic window were responsible for high energy consumption. This is due to the high U-value of the electrochromic window in comparison with other windows, leading to increased heat gain in summer and a greater demand for cooling. Furthermore, the electrochromic window with a high U-value added to the heating demand in winter by increasing heat loss through transmission.
Figure 9. Energy consumption and present value among window and blind designs.
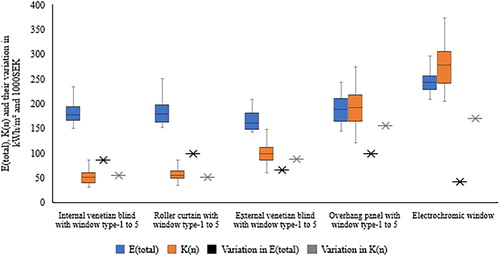
The lowest variation in was seen in designs incorporating an external venetian blind, while the highest variation was observed in designs incorporating an electrochromic window. The high level of variation shows the sensitivity of
, to changes in electrochromic window design variables.
In terms of LCC, designs incorporating an internal venetian blind had the lowest . The investment cost had a substantial influence on
The investment cost for 1 m2 of internal venetian blind with window type 5, which was the most expensive window, was about 92% of the investment cost for designs incorporating a roller curtain and window type 5, 60% of the investment cost for designs incorporating an external venetian blind and window type 5, 34% of the investment cost for designs incorporating an overhang panel and window type 5, and 22% of the investment cost for designs incorporating an electrochromic window.
The lowest variation in was seen in designs incorporating a roller curtain, while the highest variation was seen in designs incorporating an electrochromic window. The high level of variation shows the sensitivity of
to changes in electrochromic window design variables.
Trade-off window and blind design
When using the AHP, only window and blind designs with a PMV in the −0.5–+0.5 range and with a were considered. This decision was made to ensure that minimum requirements were met with respect to visual and thermal comfort. Accordingly, the AHP was only applied to 98% of all window and blind designs (19,548 of 20,000 designs), which met the visual comfort and thermal comfort requirements: the remaining designs were excluded from the pairwise comparison processes. The results show that a combination of an external venetian blind and window type 1 is the best window and blind design based on the trade-off between visual comfort, thermal comfort, energy consumption and LCC. shows the coordination of the windows and also presents external blind specifications as installed in the trade-off design. The window on the south façade had an area of 5.3 m2, corresponding to a window-to-wall ratio of 75%, while the window on the west façade had an area of 7.8 m2, corresponding to window-to-wall ratio of 68%. Both windows were rectangular in form and were almost positioned in the middle of the walls. The slope angle of the louvres was 60°, while the visible reflectance of the louvres was 80%, representing a white external venetian blind.
Table 9. Window and external venetian blind specifications in a trade-off design.
The trade-off design was selected due to its positive impact in terms of visual and thermal comfort, two important objectives in matrix A. The of the trade-off design was about 3168.5 h, greater than in 46% of the designs. At this point, window type 1 – with great visible transmittance – contributed to a high
. Moreover, the
of the trade-off design was 0, thereby demonstrating its capability when it comes to eliminating daylight glare. Furthermore, the trade-off design provided a U of 1.9.
In terms of thermal comfort, the PMV of the trade-off design was −0.4. In terms of energy consumption and LCC, the and
of the trade-off design were 185.7 (kWh/m2) and 92,969 (SEK) respectively. The
of the trade-off design was smaller than in 44% of the designs, while its
was smaller than in 66% of the designs.
Discussion
The application of the decision-making framework helped to deal with difficulties in the selection of windows and blinds. The results obtained in this study differ from results presented by earlier studies such as Manzan and Padovan (Citation2015) and Ochoa et al. (Citation2012). This is because this study applies NSGA-II as an optimisation algorithm for analysis of the performance of multiple window and blind designs, while also exploiting the AHP as a MCDM method to select a design based on the trade-off between visual comfort, thermal comfort, energy consumption and life cycle cost. However, earlier studies mainly used an algorithm to optimise a single window or blind to improve visual or thermal comfort, energy consumption or life cycle cost. For example, Manzan and Padovan (Citation2015) designed two overhang panels with an additional internal venetian blind for an office room. The NSGA-II algorithm was later used to optimise two overhang panels in terms of annual primary energy consumption and the number of hours in which the internal venetian blind was deployed. The results presented show that overhang panels help to reduce annual primary energy consumption and daylight glare. However, the results in this study show that although an overhang panel is beneficial in terms of the amount of light, its performance does not help to reduce daylight glare. Furthermore, installation of an overhang panel contributes to a high present value due to the high cost of investment. Ochoa et al. (Citation2012) employed the NSGA-II algorithm to optimise window size in an office room, with respect to visual comfort and annual energy consumption. The results presented indicate that an approximate window-to-wall ratio for the south façade should be 60%, and between 50% and 60% for the west façade. However, the results in this study show that a window-to-wall ratio of 75% for the south façade and 68% for the west façade can be beneficial, improving visual and thermal comfort while also reducing energy consumption and cost.
Conclusion
Application of the decision-making framework permitted analysis of the performance of 20,000 window and blind designs. The results show that a combination of an external venetian blind and window type 1, with a U-value of 1.2 (W/m2. K), was the best window and blind design based on the trade-off between visual comfort, thermal comfort, energy consumption and life cycle cost.
This research found the decision-making framework to be a useful way of resolving conflicts through intelligent use of simulation in analyzing big-data in built environment, energy and cost sectors. Nowadays, the computation and processing power for performing simulations and optimizations is constantly increasing. Therefore, architects and designers can analyze a large variant of designs in a relatively short period of time and locate a trade-off design through an automated procedure. However, the decision-making framework allows solely analyzing objective criteria of visual comfort, thermal comfort, energy consumption and life cycle cost. Considering subjective issues relies therefore on architects’ and designers’ creativity, when designing windows and blinds.
Future work will involve the application of the decision-making framework for analysis of multiple window and blind designs along with various building envelopes, as well as heating, cooling and ventilation systems. This could involve application by researchers while working with building designers and/or application by designers as part of their design tasks, with monitoring and feeback to researchers for further practical development of the framework.
Acknowledgment
This study was performed as a part of ProWood PhD project, which was financed by the Knowledge Foundation [grant numbers 20130245]. The authors appreciate all for their contributions.
Disclosure statement
No potential conflict of interest was reported by the authors.
ORCID
Elaheh Jalilzadehazhari http://orcid.org/0000-0003-1835-7158
Jimmy Johansson http://orcid.org/0000-0003-0130-3356
K. Mahapatra http://orcid.org/0000-0003-4405-1056
Additional information
Funding
Notes
1. SEK: Swedish kronor
References
- Acosta, I., Munoz, C., Campano, M. A., & Navarro, J. (2015). Analysis of daylight factors and energy saving allowed by windows under overcast sky conditions. Renewable Energy, 77, 194–207. doi: 10.1016/j.renene.2014.12.017
- Altomonte, S. (2009). Daylight for energy savings and psycho-physiological well-being in sustainable built environments. Journal of Sustainable Development, 1(3), 4–16. doi: 10.5539/jsd.v1n3p3
- Atzeri, A. M., Cappelletti, F., Gasparella, A., & Tzempelikos, A. (2013). Office energy needs and indoor comfort with different types of external roller shades in a southern European climate. Proceedings of IBPSA, 13, 2626–2633.
- Avasoo, D. (2007). The european window energy labelling challenge. Proceedings of the European council for an energy efficient economy (ECEEE) summer study (pp. 4–9).
- Boyce, P., Hunter, C., & Howlett, O. (2003). The benefits of daylight through windows. Troy, New York: Rensselaer Polytechnic Institute.
- Bülow-Hübe, H. (2007). Solar shading and daylight redirection. (Report EBD-R-07/15). Lund, Sweden: Lund University.
- Carlucci, S., Cattarin, G., Causone, F., & Pagliano, L. (2015b). Multi-objective optimization of a nearly zero-energy building based on thermal and visual discomfort minimization using a non-dominated sorting genetic algorithm (NSGA-II). Energy and Buildings, 104, 378–394. doi: 10.1016/j.enbuild.2015.06.064
- Chan, Y.-C., & Tzempelikos, A. (2015). Daylighting and energy analysis of multi-sectional facades. Energy Procedia, 78, 189–194. doi:10.1016/j.egypro.2015.11.138.
- Chua, K. J. C., & Kiang, S. (2010). Evaluating the performance of shading devices and glazing types to promote energy efficiency of residential buildings. Building Simulation, 3, 181–194. doi: 10.1007/s12273-010-0007-2
- Chung, T., & Ng, R. (2016). The application of analytic hierarchy process in daylighting performance assessment. Indoor and Built Environment, 25(1), 50–68. doi:10.1177/1420326X14525061.
- De Carli, M. D. G. Valeria. (2009). Optimization of daylight in buildings to save energy and to improve visual comfort: Analysis in different latitudes. 11th international IBPSA conference (pp. 1797–1805). IBPSA Glasgow.
- Dubois, M.-C. (2001). Impact of shading devices on daylight quality in offices.simulations with radiance. Lund university. Lund: Sweden.
- Elitfonster. (2016). Retrieved from www.elitfonster.se
- Frontczak, M., Andersen, R. V., & Wargocki, P. (2012). Questionnaire survey on factors influencing comfort with indoor environmental quality in Danish housing. Building and Environment, 50, 56–64. doi:10.1016/j.buildenv.2011.10.012.
- González, J., & Fiorito, F. (2015). Daylight design of office buildings: Optimisation of external solar shadings by using combined simulation methods. Buildings, 5(2), 560–580. doi:10.3390/buildings5020560.
- Gustafsson, M., Dipasquale, C., Poppi, S., Bellini, A., Fedrizzi, R., Bales, C., … Holmberg, S. (2017). Economic and environmental analysis of energy renovation packages for European office buildings. Energy and Buildings, 148, 155–165. doi: 10.1016/j.enbuild.2017.04.079
- Gustafsson, M., Gustafsson, M. S., Myhren, J. A., Bales, C., & Holmberg, S. (2016). Techno-economic analysis of energy renovation measures for a district heated multi-family house. Applied Energy, 177, 108–116. doi: 10.1016/j.apenergy.2016.05.104
- Hadas, Y., & Nahum, O. E. (2016). Urban bus network of priority lanes: A combined multi-objective, multi-criteria and group decision-making approach. Transport Policy, 52, 186–196. doi: 10.1016/j.tranpol.2016.08.006
- Hotman, E. (2005). Base reference analytical hierarchy process for engineering process selection. International conference on knowledge-based and intelligent information and engineering systems (pp. 184–190). Springer.
- ISO7730-Standard. (2005). 7730. Ergonomics of the thermal environment—Analytical determination and interpretation of thermal comfort using calculation of the PMV and PPD indices and local thermal comfort criteria. Geneva, Switzerland: International Organization for Standardization.
- Jalilzadehazhari, E., Johansson, P., Johansson, J., & Mahapatra, K. (2018). Developing a decision-making framework for resolving conflicts when selecting windows and blinds. Architectural Engineering and Design Management. doi: 10.1080/17452007.2018.1537235
- Kämpf, J. H., Wetter, M., & Robinson, D. (2010). A comparison of global optimization algorithms with standard benchmark functions and real-world applications using EnergyPlus. Journal of Building Performance Simulation, 3(2), 103–120. doi: 10.1080/19401490903494597
- Karaguzel, O. T., Zhang, R., Lam, K. P., & Perlman, J. (2003). Coupling of whole-building energy simulation and multi-dimensional numerical optimization for minimizing the life cycle costs of office buildings. Building Simulation, 7, 111–121. doi: 10.1007/s12273-013-0128-5
- Kats, G., Alevantis, L., Mills, E., & Perlman, J. (2003). The costs and financial benefits of green buildings: A report to California’s sustainable building task force. California. Retrieved from http://evanmills.lbl.gov/pubs/pdf/green_buildings.pdf
- Lee, E. S., & Tavil, A. (2007). Energy and visual comfort performance of electrochromic windows with overhangs. Building and Environment, 42(6), 2439–2449. doi:10.1016/j.buildenv.2006.04.016.
- Mainini, A. G., Bonato, D., Poli, T., & Speroni, A. (2015). Lean strategies for window retrofit of Italian office buildings: Impact on energy use, thermal and visual comfort. Energy Procedia, 70, 719–728. doi: 10.1016/j.egypro.2015.02.181
- Mangkuto, R. A., Rohmah, M., & Asri, A. D. (2016). Design optimisation for window size, orientation, and wall reflectance with regard to various daylight metrics and lighting energy demand: A case study of buildings in the tropics. Applied Energy, 164, 211–219. doi: 10.1016/j.apenergy.2015.11.046
- Månsson, L., & Schönbeck, Å. (2003). Light & Room, guide for planning of indoor lighting [In Swedish: Ljus & rum: planeringsguide för belysning inomhus]. Stockholm, Sweden: Ljuskultur.
- Manzan, M., & Padovan, R. (2015). Multi-criteria energy and daylighting optimization for an office with fixed and moveable shading devices. Advances in Building Energy Research, 9(2), 238–252. doi:10.1080/17512549.2015.1014839.
- Monghasemi, S., Nikoo, M. R., Fasaee, M. A. K., & Adamowski, J. (2015). A novel multi criteria decision making model for optimizing time–cost–quality trade-off problems in construction projects. Expert Systems with Applications, 42(6), 3089–3104. doi:10.1016/j.eswa.2014.11.032.
- National board of housing building and planning. (2002). Regulations of national board of housing building and planning regarding changes to the building’s building rules, [In Swedish: Boverkets föreskrifter om ändring i verkets byggregler]. Karlskrona, Sweden: National board of housing, building and planning, [In Swedish: Boverket].
- National board of housing building and planning. (2015). Building regulation [In Swedish: Boverkets byggregler, BFS 2011: 6 med ändringar till och med 2015: 3]. National board of housing, building and planning. [In Swedish: Boverket].
- Nikoofard, S., Ugursal, V. I., & Beausoleil-Morrison, I. (2014). Technoeconomic assessment of the impact of window shading retrofits on the heating and cooling energy consumption and GHG emissions of the Canadian housing stock. Energy and Buildings, 69, 354–366. doi:10.1016/j.enbuild.2013.11.023.
- O’Brien, W., Kapsis, K., & Athienitis, A. K. (2013). Manually-operated window shade patterns in office buildings: A critical review. Building and Environment, 60, 319–338. doi:10.1016/j.buildenv.2012.10.003.
- Ochoa, C. E., Aries, M. B. C., van Loenen, E. J., & Hensen, J. (2012). Considerations on design optimization criteria for windows providing low energy consumption and high visual comfort. Applied Energy, 95, 238–245. doi: 10.1016/j.apenergy.2012.02.042
- Ordouei, M. H., Elkamel, A., Dusseault, M. B., & Alhajri, I. (2015). New sustainability indices for product design employing environmental impact and risk reduction: Case study on gasoline blends. Journal of Cleaner Production, 108(Part A), 312–320. doi:10.1016/j.jclepro.2015.06.126.
- Pourshaghaghy, A., & Omidvari, M. (2012). Examination of thermal comfort in a hospital using PMV–PPD model. Applied Ergonomics, 43(6), 1089–1095. doi: 10.1016/j.apergo.2012.03.010
- Rodriguez, R., Yamín Garretón, J., & Pattini, A. (2016). Glare and cognitive performance in screen work in the presence of sunlight. Lighting Research & Technology, 48(2), 221–238. doi: 10.1177/1477153515577851
- Saaty, T. L. (2008). Decision making with the analytic hierarchy process. International Journal of Services Sciences, 1(1), 83–98. doi: 10.1504/IJSSCI.2008.017590
- SageGlass. (2018). Retrieved from https://www.sageglass.com/en
- Sbar, N. L., Podbelski, L., Yang, H. M., & Pease, B. (2012). Electrochromic dynamic windows for office buildings. International Journal of Sustainable Built Environment, 1(1), 125–139. doi: 10.1016/j.ijsbe.2012.09.001
- Singh, R., Lazarus, I., & Kishore, V. (2015). Effect of internal woven roller shade and glazing on the energy and daylighting performances of an office building in the cold climate of shillong. Applied Energy, 159, 317–333. doi:10.1016/j.apenergy.2015.09.009.
- Suga, K., Kato, S., & Hiyama, K. (2010). Structural analysis of Pareto-optimal solution sets for multi-objective optimization: An application to outer window design problems using multiple objective genetic algorithms. Building and Environment, 45(5), 1144–1152. doi: 10.1016/j.buildenv.2009.10.021
- Swedish Energy Agancy. (2017). Energy situation [Title in Swedish: Energiläget]. Bromma, Sweden: S. e. agancy.
- Swedish Standard Institute. (2011). SS-EN 12464-1:2011. Light and lighting – Lighting of work places –Part 1: Indoor work places [In Swedish: Ljus och belysning – Belysning av arbetsplatser –Del 1: Arbetsplatser inomhus].
- Tsikaloudaki, K., Laskos, K., Theodosiou, T., & Bikas, D. (2012). Assessing cooling energy performance of windows for office buildings in the Mediterranean zone. Energy and Buildings, 49, 192–199. doi: 10.1016/j.enbuild.2012.02.004
- Warema. (2018). Retrieved from https://www.warema.com/en/
- Wetter, M., & Wright, J. (2003). Comparison of a generalized pattern search and a genetic algorithm optimization method. Proceedings of the 8th international IBPSA conference, Eindhoven, Netherlands (pp. 1401–1408).
- Wright, J. A. M. Monjur (2009). Geometric optimization of fenestration.
- Zemella, G., De March, D., Borrotti, M., & Poli, I. (2011). Optimised design of energy efficient building façades via evolutionary neural networks. Energy and Buildings, 43(12), 3297–3302. doi: 10.1016/j.enbuild.2011.10.006
- Zhang, F., & Dear, R. (2017). University students’ cognitive performance under temperature cycles induced by direct load control events. Indoor Air, 27(1), 78–93. doi: 10.1111/ina.12296