
 ?Mathematical formulae have been encoded as MathML and are displayed in this HTML version using MathJax in order to improve their display. Uncheck the box to turn MathJax off. This feature requires Javascript. Click on a formula to zoom.
ABSTRACT
The requirement for natural ventilation strategies in classrooms to perform in respect to both their inherent and adaptive capacity is necessary to mitigate the risk of transmission associated with infectious airborne pathogens such as COVID-19. This paper assesses the performance of ten classrooms considering (a) the designed versus actual ventilation capacity; (b) the probability of airborne disease transmission by unit time resulting from calculated ventilation rates and (c) the reduction of transmission risk associated with mask wearing by all occupants. Monitored air changes per hour (ACH) range from 0.26–1.7, demonstrating that none of the classrooms meet designed ventilation rate whilst in operation. If the designed ventilation rate of 5 ACH were to be achieved, it would represent an infection risk of less than 1% during standard class durations and 5% over an 8-hour school day. The minimum achieved ventilation rate represents an infection risk of 7–12% (per class) and 75–100% (per school day) dependent on classroom specific parameters. Protection is afforded by the wearing of masks within the indoor school setting. During specified class durations in settings with sub-optimal ventilation rates, probability of infection can be reduced from 7–12% to 1–5%. Over an 8-hour school day, probability of infection can be reduced from 75–100% to 18–43%. These reductions are possible dependent on mask choice.
Introduction
Severe acute respiratory syndrome coronavirus 2 (SARS-CoV-2) is the pathogen that is responsible for COVID-19, an infectious pneumonia that first appeared in late 2019 in Wuhan, China (Huang et al., Citation2020; Zhu et al., Citation2020). Infection is thought to be facilitated via large-drop transmission from the mouth or nose of an infected person to the mouth, nose, or eyes of the recipient, fomite transmission via physical contact with droplets deposited on surfaces which are subsequently ingested, or airborne transmission via the inhalation of aerosolised droplets (Bazant & Bush, Citation2021; Wei & Li, Citation2016). Therefore, the respiratory activities of an infected person, such as breathing, talking, sneezing, and coughing are major sources of respiratory pathogens (Stadnytskyi, Anfinrud, & Bax, Citation2021; Wei & Li, Citation2016) with the expulsion of up to 40,000 droplets at a velocity of 100 m/s during a sneeze (Cole & Cook, Citation1998).
It is understood that whilst the airborne transmission potential of COVID-19 is not universally acknowledged (Ram et al., Citation2021), it is widely accepted that aerosol transmission routes can facilitate the inhalation of small droplets exhaled by an infected person (Buonanno, Stabile, & Morawska, Citation2020; Jayaweera, Perera, Gunawardana, & Manatunge, Citation2020; Lednicky et al., Citation2020; Li, Leung, & Tang, Citation2007; Miller et al., Citation2021; Morawska & Cao, Citation2020; Morawska & Milton, Citation2020; Wang & Du, Citation2020). Immediately after droplets are expired, the liquid content starts to evaporate, and some droplets become so small that transport by air current affects them more than gravitation (Morawska et al., Citation2009). These become droplet nuclei, which suspend in the air or are transported away by room airflow (Li et al., Citation2007) which can potentially infect susceptible members of the population. Theoretical models of airborne disease transmission (Riley, Murphy, & Riley, Citation1978; Wells, Citation1955) have been applied to demonstrate the spread of COVID-19 (Buonanno et al., Citation2020; Liao, Chang, & Liang, Citation2005; Rudnick & Milton, Citation2003), establishing that the rate of transmission is inversely proportional to the ventilation rate per susceptible occupant (Mikszewski, Stabile, Buonanno, & Morawska, Citation2021; Sun & Zhai, Citation2020; Wells, Citation1955).
Current ventilation design guidelines within Irish schools are based on a minimum ventilation rate per person (Department of Education and Science, Citation2004). Ventilation refers to the process of introducing and distributing outdoor and/or properly treated recycled air into a building or a room (Etheridge & Sandberg, Citation1996) and is the process by which concentrations of potentially harmful pollutants are diluted and removed from a space (CIBSE, Citation2006). Inadequate ventilation has previously been identified as an issue within schools (Fisk, Citation2017) but historically, little attention has been paid to contaminant levels in indoor environments such as school classrooms (Ding, Zhang, & Bluyssen, Citation2022). Conversely, Li et al. (Citation2007) notes that there is strong and sufficient evidence of the association between ventilation, the control of airflow direction in buildings, and the transmission and spread of infectious diseases. Specifically, there is a positive association between the frequency of virus detection in air filters, and the background-adjusted carbon dioxide (CO2) concentrations of 1000 parts per million (ppm) and above (Myatt et al., Citation2004).
The purpose of this research is to assess the ability of classrooms within the built environment to perform in respect to their designed ventilation strategy, which is necessary requirement to mitigate the risk of transmission associated with infectious airborne pathogens such as SARS-CoV-2. Transmission is considered in respect to the occupant demographic and the activities performed within the classroom. This includes the number, sex, and CO2 generation potential of occupants. Pandemic control measures that were introduced by the Department of Education (Department of Education, Citation2020) in respect to COVID-19 prevailed are also considered. This included ensuring that windows and doors remain open for the duration of the school day and that students and staff wear masks at all times. This blanket approach, variations of which have been adopted worldwide, corresponds with limiting egress of potentially infectious respiratory droplets whilst offering protection to the mask wearer by reducing ingress of virus-laden aerosol (Stadnytskyi et al., Citation2021).
This study seeks to assess (a) the designed versus actual ventilation capacity of classrooms within the built environment; (b) the probability of airborne disease transmission by unit time resulting from calculated ventilation rates and (c) the reduction of transmission risk associated with mask wearing by all occupants.
Materials and methods
Classroom typology
Irish post primary schools are typically ventilated by natural means through the adoption of generic repeat designs (Dolan, Citation2007; Sheppard, Citation2011) that adopt the use of passive energy measures to achieve a comfortable internal environment. This approach is in-line with the ventilation strategy set out in Technical Guidance Document 002 (Mechanical & Electrical Building Services Engineering Guidelines For Post Primary School Buildings) which considers that classroom ventilation shall be natural ventilation by means of permanent wall vents and windows with opening sections (Department of Education and Science, Citation2004). It is a requirement of the Department of Education that ventilation strategies in schools are designed in accordance with the prevailing Building Regulations and the Chartered Institute of Building Services Engineers (CIBSE) Design Guides (Department of Education and Science, Citation2004), and are designed to suit the class environment having regard to the high levels of occupancy generally (Department of Education and Science, Citation2004). There are 730 such schools in the Republic of Ireland catering for c. 405,003 students (Central Statistics Office, Citation2021).
This study involved the monitoring of ten naturally ventilated classrooms within two post-primary schools in Dublin. The selected schools are considered to be representative of the wider available stock of post-primary school buildings, which are naturally ventilated by design (Department of Education and Science, Citation2004; Dolan, Citation2007; Sheppard, Citation2011). Natural ventilation can be characterised by the use of a single-sided or cross ventilation strategy and is facilitated by both background ventilation and occupant-led purge strategies (such as opening windows and doors). Both strategies are adopted by the schools under review.
School A is a single sex (male) post-primary school occupied since 1965. Students are aged from 13 to 18 years. The school operates a ‘home room’ policy where students remain in-situ, whilst the teachers move from classroom to classroom. Classrooms in the school are single-aspect and naturally ventilated utilising a cross-ventilation strategy. Each monitored classroom follows the same design (; ), windows along the length of an external wall with the entrance/egress door on the opposite wall. One-third of each window incorporates an opening section (middle section) with the remainder being fixed panels of glass.
Figure 1. School A – classroom design.
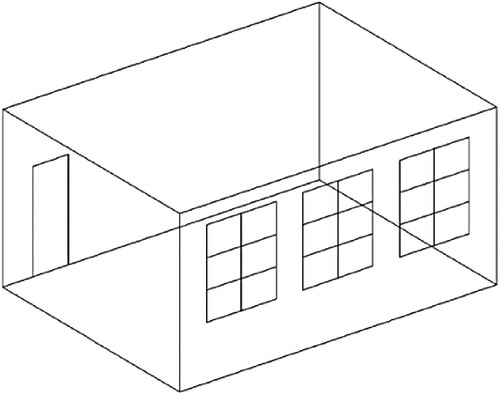
Table 1. Classroom sizes and occupancy details.
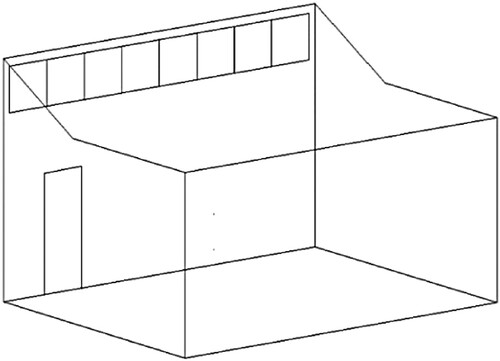
School B is a single sex (male) post primary school occupied since 1967. Students are aged from 13 to 18 years. In this instance, the teachers remain stationary whilst the students move from classroom to classroom. Classrooms in that school are single-aspect and naturally ventilated utilising a single-sided ventilation strategy. Each monitored classroom follows the same design (; ); high level, clerestory windows in a vertical vaulted section above the roof valley line with the entrance/egress door below on the same wall. is indicative of the glazing layout. Classrooms have eight or nine sections of glazing (depending on room length) with every other section of glazing a top-hung openable sash.
Figure 2. School B – classroom design.
CO2 concentration, temperature and occupancy levels were monitored daily in each classroom, over a six-week period during the heating season. Both schools within the study were following Department of Education advice in respect to COVID-19 guidelines (Department of Education, Citation2020) that were in force at the time.
Devices
ELSYS ERS CO2 sensors were utilised for data collection. Each wall mounted sensor measures CO2 levels, temperature, humidity, light, and motion within the indoor environment. The CO2 sensor has an internal automatic calibration routine. This routine calibrates the sensor to set 400 parts per million (ppm) to the lowest value that has been read in the last period of approximately eight days. Each sensor has a calibrated range of 0–2000ppm and an extended range of 0–10,000 ppm. Accuracy within the calibrated range is ± 50 ppm / ± 3% of reading. Accuracy within the extended range is ± 10% of reading. Accuracy is met at 10–40°C, 0–60%RH, after minimum three performed automatic baseline corrections, preferably spanning eight days in-between. To facilitate this research, data collection commenced 24 days post fitting of the last sensor, thereby ensuring the accuracy of all sensors.
One sensor was used per classroom. Each sensor was placed on the wall opposite the windows at 2.0 m off the finished floor level and in the middle of the wall. The decision in respect to the height of each sensor was made due to the age of the students and the consideration that the devices may be tampered with at a lower level. There are no display screens and students were not made aware of their significance or measurement capabilities. It is of note that no sensor was tampered with over the duration of the study. It is considered that the positioning of the sensors above the breathing zone avoided the collection of non-uniform measurements of CO2 in air directly exhaled by building occupants.
Data was collected wirelessly at 10-minute intervals, 24 h per day in all monitored classrooms. To facilitate analysis, dataset A was cleaned to span from 07:40 (1 h prior to school commencement) to 16:40 (1 h post school completion) each school day for a six-week period (18 November 2021–17 December 2021). These dates and times are referred to as the ‘occupied period’ in respect to this study. Dataset B (collected during the same period) was cleaned to span from 16:40 to 07:40. These dates and times are referred to as the ‘unoccupied period’.
Ventilation rates
Ventilation rates are calculated using CO2 as a tracer gas. CO2 is a by-product of human metabolism and exists in high levels in exhaled air. It cannot be filtered, adsorbed, or absorbed (Awbi, Citation2020), therefore it is a suitable reference point when considering actual internal air change rates. Analysis of the rate of CO2 concentration decay, which is directly dependent on the natural ventilation capacity of the classrooms, will allow an estimate of the ventilation rate. One complete air change is said to occur when 63% of airborne contaminants have been replaced with outdoor air (Fernstrom & Goldblatt, Citation2013a; Huang et al., Citation2021; Nardell, Keegan, Cheney, & Etkind, Citation1991), this rises to 97% at six air changes per hour (ACH) (Jimenez, Citation2020) demonstrating the importance of appropriate ventilation rates in indoor settings. The following equation (Huang et al., Citation2021) is used to calculate the ventilation rate in ACH per classroom from peak CO2 levels:
(1)
(1) where: T1 = initial time where indoor CO2 is at peak level; T2 = time (min) when excess CO2 is reduced by 63%
Indoor CO2 at peak level (CS) is the sum of ambient CO2 (CR) and excess CO2 (CE) generated by the room occupants. CO2 measurement starts at peak level, therefore T1 is always 0. The time that is needed to remove 63% CE (T2) is the time point where the indoor CO2 level is:
Ambient CO2 levels (CR) were calculated during unoccupied periods that were not immediately preceded by an occupied period, such as a bank or public holiday at the start of a week, to ensure that accurate data could be assumed. Mean levels during these periods vary from 386 ppm to 417 ppm. For this research, ambient CO2 levels have been set at 400 ppm.
CO2 generation
Active CO2 generation within each classroom is calculated using formulas proposed by Coley and Beisteiner (Citation2002). Male teacher CO2 generation, , is signified by the letter k (female teacher CO2 generation is considered to be 0.9k). As the focus of this section of the study is optimum occupancy levels in each classroom, the increased CO2 generation rate of a male teacher will be used as an indicator of the worst-case scenario.
The formulae are as follows:
(2)
(2)
(3)
(3) where:
and
= carbon dioxide generation rate (l/h); A = pupil age (years); m = metabolic rate (W/m2) of the standard adult;
= body surface area (m2); Tr = room temperature (◦C)
Metabolic heat production is largely dependent on activity. The in-class activity for a teacher consists of a mixture of specific activities which have varying metabolic rates. The rates for class-based activities are as follows (CIBSE, Citation2015):
Walking = 2.0
Standing, relaxed = 1.2
Reading, seated = 1.0
Assuming that during a typical class, a teacher is walking for 20% of the time, standing for 20% of the time and reading/seated for 60% of the time, the metabolic rate is as follows:
A metabolic rate of 1.24 corresponds with heat generation of 72.33 W/m2 (CIBSE, Citation2015).
Body surface area (BSA) () is calculated from the Mosteller formula, which has proven to be the most accurate of BSA formulas (Orimadegun & Omisanjo, Citation2014; Sigurdsson & Lindberg, Citation2020). The Mosteller formula uses height and weight to calculate BSA and is as follows:
(4)
(4) where: H = height in cm., W = weight in kg.
Height and weight by age are retrieved from UK World Health Organisation growth charts (Royal College of Paediatrics and Child Health, Citationn.d.).
CO2 generation rates and BSA are calculated using the formulae referenced above. Mean monitored temperature (Tr) was calculated as 17 degrees Celsius (School A) and 19 degrees Celsius (School B). demonstrates the CO2 generation rate in litres per hour (l/h) for both teacher and students during classes of 40-minute (School A) and 60-minute (School B) durations.
Table 2. BSA and CO2 generation rate of children.
Risk of indoor airborne transmission
The rate of transmission of airborne infectious disease is inversely proportional to the ventilation rate per susceptible occupant (Wells, Citation1955). The Wells–Riley equation (Riley et al., Citation1978), is commonly used to model the risk of indoor airborne transmission of infectious diseases. It is subject to limitations as it (a) assumes steady-state conditions and (b) requires measurement of outdoor air supply rates. Steady state implies that an infectious particle has an equal chance of being anywhere within a building indoor air environment, regardless of when and where it was generated. This is unlikely to be absolutely true, as the concentration of infectious particles at the breathing zone may vary depending on the air distribution pattern within the room and the location of the infector. This research considers active CO2 loading and subsequent decay within occupied classrooms as indicators of the room specific ventilation rate. Calculations of probability of airborne infection are made on a classroom-by-classroom basis, as opposed to the complete building. CO2 sensors are positioned above the breathing zone, therefore the well-mixed steady-state assumption is considered acceptable.
The Wells-Riley equation is as follows:
(5)
(5) where: P = probability of infection for susceptibles; C = number of disease cases; S = number of susceptibles in the population; I = number of infectors in the population; p = breathing rate per person (
/s); q = quantum generation rate by an infected person (quanta/s); t = total exposure time (s); Q = outdoor air supply rate (
/s)
Classroom air supply rates (Q) are converted from measured ACH using the following equation:
(6)
(6) where: l/s = litres per second supply; ach = air changes per hour; v = volume of classroom.
The Wells–Riley equation is based on the concept of a ‘quantum of infection’. A quantum is defined as the hypothetical infectious dose unit that may consist of one or more airborne particles which are assumed to be randomly distributed throughout the air of confined spaces (Guo et al., Citation2021). One quantum will cause infection in 63% of susceptibles (Hella et al., Citation2017; Riley et al., Citation1978). Few studies have identified quanta/s for COVID-19 as it is typically back-calculated post pandemic from epidemiological studies (Riley et al., Citation1978). Dai and Zhao (Citation2020) inferred a quantum generator rate by a COVID-19 infector with a fitted correlation between the reproductive (R) number and quantum generator rate for several typical infectious diseases (tuberculosis, MERS, SARS, influenza, and measles). This resulted in an assumed q value for COVID-19 of 48 quanta/h in a classroom setting. As the focus of this research is to assess the effectiveness of the ventilation strategy within the classroom, the q value of 48 quanta/h is adopted.
The breathing rate for children is assumed to be 0.38 m3/h (Fontes, Reyes, Ahmed, & Kinzel, Citation2020). One infector is considered present within each classroom, with the remaining occupants susceptible to infection. The total exposure time is each class duration. ACH are applied on a sliding scale from 0 to 6 ACH, which is representative of the collected data. Mean levels of classroom occupancy are calculated for each school.
Risk reduction associated with the wearing of masks
Andrejko (Citation2022), building on earlier work by Fennelly and Nardell (Citation1998), found that consistent use of masks in indoor public settings was associated with significantly lower adjusted odds of a positive test result compared with not wearing any face mask or respirator. Findings were published by way of an adjusted odds ratio that can be applied to each mask type, namely cloth masks (adjusted odds ratio = 0.44), surgical masks (adjusted odds ratio = 0.34) or an N95/KN95 respirators (adjusted odds ratio = 0.17). These findings are similar to other studies (Brooks & Butler, Citation2021; Chughtai, Seale, & Macintyre, Citation2020) and demonstrate that consistently wearing a face mask or respirator in indoor settings reduces the risk of acquiring COVID-19.
As noted, the COVID-19 protection measures adopted by all schools aim to reduce transmission through mask wearing. Sze To and Chao (Citation2010) demonstrate that is possible to incorporate a parameter in the Wells-Riley equation that would indicate the benefits of mask wearing, as the Iqpt/Q term within the Wells-Riley equation refers to the intake dose with a single unit of quantum. Therefore, the effect of protection offered can be considered by multiplying this term by a fraction, R (Fennelly & Nardell, Citation1998; Nazaroff, Nicas, & Miller, Citation1998).
The modified Wells-Riley equation is as follows:
(7)
(7) where: R = 1 when no respirator is used.
Results and discussions
Designed versus actual air change rate
Natural ventilation is facilitated by both background ventilation and occupant-led purge strategies. As such, it is important to consider the designed v. actual air change rate within the monitored classrooms. This is calculated during the unoccupied period when no active CO2 loading is taking place, so that we can understand the ventilation capacity of each classroom. During the unoccupied period, the windows and doors were closed in School A with the relatively inaccessible high-level windows remaining open and the doors closed in School B (see ). Both Schools reported low temperatures as a result of complying with the aforementioned Department of Education COVID-19 protection measures that were active during the monitored period. It is suggested that, outside of specific COVID-19 measures, all windows are not generally opened during the heating season and that the effective air change rates that are achieved fall somewhere between those reflected in and plotted in and . The results demonstrate that the ventilation requirements of 5 ACH (Department of Education, Citation2021a) are never achieved in either scenario, therefore highlighting the existence of a significant performance gap. It is noteworthy that the monitored classrooms in School A display a significant level of airtightness when unoccupied, with all windows and doors closed. It demonstrates the absence of uncontrolled infiltration channels and re-enforces the need for active, occupant-led behaviours (opening doors and windows) on a daily basis to ensure that the maximum attainable ventilation rate is achieved.
Figure 3. School A – ACH when unoccupied with windows and door closed.
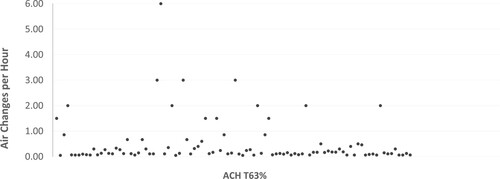
Figure 4. School B – ACH when unoccupied with doors closed and windows open.
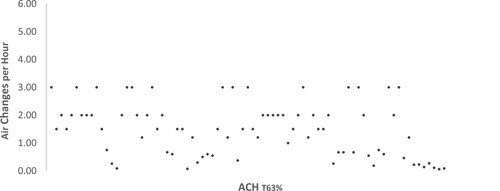
Table 3. Designed v. Actual ACH.
It is important to note that the design requirements refer to sedentary environments (see section 2.4) and do not apply to areas or occasions of substantial physical activity (CIBSE, Citation2015). The minimum requirement for 27 occupants of 3 l/s per person based on CIBSE requirements (CIBSE, Citation2016) is achieved for one classroom, though this is when all available windows are open.
Measured CO2 levels
It is not possible to correlate CO2 levels with overall indoor air quality, as many indoor pollutants are not linked to human occupancy patterns. However, studies have indicated that respiratory symptoms may occur when indoor CO2 is above 1000 ppm (Azuma, Kagi, Yanagi, & Osawa, Citation2018; Simoni et al., Citation2010), reinforcing the position that this value is considered an indicator of adequate ventilation per person, within an internal environment (ASHRAE, Citation2022). The focus of this research study is the inherent and adaptive capacity of the designed ventilation strategy within the monitored classrooms to remove infectious disease particles from indoor air, therefore 1000 ppm is considered an appropriate threshold level upon which to base findings.
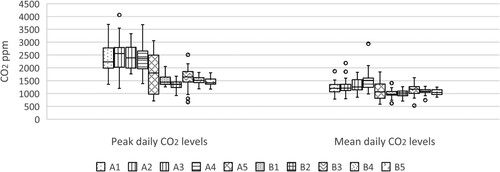
Classrooms in School A are identified as A1–A5 with School B as B1–B5. Both schools incorporate a class free period on Wednesday afternoon. Whilst some after school activities were scheduled at this time, they were sporadic in both nature and attendance. As such, data collected on Wednesday afternoons has been removed from the analysis. Bank holidays that arose during the monitoring period were also removed. demonstrates the peak and mean CO2 levels (per day per classroom) over the 6-week monitoring period. It demonstrates that mean levels are generally in excess of the recommended 1000 ppm for classroom settings (CIBSE, Citation2004). These results are a matter of concern as high CO2 levels indicate inadequate ventilation at a time when all windows and doors were open. It is accepted that natural ventilation is dependent on external conditions, though the consistent high CO2 levels suggest it is an unsuitable strategy to adopt within educational settings. It is further considered that the monitored levels will rise when the requirement to open windows and doors ceases.
Figure 5. Daily peak and mean CO2 levels over the monitored period.
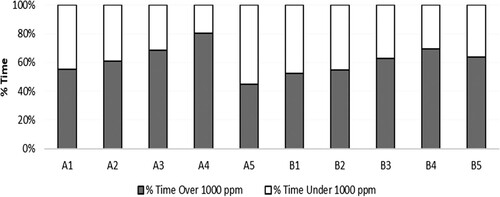
demonstrates the percentage of CO2 measurements in respect to time spent in excess of 1000 ppm in all 10 classrooms over the duration of the occupied period. 61% of total CO2 measurements collected during the occupied period are above 1000 ppm. This is similar to the results of other studies (Al-Hubail & Al-Temeemi, Citation2015; Bakó-Biró, Clements-Croome, Kochhar, Awbi, & Williams, Citation2012; Choe et al., Citation2020; Coley & Beisteiner, Citation2002; Corsi, Torres, Sanders, & Kinney, Citation2013; Dijken, Bronswijk, & Sundell, Citation2005; Fisk, Citation2017; Fromme et al., Citation2008) across differing jurisdictions (Ireland, UK, Germany, South Korea, America, Kuwait and the Netherlands) irrespective of ventilation strategies. It is accepted that these studies did not incorporate the specific COVID-19 protection measures utilised within this research, however, they do seem to suggest that there is a significant variation in the designed performance and operational ability of ventilation strategies within indoor school settings.
Figure 6. All classrooms – % time that CO2 levels are under & over 1000 ppm.
Ventilation performance when occupied
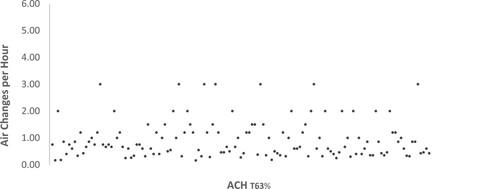
The effective air change rates for the occupied period (during times of active CO2 loading) in both schools are plotted in and . Mean ACH of 1.37 (School A: 71% of all calculated ACH ≤ 2) and 0.94 (School B: 86% of all calculated ACH ≤ 2) are calculated for this period. These results are lower than the 5 ACH Department of Education requirement (Department of Education, Citation2021a) or 4.5–5 ACH CIBSE volume-based requirement for classrooms (CIBSE, Citation2004). These results are enhanced by the adoption of Department of Education advice in respect to COVID-19 guidelines (Department of Education, Citation2020) that were in force at the time, which ensured that all windows and doors remained open for the duration of the school day. However, it should be noted that this is considered to be an occupant-led purge strategy that should provide 8 l/s per person rapid ventilation.
Figure 7. School A – ACH when occupied.
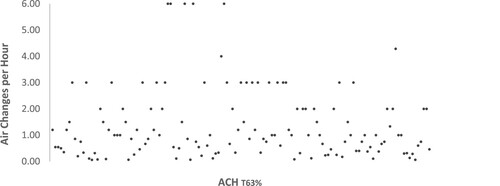
Figure 8. School B – ACH when occupied.
This represents a significant risk, as numerous studies have shown that exhaled air from infected patients contains respiratory disease pathogens, including rhinovirus, influenza, and tuberculosis (Fabian, McDevitt, Lee, Houseman, & Milton, Citation2009; Issarow, Mulder, & Wood, Citation2015; Lindsley et al., Citation2016) in the form of infectious particles that can be transmitted via inhalation of exhaled air (Fernstrom & Goldblatt, Citation2013; Stadnytskyi et al., Citation2021). Failure to adequately ventilate such pathogens within classrooms creates a risk for all occupants.
Body surface area and CO2 generation rate
CO2 generation levels for all monitored classrooms are detailed in . Classrooms in School A are specific to year groups (1st year, 2nd year, 3rd year, etc.), therefore age can be associated with each calculation. Classrooms in School B are utilised by all students at differing times, therefore the mean age of 15 is used for each calculation. It is accepted that the weight, activity, and diet of the occupants will affect the indoor CO2 generation rates, and that each of these parameters can only be estimated based on the average student. Certain activity levels are assumed in respect to metabolic activity.
Table 4. Occupant generated CO2 by class duration.
The CO2 generation level of students is calculated as a fraction of that of a male teacher (k) who is assumed to be walking for 20% of the time, standing for 20% of the time and reading/seated for 60% of the time during a typical class. This assumption is accepted as the activity within a classroom is considered to generally be sedentary in nature.
CO2 generation rates are calculated based on 60-minute classes in School A and 40-minute classes in School B. Overall occupancy levels for each classroom are not excessive. Department of Education requirements for adequate teaching spaces seek a minimum of 1.95m2 per student within general classrooms (Department of Education, Citation2021b). Classrooms within this study range from 1.86m2 to 2.84m2 per student (see ). The results demonstrate that the CO2 generation rates within the monitored classrooms are not excessive and would be appropriate should the designed ACH be achieved.
Risk of airborne infection
and demonstrate the probability of airborne infection during 60-minute classes in School A and 40-minute classes in School B respectively. It is demonstrated that if the designed 5 ACH were to be achieved, it would represent an infection risk of less than 1% during both class durations. However, the minimum calculated ACH represents an infection risk of 10-12% in School A and 7-8% in School B. and demonstrate the probability of airborne infection during an 8-hour day in School A and School B respectively. It is demonstrated that were the designed 5 ACH achieved, it would represent an infection risk of 5% whilst the minimum calculated ACH represents an infection risk of 75-100% in School A and 85-100% in School B.
Figure 9. School A – probability of infection during standard 60-minute class at reduced ACH levels.

Figure 10. School B – probability of infection during standard 40-minute class at reduced ACH levels.
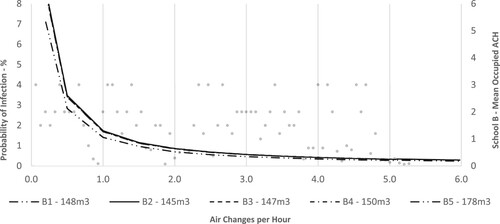
Figure 11. School A – probability of infection during an 8-hr school day at reduced ACH levels.
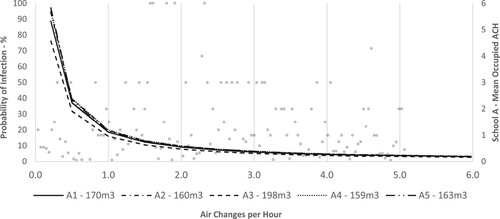
Figure 12. School B – probability of infection during an 8-hr school day at reduced ACH levels.
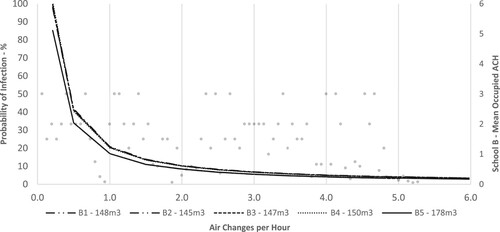
Overall, the probability of infection rises as ACH reduces. All graphs have been overlaid with the calculated mean ACH (secondary axis) during the occupied period(s). As noted, the majority of all calculated rates were 2 ACH or lower (School A – 71%; School B – 86%). This demonstrates a significant infection risk in classrooms where the actual ventilation performance does not meet the designed requirements. The percentage probability of airborne infection in classrooms A3 and B5 is lower due to these rooms availing of greater volume at an occupancy level that remains relatively consistent with the other classrooms.
These findings are significant when it is considered that one quantum will cause infection in 63% of susceptibles (Hella et al., Citation2017; Riley et al., Citation1978). Therefore where ventilation rates are low it is necessary for classrooms to be vacated fully after each use and all break periods, whilst ensuring that all windows and doors remain open, to maximise the ventilation capacity of each individual classroom and to reduce infection risk.
Reduction of transmission risk associated with mask wearing
The Department of Education COVID-19 protection measures that were in place over the duration of this research requested that (a) all occupants wear masks whilst (b) those with symptoms remain at home, undertake a polymerase chain reaction (PCR) test and, if positive, adhere to isolation requirements for a defined period of time (Department of Education, Citation2020). However, it is estimated that at least 50% or more of transmissions of COVID-19 are from individuals who never develop symptoms or those who are in the pre-symptomatic phase (Johansson et al., Citation2021). Wearing of masks within school settings is advised as a protective measure to negate against this unknown unknown.
The adjusted odds ratios, proposed by (Andrejko, Citation2022), were applied to the modified Wells-Riley equation to calculate the effect of protection offered by differing mask types. demonstrates the probability of infection per susceptible occupant in a 60 or 40-minute class in School A and B respectively, whilst demonstrates the probability of infection in each classroom during an 8-hour day. Both are calculated at adjusted odds ratios of R = 0.44 (cloth mask), R = 0.34 (surgical mask), and R = 0.17 (N95/KN95 respirators) and based on one infector being present in each room. The probability is calculated for each classroom within each school at each ratio, with the resulting data aggregated by school and ratio.
Figure 13. Probability of infection at adjusted odds ratios during standard 60-minute (School A) and 40-minute (School B) class.
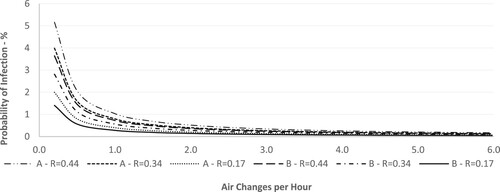
Figure 14. Probability of infection at adjusted odds ratios in both Schools during 8-hour day.
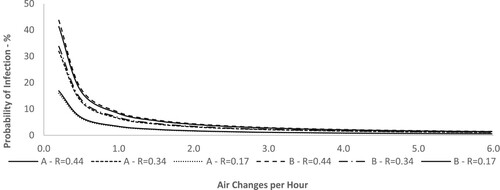
The results demonstrate that protection is afforded by the wearing of masks. During specified class durations in settings with sub-optimal ventilation rates, the probability of infection can be reduced from 7–12% to 1–5%. Over an 8-hour school day, probability of infection can be reduced from 75–100% to 18–43%. There is a significant difference when compared with the previous discussion, which relied solely on ventilation within the classrooms to reduce the possibility of airborne infection. It is demonstrated that protection is afforded by all masks, with N95/KN95 respirators performing best to prevent infection risk to susceptible occupants. Similar results were reported by Stadnytskyi et al. (Citation2021) finding that a carrier’s mask results in 25% leakage of respiratory droplets, therefore the risk that a bystander inhales particles from a masked carrier drops fourfold. If the exposed contact also wears a mask, with an estimated ingress filtering efficiency of 50%, the aggregate infection probability is reduced eightfold.
Conclusion
The requirement for natural ventilation strategies in classrooms within the built environment to perform in respect to both their inherent and adaptive capacity is necessary to mitigate the risk of transmission associated with infectious airborne pathogens. This is also linked to the main and larger goal of keeping schools open and occupants safe during the present, and potential future, pandemic(s). Irish schools are generally ventilated by natural means through the adoption of generic repeat designs (Dolan, Citation2007; Sheppard, Citation2011) therefore it is considered that the findings of this research study can be extrapolated to apply to all schools (including those in other countries) where the same design conditions, occupancy rates, and ventilation strategies exist.
This research has demonstrated that the designed ventilation rate is rarely achieved. This is similar to the results of other studies (Al-Hubail & Al-Temeemi, Citation2015; Bakó-Biró et al., Citation2012; Choe et al., Citation2020; Coley & Beisteiner, Citation2002; Corsi et al., Citation2013; Dijken et al., Citation2005; Fisk, Citation2017; Fromme et al., Citation2008) and creates a significant infection risk in respect to transmission potential of infectious airborne pathogens such as COVID-19. It is suggested that classrooms be vacated fully after each use and during all breaktimes with active occupant-led measures (opening all windows and doors) introduced, so that the ventilation capacity of each room is maximised. Consideration should be given to the introduction of balanced mechanical ventilation systems that (a) incorporate suitably sized filters to mitigate the transmission potential of contagious airborne diseases, (b) continuously monitor the quality of the indoor air and (c) have the capacity to modulate airflow in response to same.
Protection is afforded by the wearing of masks within the indoor school setting. Consideration should be given to the routine adoption of this measure as a school specific risk management strategy in respect to the control of airborne infection transmission within education settings, as and when required.
Notwithstanding the focus of this research study, there appears to be an underlying issue with the consistency of indoor air quality when relying solely on natural ventilation strategies. This impacts the quality of indoor air in educational settings and has implications for learning, as high levels of CO2 have previously been linked to poor concentration and negatively affect memory among students (Bakó-Biró et al., Citation2012; Clements-Croome, Awbi, Bakó-Biró, Kochhar, & Williams, Citation2008; Dorizas, Assimakopoulos, & Santamouris, Citation2015; Myhrvold, Olsen, & Lauridsen, Citation1996).
Disclosure statement
No potential conflict of interest was reported by the author(s).
References
- Al-Hubail, J., & Al-Temeemi, A.-S. (2015). Assessment of school building air quality in a desert climate. Building and Environment, 94, 569–579. doi:10.1016/j.buildenv.2015.10.013
- Andrejko, K. L. (2022). Effectiveness of face mask or respirator use in indoor public settings for prevention of SARS-CoV-2 infection—California, February–December 2021. MMWR. Morbidity and Mortality Weekly Report, 71, 212–216. doi:10.15585/mmwr.mm7106e1
- ASHRAE. (2022). ASHRAE position document on indoor carbon dioxide. ASHRAE. https://www.ashrae.org/file%20library/about/position%20documents/pd_indoorcarbondioxide_2022.pdf
- Awbi H. B. (2002). Ventilation of Buildings (2nd ed.). Routledge. https://doi.org/10.4324/9780203634479
- Azuma, K., Kagi, N., Yanagi, U., & Osawa, H. (2018). Effects of low-level inhalation exposure to carbon dioxide in indoor environments: A short review on human health and psychomotor performance. Environment International, 121, 51–56. doi:10.1016/j.envint.2018.08.059
- Bakó-Biró, Z., Clements-Croome, D. J., Kochhar, N., Awbi, H. B., & Williams, M. J. (2012). Ventilation rates in schools and pupils’ performance. Building and Environment, 48, 215–223. doi:10.1016/j.buildenv.2011.08.018
- Bazant, M. Z., & Bush, J. W. M. (2021). A guideline to limit indoor airborne transmission of COVID-19. Proceedings of the National Academy of Sciences of the United States of America, 118(17), e2018995118. doi:10.1073/pnas.2018995118
- Brooks, J. T., & Butler, J. C. (2021). Effectiveness of mask wearing to control community spread of SARS-CoV-2. JAMA, 325(10), 998–999. doi:10.1001/jama.2021.1505
- Buonanno, G., Stabile, L., & Morawska, L. (2020). Estimation of airborne viral emission_ quanta emission rate of SARS-CoV-2 for infection risk assessment. doi:10.1016/j.envint.2020.105794
- Central Statistics Office. (2021). Education statistics. Central Statistics Office. https://www.cso.ie/en/statistics/education/
- Choe, Y., Heo, J., Park, J., Kim, E., Ryu, H., Kim, D. J., … Yang, W. (2020). Evaluation of carbon dioxide concentrations and ventilation rates in elementary middle, and high schools. Journal of Environmental Health Sciences, 46(3), 344–352.
- Chughtai, A. A., Seale, H., & Macintyre, C. R. (2020). Effectiveness of cloth masks for protection against severe acute respiratory syndrome Coronavirus 2—Volume 26, Number 10—October 2020—Emerging Infectious Diseases journal—CDC.
- CIBSE. (2004). Heating, ventilating, air conditioning and refrigeration. Chartered Institution of Building Services Engineers, London.
- CIBSE. (2006). CIBSE Guide A Environmental Design. CIBSE (London: Chartered Institution of Building Services Engineers).
- CIBSE. (2015). CIBSE Guide A: Environmental Design. CIBSE (London: Chartered Institution of Building Services Engineers).
- CIBSE. (2016). CIBSE Guide B2: Ventilation and ductwork. CIBSE (London: Chartered Institution of Building Services Engineers).
- Clements-Croome, D. J., Awbi, H. B., Bakó-Biró, Z., Kochhar, N., & Williams, M. (2008). Ventilation rates in schools. Building and Environment, 43(3), 362–367. doi:10.1016/j.buildenv.2006.03.018
- Cole, E. C., & Cook, C. E. (1998). Characterization of infectious aerosols in health care facilities: An aid to effective engineering controls and preventive strategies. American Journal of Infection Control, 26(4), 453–464. doi:10.1016/S0196-6553(98)70046-X
- Coley, D. A., & Beisteiner, A. (2002). Carbon dioxide levels and ventilation rates in schools. International Journal of Ventilation, 1(1), 45–52. doi:10.1080/14733315.2002.11683621
- Corsi, R., Torres, V., Sanders, M., & Kinney, K. (2013, July 6). Carbon dioxide levels and dynamics in elementary schools: Results of the TESIAS study [Text]. AIVC. https://www.aivc.org/resource/carbon-dioxide-levels-and-dynamics-elementary-schools-results-tesias-study
- Dai, H., & Zhao, B. (2020). Association of the infection probability of COVID-19 with ventilation rates in confined spaces. Building Simulation, 13(6), 1321–1327. doi:10.1007/s12273-020-0703-5
- Department of Education. (2020). COVID-19 response plan for the safe and sustainable operation of Post Primary Schools.
- Department of Education. (2021a). Room air cleaner guidance for schools. Department of Education. https://www.gov.ie/en/publication/c6578-room-air-cleaner-guidance-for-schools/
- Department of Education. (2021b). School design guide SDG 02-03 post primary school design guide. file:///C:/Users/Seamus/AppData/Local/Temp/MicrosoftEdgeDownloads/74b62159-4e37-4438-816e-8955df963221/131217_25e3cdb0-f720-44d6-82c0-8298f7391dbc.pdf.
- Department of Education and Science. (2004). Mechanical & electrical building services engineering guidelines for post primary school buildings. Department of Education and Science. file:///C:/Users/455088/Downloads/93656_ef5f23c0-a2ad-41b2-b60e-90ea30d83f3c%20(1).pdf.
- Dijken, F., Bronswijk, J., & Sundell, J. (2005). Indoor environment in Dutch primary schools and health of the pupils. Indoor Air, 6.
- Ding, E., Zhang, D., & Bluyssen, P. M. (2022). Ventilation regimes of school classrooms against airborne transmission of infectious respiratory droplets: A review. Building and Environment, 207, 108484. doi:10.1016/j.buildenv.2021.108484
- Dolan, J. (2007). Using minimum energy in Ireland’s Schools. Organisation for Economic Co-operation and Development.
- Dorizas, P. V., Assimakopoulos, M.-N., & Santamouris, M. (2015). A holistic approach for the assessment of the indoor environmental quality, student productivity, and energy consumption in primary schools. Environmental Monitoring and Assessment, 187(5), 259. doi:10.1007/s10661-015-4503-9
- Etheridge, D., & Sandberg, M. (1996). Building ventilation theory and measurement. Wiley, London.
- Fabian, P., McDevitt, J. J., Lee, W.-M., Houseman, E. A., & Milton, D. K. (2009). An optimized method to detect influenza virus and human rhinovirus from exhaled breath and the airborne environment. Journal of Environmental Monitoring : Jem, 11(2), 314–317. doi:10.1039/b813520g
- Fennelly, K. P., & Nardell, E. A. (1998). The relative efficacy of respirators and room ventilation in preventing occupational tuberculosis. Infection Control and Hospital Epidemiology, 19(10), 754–759. doi:10.2307/30141420
- Fernstrom, A., & Goldblatt, M. (2013a). Aerobiology and its role in the transmission of infectious diseases. Journal of Pathogens, 2013, e493960. doi:10.1155/2013/493960
- Fisk, W. J. (2017). The ventilation problem in schools: Literature review. Indoor Air, 27(6), 1039–1051. doi:10.1111/ina.12403
- Fontes, D., Reyes, J., Ahmed, K., & Kinzel, M. (2020). A study of fluid dynamics and human physiology factors driving droplet dispersion from a human sneeze. Physics of Fluids, 32(11), 111904. doi:10.1063/5.0032006
- Fromme, H., Heitmann, D., Dietrich, S., Schierl, R., Körner, W., Kiranoglu, M., … Twardella, D. (2008). [Air quality in schools—classroom levels of carbon dioxide (CO2), volatile organic compounds (VOC), aldehydes, endotoxins and cat allergen]. Gesundheitswesen (Bundesverband der Arzte des Offentlichen Gesundheitsdienstes (Germany)), 70(2), 88–97.
- Guo, Y., Qian, H., Sun, Z., Cao, J., Liu, F., Luo, X., … Zhang, Y. (2021). Assessing and controlling infection risk with Wells-Riley model and spatial flow impact factor (SFIF). Sustainable Cities and Society, 67, 102719. doi:10.1016/j.scs.2021.102719
- Hella, J., Morrow, C., Mhimbira, F., Ginsberg, S., Chitnis, N., Gagneux, S., … Fenner, L. (2017). Tuberculosis transmission in public locations in Tanzania: A novel approach to studying airborne disease transmission. Journal of Infection, 75(3), 191–197. doi:10.1016/j.jinf.2017.06.009
- Huang, C., Wang, Y., Li, X., Ren, L., Zhao, J., Hu, Y., … Cao, B. (2020). Clinical features of patients infected with 2019 novel coronavirus in Wuhan, China. The Lancet, 395(10223), 497–506. doi:10.1016/S0140-6736(20)30183-5
- Huang, Q., Marzouk, T., Cirligeanu, R., Malmstrom, H., Eliav, E., & Ren, Y.-F. (2021). Ventilation assessment by carbon dioxide levels in dental treatment rooms. Journal of Dental Research, 100(8), 810–816. doi:10.1177/00220345211014441
- Issarow, C. M., Mulder, N., & Wood, R. (2015). Modelling the risk of airborne infectious disease using exhaled air. Journal of Theoretical Biology, 372, 100–106. doi:10.1016/j.jtbi.2015.02.010
- Jayaweera, M., Perera, H., Gunawardana, B., & Manatunge, J. (2020). Transmission of COVID-19 virus by droplets and aerosols: A critical review on the unresolved dichotomy. Environmental Research, 188, 109819. doi:10.1016/j.envres.2020.109819
- Jimenez, J.-L. (2020, August 4). How to quantify the ventilation rate of an indoor space using a cheap CO2 monitor. Medium. https://medium.com/@jjose_19945/how-to-quantify-the-ventilation-rate-of-an-indoor-space-using-a-cheap-co2-monitor-4d8b6d4dab44
- Johansson, M. A., Quandelacy, T. M., Kada, S., Prasad, P. V., Steele, M., Brooks, J. T., … Butler, J. C. (2021). SARS-CoV-2 transmission from people without COVID-19 symptoms. JAMA Network Open, 4(1), e2035057. doi:10.1001/jamanetworkopen.2020.35057
- Lednicky, J. A., Lauzard, M., Fan, Z. H., Jutla, A., Tilly, T. B., Gangwar, M., … Wu, C.-Y. (2020). Viable SARS-CoV-2 in the air of a hospital room with COVID-19 patients. International Journal of Infectious Diseases: IJID: Official Publication of the International Society for Infectious Diseases, 100, 476–482. doi:10.1016/j.ijid.2020.09.025
- Li, Y., Leung, G. M., & Tang, J. W. (2007). Role of ventilation in airborne transmission of infectious agents in the built environment – a multidisciplinary systematic review.
- Liao, C.-M., Chang, C.-F., & Liang, H.-M. (2005). A probabilistic transmission dynamic model to assess indoor airborne infection risks. Risk Analysis: An Official Publication of the Society for Risk Analysis, 25(5), 1097–1107. doi:10.1111/j.1539-6924.2005.00663.x
- Lindsley, W. G., Blachere, F. M., Beezhold, D. H., Thewlis, R. E., Noorbakhsh, B., Othumpangat, S., … Noti, J. D. (2016). Viable influenza A virus in airborne particles expelled during coughs versus exhalations. Influenza and Other Respiratory Viruses, 10(5), 404–413. doi:10.1111/irv.12390
- Mikszewski, A., Stabile, L., Buonanno, G., & Morawska, L. (2021). The vaccination threshold for SARS-CoV-2 depends on the indoor setting and room ventilation. BMC Infectious Diseases, 21(1), 1193. doi:10.1186/s12879-021-06884-0
- Miller, S. L., Nazaroff, W. W., Jimenez, J. L., Boerstra, A., Buonanno, G., Dancer, S. J., … Noakes, C. (2021). Transmission of SARS-CoV-2 by inhalation of respiratory aerosol in the Skagit Valley Chorale superspreading event. Indoor Air, 31(2), 314–323. doi:10.1111/ina.12751
- Morawska, L., & Cao, J. (2020). Airborne transmission of SARS-CoV-2: The world should face the reality. Environment International, 139, 105730. doi:10.1016/j.envint.2020.105730
- Morawska, L., Johnson, G. R., Ristovski, Z. D., Hargreaves, M., Mengersen, K., Corbett, S., … Katoshevski, D. (2009). Size distribution and sites of origin of droplets expelled from the human respiratory tract during expiratory activities. Journal of Aerosol Science, 40(3), 256–269. doi:10.1016/j.jaerosci.2008.11.002
- Morawska, L., & Milton, D. K. (2020). It is time to address airborne transmission of COVID-19. Clinical Infectious Diseases: An Official Publication of the Infectious Diseases Society of America, 71(9), 2311–2313. doi:10.1093/cid/ciaa939. PMID: 32628269; PMCID: PMC7454469.
- Myatt, T. A., Johnston, S. L., Zuo, Z., Wand, M., Kebadze, T., Rudnick, S., & Milton, D. K. (2004). Detection of airborne rhinovirus and its relation to outdoor Air supply in office environments. American Journal of Respiratory and Critical Care Medicine, 169(11), 1187–1190. doi:10.1164/rccm.200306-760OC
- Myhrvold, A. N., Olsen, E., & Lauridsen, O. (1996). Indoor environment in schools–pupils health and performance in regard to CO2 concentrations. Indoor Air, 96(4), 369–371.
- Nardell, E., Keegan, J., Cheney, S., & Etkind, S. (1991). Airborne infection—theoretical limits of protection achievable by building ventilation. American Review of Respiratory Disease, 144(2), 302–306. doi:10.1164/ajrccm/144.2.302
- Nazaroff, W. W., Nicas, M., & Miller, S. L. (1998). Framework for evaluating measures to control nosocomial tuberculosis transmission. Indoor Air, 8(4), 205–218. doi:10.1111/j.1600-0668.1998.00002.x
- Orimadegun, A. E., & Omisanjo, A. O. (2014). Evaluation of five formulae for estimating body surface area of Nigerian children. Annals of Medical and Health Sciences Research, 4(6). doi:10.4103/2141-9248.144907
- Ram, K., Thakur, R. C., Singh, D. K., Kawamura, K., Shimouchi, A., Sekine, Y., … Tripathi, S. N. (2021). Why airborne transmission hasn’t been conclusive in case of COVID-19? An atmospheric science perspective. The Science of the Total Environment, 773, 145525. doi:10.1016/j.scitotenv.2021.145525
- Riley, E. C., Murphy, G., & Riley, R. L. (1978). Airborne spread of measles in a suburban elementary school. American Journal of Epidemiology, 107(5), 421–432. doi:10.1093/oxfordjournals.aje.a112560
- Royal College of Paediatrics and Child Health. (n.d.). WHO growth charts 2-18 years. https://www.rcpch.ac.uk/resources/uk-who-growth-charts-2-18-years
- Rudnick, S. N., & Milton, D. K. (2003). Risk of indoor airborne infection transmission estimated from carbon dioxide concentration. Indoor Air, 13(3), 237–245. doi:10.1034/j.1600-0668.2003.00189.x. PMID: 12950586.
- Sheppard, T. (2011). Ireland’s generic repeat design schools programme. Organisation for Economic Co-operation and Development.
- Sigurdsson, T. S., & Lindberg, L. (2020). Six commonly used empirical body surface area formulas disagreed in young children undergoing corrective heart surgery. Acta Paediatrica, 109(9), 1838–1846. doi:10.1111/apa.15208
- Simoni, M., Annesi-Maesano, I., Sigsgaard, T., Norback, D., Wieslander, G., Nystad, W., … Viegi, G. (2010). School air quality related to dry cough, rhinitis and nasal patency in children. The European Respiratory Journal, 35(4), 742–749. doi:10.1183/09031936.00016309
- Stadnytskyi, V., Anfinrud, P., & Bax, A. (2021). Breathing, speaking, coughing or sneezing: What drives transmission of SARS-CoV-2? Journal of Internal Medicine, 290(5), 1010–1027. doi:10.1111/joim.13326
- Sun, C., & Zhai, Z. (2020). The efficacy of social distance and ventilation effectiveness in preventing COVID-19 transmission. Sustainable Cities and Society, 62, 102390. doi:10.1016/j.scs.2020.102390
- Sze To, G. N., & Chao, C. Y. H. (2010). Review and comparison between the Wells–Riley and dose-response approaches to risk assessment of infectious respiratory diseases. Indoor Air, 20(1), 2–16. doi:10.1111/j.1600-0668.2009.00621.x
- Wang, J., & Du, G. (2020). COVID-19 may transmit through aerosol. Irish Journal of Medical Science, 189(4), 1143–1144. doi:10.1007/s11845-020-02218-2
- Wei, J., & Li, Y. (2016). Airborne spread of infectious agents in the indoor environment.
- Wells, W. F. (1955). Airborne contagion and air hygiene. Harvard University Press. Cambridge, Massachusetts.
- Zhu, N., Zhang, D., Wang, W., Li, X., Yang, B., Song, J., … Tan, W. (2020). A novel coronavirus from patients with pneumonia in China, 2019. New England Journal of Medicine, 382(8), 727–733. doi:10.1056/NEJMoa2001017