
 ?Mathematical formulae have been encoded as MathML and are displayed in this HTML version using MathJax in order to improve their display. Uncheck the box to turn MathJax off. This feature requires Javascript. Click on a formula to zoom.
ABSTRACT
This paper focuses on the effect of melting modes on microstructural evolution and tribological properties of AlSi10Mg alloy fabricated by selective laser melting (SLM). The results showed that the microstructures of SLM AlSi10Mg consisted of primary α-Al surrounded by cellular Si networks (∼500 nm) when fabricated in conduction mode, but has a finer cellular-like Si phase (∼200 nm) when fabricated in keyhole mode. The strong convection caused by the melt reflow and Marangoni convection under keyhole mode also resulted in deposition of nano-scale Si particles at the bottom of the molten pool. The SLM AlSi10Mg fabricated in keyhole mode exhibited better wear resistance than that fabricated in conduction mode. Compared to traditional as-cast specimens, both SLM specimens showed better wear resistance due to the unique cellular-like networks. The SLM technique offers a new approach for material processing that can be used to refine microstructures for improved tribological properties.
1. Introduction
Many engineering parts are subject to wear during service, which not only reduces their service life, but also increases energy consumption and generates both noise and vibration. Thus, good wear performance is a critical parameter for many materials. AlSi10Mg is a Al–Si alloy that has several advantages, including being lightweight, good wear resistance, and excellent thermal conductivity (Aboulkhair et al. Citation2019). It is widely used in both automobiles and aircraft in engine blocks, pistons, and hinges (Wahab et al. Citation2019; Tang et al. Citation2020). With the ever-increasing demand for lightweight, structural and functional integration of aluminum alloy components, the production of complex-shaped, thin-walled, and high-precision parts has become the primary development trend at present (Demir and Biffi Citation2019; Leary et al. Citation2019). Traditional aluminum alloy forming processes have long production cycles and high production costs, which have difficulty meeting the growing current technical requirements.
Selective laser melting (SLM), as a typical metal additive manufacturing technology, can fabricate complex metal parts layer by layer directly using digital models. This technology has the ability to produce components with unlimited flexibility and high accuracy, thus, minimising both processing cycles and material waste (Zhang et al. Citation2019). Owing to the latest developments in laser technology, SLM equipment can melt and consolidate low laser absorption and high laser reflection materials, such as aluminum alloys and magnesium alloys (Li et al. Citation2018; Bi et al. Citation2020; Long et al. Citation2018; Yin et al. Citation2019). During laser melting, high volumetric energy density (E) at high laser power (P) and low scanning speed (v) can be used to change the melting mode from conduction mode (CM) to keyhole mode (KM), resulting in a transition of the melt shape from shallow and semicircular to deep and narrow (Qi et al. Citation2017). In KM, the high E not only vaporises material and forms a plasma, but also enhances laser absorption and drills a vapour capillary at the bottom of the molten pool (Dowden Citation2009). Thus, the KM in 3D printing can lead to excessive pore defects. Considerable research has focused on the keyhole formation mechanism and the keyhole threshold to avoid the occurrence of this phenomenon (Cunningham et al. Citation2019; Teng et al. Citation2017; Shrestha and Kevin Chou Citation2019; Thanki et al. Citation2019). However, Aboulkhair et al. (Citation2016) pointed out that use of the KM can be acceptable for AlSi10Mg due to the formation of pore-free molten pool during depositing. Yang et al. (Citation2016) found that the CM exhibits superior formability, while the KM produces a better combination of strength and ductility. Therefore, it is important to systematically investigate the microstructural evolution and related tribological properties of SLM components fabricated by the two different modes. It is difficult to evaluate the effect of microstructural evolution on wear performance using traditional wear tests. Recent works have been focused on nanoindentation tests to solve this problem (Okoro et al. Citation2019; Zhou, Xu, et al. Citation2019). For example, the relationship between the thickness of α′ and tribological properties of SLM Ti-13Nb-13Zr alloys can be well established through nanoindentation tests (Zhou, Yuan, et al. Citation2019).
The objective of this study was to explore the microstructures and tribological properties of SLM AlSi10Mg fabricated under different conditions, i.e. in CM and in KM, and to understand the related wear mechanisms. For comparison, wear tests were performed on an as-cast specimen to understand the influence of the microstructure on tribological properties.
2. Experimental
Gas-atomized AlSi10Mg powder used in this study was prepared using a close-coupled gas atomisation system under high-purity argon (99.99 wt.%). The composition (wt.%) of the powder was 8.21Si, 0.21Fe, 0.01Cr, 0.02Mn, 0.82Mg, 0.02V, 0.03Ni, 0.11O, with the balance Al. Two groups of specimens (10 mm × 10 mm × 10 mm) were fabricated using a FS271M SLM machine (Farsoon, Inc., China) equipped with a maximum power of 500 W Yb: YAG fibre laser. To obtain the specimens under two melting modes, the SLM parameters employed were: P = 175 W and v = 694 mm/s; or P = 250 W and v = 500 mm/s. The laser beam diameter (d), hatching spacing (h) and layer thickness (t) were kept constant at 90, 120 and 50 μm, respectively. All the processing was performed under an inert and high purity Ar gas containing no more than 100 ppm oxygen. The scanning strategy plays a crucial role in forming quality. Short scan vectors could decrease the residual stress, and the proper rotation angle could reduce part deformation without detriment to strength or part porosity (Robinson et al. Citation2019). Thus, a ‘checkerboard’ scanning strategy with 67° rotation between each layer was utilised for the bulk volume. It is well known that compressive residual stress has a positive effect on wear resistance. The tensile stress at the top of SLM specimens shows a trend that decreases with the reduction in height, which then converts into compressive stress (Vierneusel et al. Citation2017; Mao et al. Citation2017). The specimens were cut at 1 mm below the top surface to avoid the influence of residual tensile stress. To evaluate the laser energy input on the different melting modes, the E was used (Ghayoor et al. Citation2019):(1)
(1)
E was 42.03 J/mm3 in CM and 83.33 J/mm3 in KM.
The relative density of the specimens was determined by employing the Archimedes’ method. The phases of the powder and SLM specimens were analysed using a D/Max-2250 X-ray diffractometer (XRD) with Cu-Kα radiation. Measurements were performed by step scanning 2θ from 10° to 90° with a scanning rate of 5°/min. Metallographic specimens were prepared following standard procedures and etched with HNO3: HCl: HF: H2O (5: 3: 2: 190) solution for 20 s. The microstructures of SLM specimens were examined using an optical microscope (OM, Leica DM2700P), a field emission gun scanning electron microscope (SEM, Nova NanoSEM 230) equipped with an electron back-scatter diffraction (EBSD) detector, and a transmission electron microscope (TEM, FEI Talos F200X). X-ray energy dispersive spectroscopy (EDS) and high angle annular dark-field scanning mode was employed in STEM mode (HAADF-STEM) to characterise the cellular-like structure of the KM specimen in detail. The surfaces of the specimens after wear tests were examined using a laser confocal scanning microscope (LCSM, OLYMPUS OLS5000). Nanoindentation measurements were conducted at a load of 30 mN with a holding time of 15 s. The dynamic nanohardness, H, was determined from (Oliver and Pharr Citation1992):(2)
(2) where Pmax is the peak load and hc is the contact depth under the peak load. The reduced Young’s modulus (Er) of the specimen is extracted from the effective modulus as follow (Medeiros et al. Citation2015):
(3)
(3) where Es and vs are Young’s modulus and Poisson’s ratio of the specimen (vs refers to 0.33 (Sol et al. Citation2018)), and Ei and vi are Young’s modulus and Poisson’s ratio of the indenter (1140 GPa and 0.07, respectively). Dry sliding wear tests were performed using a HT-1000 ball-on-disk type tribometer (ZhongKe KaiHua, Inc., China) at room temperature. The wear disks were held against a GCr15 bearing steel ball (radius = 2 mm, HRC 60) with a load of 10 N, while rotating at a constant speed of 560 r/min for 20 min (rotation radius = 2 mm). The volumetric wear loss (Vloss) can be calculated from Vloss
= Mloss/ρ, where Mloss is the mass loss of the specimen, and ρ is the theoretical density of the AlSi10Mg (2.68 g/cm3). Thus, the wear rates (ω) can be calculated by ω = Vloss/(NS), where N is the applied load and S is the total sliding distance.
3. Results and discussion
3.1. Powder analysis
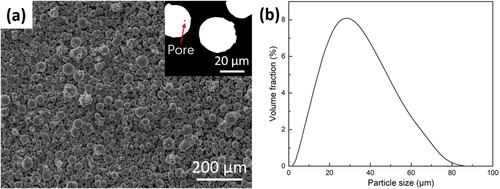
(a) shows typical secondary electron (SE) images of the AlSi10Mg powder. The powders are spherical shape with only a few satellites. Gas pores are only occasionally observed inside the powder (inset of (a)). The powder particle size distribution was determined using a laser particle size analyser (LPSA): (b) shows a typical log-normal size distribution with particle sizes of 9.3 μm (D10), 25.3 μm (D50) and 51.0 μm (D90), where DX refers to the cumulative size distribution up to X% (including this value) of the total volume of powder.
Figure 1. (a) SE images of AlSi10Mg powder (inset shows cross-sectioned powders), and (b) particle size distribution.
3.2. Surface morphologies and densification
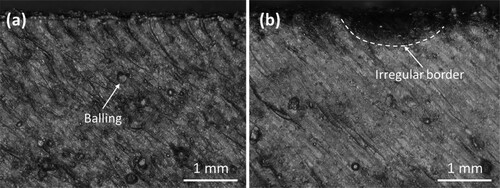
shows typical surface morphologies (top view) of SLM specimens fabricated using the two different melting modes. The surface of the CM specimen was somewhat rough with a balling phenomenon ((a)). This morphology is due to the high viscosity and low wettability of the melt induced by the low E (Guo et al. Citation2019). When E is increased to that used for KM ((b)), the surface becomes smoother along with the appearance of an irregular border. This indicates vaporisation of Al occurred. Although the accuracy of part dimensions emerges as a new issue, the surface quality of KM is better than that of CM. The relative density of SLM part under CM (96.68 ± 0.06%) is slightly higher than that of the part under KM (95.52 ± 0.05%), implying that the laser-induced balling effect is not the only reason affecting the density of SLM parts. It has been shown that there are two major defects that have been demonstrated to be the main reason for the density reduction (Wu et al. Citation2017). One is the high concentration of hydrogen pores caused by the humid environment and the high E; the other is keyhole defect induced by high-energy vaporised metals.
Figure 2. OM images showing typical surface morphologies of SLM specimens fabricated in two melting modes: (a) CM, and (b) KM.
3.3. Microstructure
presents the top and side view OM images of the SLM AlSi10Mg for the two melting modes. The top view of the CM specimen (a) exhibits semi-cylindrically-shaped contours with an angle of 67°, which is consistent with the scanning strategy. The corresponding side view (c) demonstrates well-overlapped molten pools characterised by a semi-circular shape owing to the applied h (120 μm) and t (50 μm). The overlapping morphology of the molten pool indicates the complete fusion of the powder particles and strong bonding within the layers. However, it is found that gas and hydrogen pores are present inside the molten pool.
Figure 3. OM images of SLM AlSi10Mg specimens fabricated in two melting modes: (a) and (c) CM, and (b) and (d) KM.
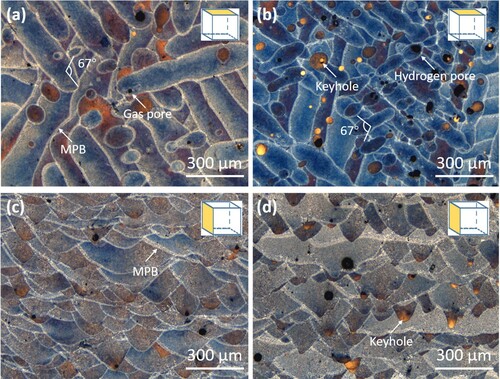
The top view of the KM specimen ((b)) shows similar overlapped laser tracks while the molten pool shape in side view ((d)) changes from shallow to deep. Note that the golden V-shaped molten pool (referred as keyhole molten pool, KMP) induced by the keyhole effect only appears in the KM specimen. Moreover, the pores located at the bottom of the KMP (known as keyhole defects) confirms that material vaporisation occurred as a result of the keyhole effect (Wu et al. Citation2017). By comparing the pore defects in two melting modes, it is thought that the hydrogen pores are the main factor affecting the densification. The dark contrast from the molten pool core and bright contrast from the molten pool boundary (MPB) can be seen in both top and side view OM images, and arise from the Gaussian distribution of the laser energy.
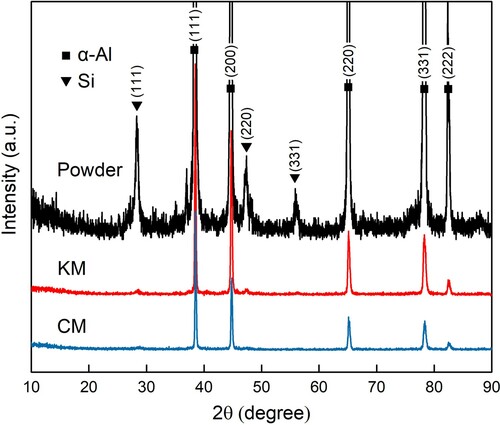
XRD patterns of the powder and SLM specimens are presented in . All the peaks on the X-ray diffraction patterns fit either Si or α-Al phases. The diffraction peaks corresponding to Si are barely present on the diffraction patterns from the SLM specimens, indicating that the Si has largely dissolved into a supersaturated in α-Al matrix. This is presumably due to the high cooling rate of the SLM process (Xi et al. Citation2020). A careful comparison of the diffraction peaks showed that the intensities of Si peaks increase slightly as E was increased from 42.03 to 83.33 J/mm3, indicating a higher Si content in the KM specimen. This may be attributed to the vaporisation of Al at the higher temperature (Kang et al. Citation2016). Besides, the precipitation of Si upon cooling and re-precipitation of Si by the heat conduction from the following scans are much more severe in KM specimen owing to the higher processing temperature. It is also responsible for a higher Si content in KM specimen characterised by XRD apart from the vaporisation of Al.
Figure 4. XRD patterns from the alloy powder and the SLM specimens.
shows the top and side view SE images of the SLM AlSi10Mg specimens fabricated in the two melting modes. The inset bright field TEM images show the microstructures at higher magnification. The size of cellular-like networks in molten pool is apparently different from that in the MPB. (a,c) reveal that the MPB of the CM specimen consists of the remelted zone (RZ) and the heat-affected zone (HAZ). The size of cells in the RZ is coarser than that in the molten pool. The cells are almost replaced by granular microstructure in the HAZ, which indicates that the microstructure in the MPB is inhomogeneous. The cells in the top view images (inset of (a)) are composed of primary α-Al surrounded by ∼500 nm diameter Si networks. These equiaxed cells are observed to be elongated from the side view, as shown in (c). Furthermore, the elongated cells grow perpendicular to the direction of the MPB, since the direction possesses the highest temperature gradient. This is known as preferential growth, indicating that the temperature gradient is the dominant reason for the various microstructures (Trevisan et al. Citation2017).
Figure 5. SE and inset BF TEM images of SLM AlSi10Mg specimens for the two melting modes: (a) and (c) CM, and (b) and (d) KM.
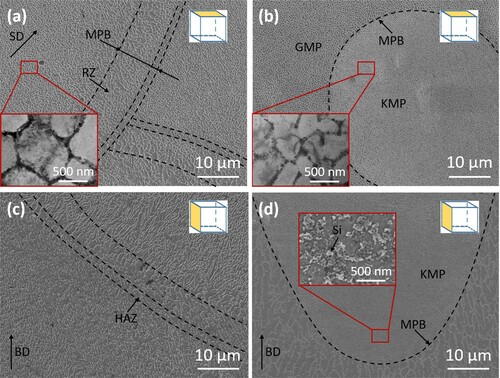
In contrast, from (b,d), the KMP exhibits an ultrafine microstructure both in the transverse and longitudinal sections owing to the keyhole effect. The absence of RZ and HAZ in the MPB of the KMP indicates a sharp transition between general molten pool (GMP) and KMP. This sharp transition is mainly attributed to the formation mechanism of the KMP (evaporation-solidification) and corresponding extremely high cooling rate (108 K/s) under KMP melting (Guraya, Singamneni, and Chen Citation2019). Without considering the effects of defects (e.g. pore and crack), the MPB is the weakest region of the SLM part (Xiong et al. Citation2019). The reduction of the MPB region, therefore, is beneficial to the improvement of mechanical properties. Generally, the depth of the KMP is deep enough to pass through the GMP and reach its MPB, as clearly shown in (d). This explains the fact that the coarse elongated cells present surrounding the KMP ((d)). Note that no keyhole defects are observed at the bottom of the KMP. This means that the keyhole defects in the KMP resulted from material vaporisation can be eliminated if the melt reflows sufficiently. Additionally, the strong convection triggered by the melt reflow and Marangoni convection lead to the transformation of cellular-like structures to Si nanoparticles (bright phases, as marked in the inset of (d)) at the bottom of the KMP. This suggests that the morphology of the eutectic-Si phase is affected not only by temperature gradient, but also by melt convection.
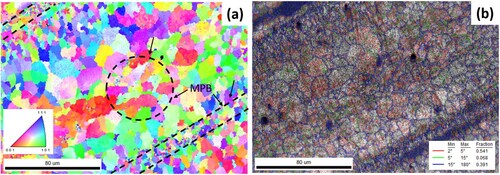
presents an EBSD inverse pole figure (IPF) and corresponding image quality (IQ) map from the top view of the KM specimen. This clearly shows two types of MPB as mentioned above. One is induced by laser overlapping and re-melting, which is composed of RZ and HAZ with fine-grained region; the other is formed by material evaporation-solidification, which is generally located inside the molten pool. Note that the grain growth beyond the MPB (as marked in (a)) indicates the existence of heterogeneous nucleation and epitaxial growth. Interestingly, coarse cells are present in the MPB within the fine-grained region, while the coarse-grained region in molten pool has small cells. Since the cell size is significantly smaller than the grain size, this unique microstructure is subgrains. The corresponding IQ map ((b)) illustrates that the KM specimen contains a large fraction of low-angle grain boundaries (LAGBs, 2–10°, ∼54% of total grain boundaries), which is responsible for the improved strength (Wang et al. Citation2017). Accordingly, the nonuniform distribution of LAGBs in the molten pool denotes the weakness of the MPB region.
Figure 6. (a) Inverse pole figure (IPF) map and (b) image quality (IQ) map on the top view of the KM specimen.
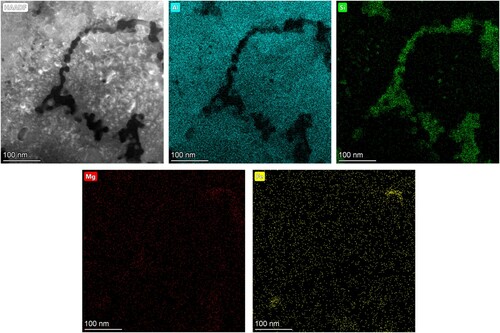
shows an HAADF-STEM image and EDS maps of the cells in the KMP. The cells are composed of the α-Al phase decorated with ∼200 nm diameter eutectic Si networks at the boundaries. The presence of these two phases is consistent with the XRD results in . A closer look at the Si distribution in EDS mapping reveals that some Si precipitates exist inside the cells. Unlike GMP, no distinct segregation of Mg and Fe elements is observed in KMP owing to the very high cooling rate (Hadadzadeh, Amirkhiz, and Mohammadi Citation2019). It is proposed that the strong convection of the melt can effectively reduce the segregation of Mg and Fe in cell boundaries.
Figure 7. HAADF-STEM image of the cells in KMP and corresponding EDS mapping of the main elements (Al, Si, Mg and Fe).
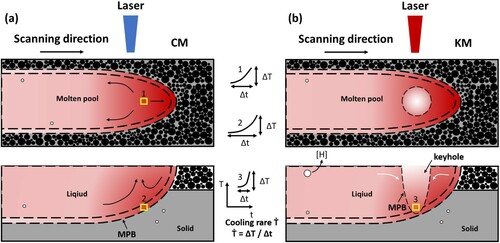
shows the schematic representation of melt flows, hydrogen pores, cooling rate, and keyhole dynamics during SLM processing. The temperature in the centre of the molten pool is higher than that in the boundary. Normally, the density of the melt decreases with increasing temperature. The density difference of the melt leads to buoyancy convection under the action of gravity (Riley and Neitzel Citation1998). In addition, in the absence of surfactant, surface tension γ has the same trend as the density changes, that is, ∂γ/∂T < 0. Thus, the shear stress, which from the centre of the molten pool to its boundary, generated by surface tension gradient also leads to Marangoni flow (Tsotridis, Rother, and Hondros Citation1989), as marked by black arrows in (a). The large temperature gradient during SLM processing induces a high cooling rate (region 1), and leads to Marangoni flow transforming into strong Bénard-Marangoni convection (Mizev and Schwabe Citation2009). These give rise to the formation of Si network in CM. The lower cooling rate in MPB (region 2) effectively alleviates the influence of melt convection on Si morphology. In KM, the E is higher enough to vaporise the metal and form a V-shaped keyhole under the balance between recoil pressure and surface tension. The plasma formed by laser irradiation resides inside the keyhole and moves outwards at high speed along the surface of molten pool, which intensifies the convection of the melt (Qi et al. Citation2017). However, this dynamic balance is broken after the laser moves away. Then the melt will collapse and backfill into the keyhole, as marked by white arrows in (b). This opposite movement direction of the melt could result in turbulence with an ultra-high cooling rate (region 3). That’s the main reason for the deposition of nano-Si particles at the bottom of KMP. It’s worth noting that the keyhole defects will form only if the melt backfill is insufficient. In comparison, the hydrogen pores formed by the reaction between H2O and aluminum are the main part of the defects. By drying the raw powder at high-temperature, the accompanying negative effects can be effectively avoided.
Figure 8. Schematic representation of thermal history during (a) CM and (b) KM.
3.4. Tribological behaviors
The friction coefficients versus sliding time and wear rates of both the SLM and as-cast specimens are shown in . The measured friction coefficients are somewhat variable during the sliding process, and decreases from higher initial values (run-in period) to lower values (steady state) in all specimens ((a)). The mean friction coefficients (μ) of the three specimens in steady state wear (6–20 min) are calculated and summarised in (the statistical data analysis is shown in Table S1). The friction coefficient of the as-cast specimen showed large fluctuations with a mean value of 0.35 and large wear rate (10.05 × 10⁻⁴ mm3 N−1 m−1). The CM specimen shows a similar friction coefficient (0.36) but much lower wear rate (6.96 × 10⁻⁴ mm3 N−1 m−1). As the E reached KM values, the measured friction coefficient decreases slightly (0.32) and the wear rate decreases substantially (3.82 × 10⁻⁴ mm3 N−1 m−1).
Figure 9. (a) Friction coefficients versus sliding time and (b) wear rates for the SLM and as-cast specimens.
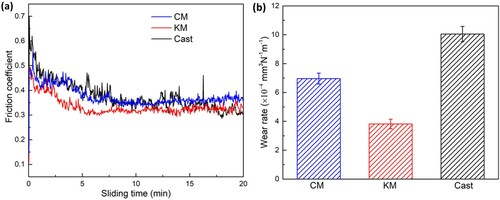
Table 1. Friction coefficients (μ) of the steady state wear.
shows the typical morphologies and 3D surface profiles of the worn surfaces of the SLM and as-cast specimens, as well as of the corresponding wear debris. In the as-cast specimen ((c)), severe plastic deformation occurs on the worn surface instead of abrasive grooves, implying an adhesion-dominated wear mechanism. At the beginning of the wear test, the GCr15 ball contacts with the specimens through a quite small surface area producing a large pressure. This large local pressure at the points of asperity contacts forges metallic junctions and engagements between the surfaces. In this situation, cold welding occurs between the friction pair. At larger sliding distances, the needle-like and plate-like eutectic Si structure leads to the rise of internal stress, providing an easy path for fracture of metallic junctions (Basavakumar, Mukunda, and Chakraborty Citation2009). The spalling of debris reduced the friction coefficient, while the exposed rough new surface was more likely due to cold welding, resulting in the increase of the friction coefficient. This repeated welding-fracturing process is the reason for the high wear rate and high friction coefficient fluctuation of the as-cast specimens (Joshi, Singh, and Chaudhary Citation2019). The Vloss, from the 3D surface profile, in this region is 0.108 mm3, which is the largest among three tested materials.
Figure 10. Topography and 3D surface profiles of the worn surfaces, and SE images of debris for (a) CM, (b) KM and (c) as-cast specimens.
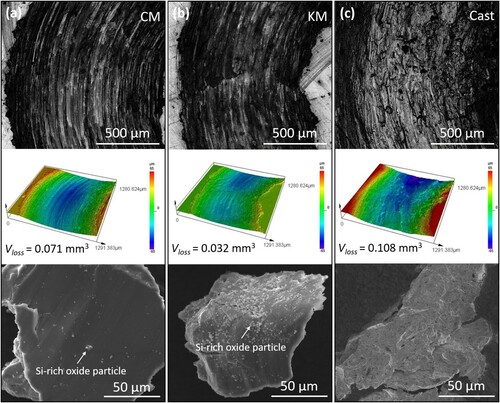
The worn surfaces of both the CM and the KM specimens exhibit the typical morphologies that arise from abrasive wear, viz. distinct and long grooves generated by plowing ((a,b)). The corresponding 3D surface profiles show that the Vloss of the SLM specimens is ∼34% lower than that of as-cast specimen, indicating that the wear of SLM specimens is reduced. The nano-scale cellular Si network plays a critical role in the wear behaviour, which could alleviate the adhesion of metal and inhibit the formation of a delamination layer (Prashanth et al. Citation2014). Compared to the as-cast specimens, this unique ultrafine microstructure also increases the surface hardness of SLM specimens from ∼110 to ∼150 HV (Girelli et al. Citation2017; Wei et al. Citation2017). The degree of repeated welding-fracture process was obviously reduced, and no adhesion was found in the SLM debris. Therefore, the friction coefficients of SLM specimens are stable, and the wear rates are lower than those of as-cast specimens. Of particular interest is that the Vloss of the KM specimen is lower than that of the CM specimen. The particles on the surface of the wear debris are considered as Si-rich oxide particles, details in Figure S1. These particles indicate that the wear mechanism is the dominant three-body wear, which is further verified by the wear coefficient K (0.5–5 × 10⁻³ for the three-body wear) calculated by Archard wear equation (Greer, Rutherford, and Hutchings Citation2002; Wu et al. Citation2013). Also, there are more Si-rich oxide nanoparticles on the surface of KM debris compared with CM debris. This is probably due to the finer Si networks (∼200 nm) and Si nanoparticles produced by the keyhole effect. The Si nanoparticles embedded in the KMP fall off the worn surface, which reduces the contact area of the friction pair during sliding, thereby improving the wear performance.
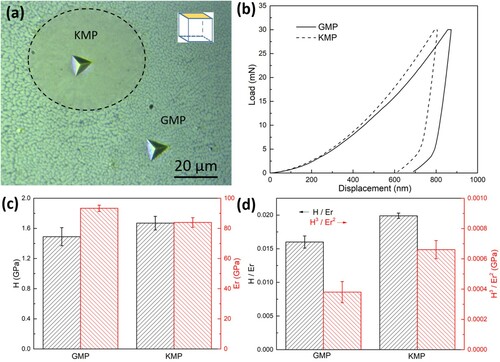
It is well accepted that hardness plays a significant role in determining the wear resistance of materials (Deuis, Subramanian, and Yellup Citation1997; Yusoff and Jamaludin Citation2011). In fact, the wear of materials is related to the H/Er ratio (Pintaude Citation2013). A high H/Er ratio normally denotes good wear resistance. Further, the ratio is a critical parameter to reveal the material’s ability to resist plastic deformation under a load (Herrera-Jimenez et al. Citation2019). A higher
ratio normally indicates that the material has better resistance to plastic deformation. Hence, these parameters are suitable for evaluating the anti-wear ability of materials, as the gradual removal of material during the wear process is associated with plastic deformation (Ehtemam-Haghighi, Cao, and Zhang Citation2017). The H and Er of two molten pools are measured using nanoindentation tests, as shown in . (b) depicts the nanoindentation load-depth curves collected from two types of molten pools (marked in (a)). The curves are smooth without observable serration. After unloading, there is obvious permanent deformation and elastic recovery. The corresponding average values of H and Er are presented in (c). It is found that KMP induced by evaporation shows higher H and lower Er than those of the GMP. Further, the H/Er and
ratios of the two molten pools exhibit a similar trend ((d)), suggesting that the existence of the KMP is mainly responsible for the improved anti-wear ability.
Figure 11. (a) Nanoindentation positions in the two molten pools from the top view in the KM specimen; (b) corresponding load-displacement curves; (c) the values of H and Er; and (d) H/Er and ratios.
4. Conclusions
The following conclusions can be drawn from this experimental study:
Although both hydrogen pores and keyhole defects can reduce the density of SLM AlSi10Mg, the former is the dominant factor. The keyhole defects in keyhole molten pool (KMP) can be eliminated if sufficient melt reflow occurs.
The increase of the volumetric energy density (E) does not change the nominal composition of SLM AlSi10Mg, but modifies the distribution of Si via materials vaporisation and melt reflow. Compared with the general molten pool (GMP), the molten pool boundary (MPB) in the KMP presents a sharp transition without the remelted zone (RZ) and the heat-affected zone (HAZ). The cell size in the KMP is much finer (∼200 nm) than that in the GMP (∼500 nm).
The wear mechanisms of the as-cast specimen are dominated by adhesive wear, while the main mechanism for the SLM specimen is abrasive wear due to the Si network.
The randomly distributed Si nanoparticles at the KMP reduces the contact area of the friction pair, resulting in higher anti-wear ability. The nanoindentation measurement results show that the KMP has higher H/Er and
ratios, which also prove that the existence of KMP is the main reason for better wear performances of KM specimens.
Acknowledgements
The authors would thank Sinoma Institute of Materials Research (Guang Zhou) Co., Ltd. for the assistance in TEM characterisation.
Disclosure statement
No potential conflict of interest was reported by the author(s).
Additional information
Funding
Notes on contributors
Hong Wu
Hong Wu is a professor of Central South University.
Yaojia Ren
Yaojia Ren is a currently PhD candidate of Central South University.
Junye Ren
Junye Ren is a master's degree holder in material science and engineering with Central South University.
Anhui Cai
Anhui Cai is a professor of Hunan Institute of Science and Technology.
Min Song
Min Song is a professor of Central South University.
Yong Liu
Yong Liu is a professor of Central South University.
Xiaolan Wu
Xiaolan Wu is a professor of Beijing University of Technology.
Qingxiang Li
Qingxiang Li is in the Shenzhen Zhong Jin Ling Nan Nonfemet Co., Ltd, China.
Weidong Huang
Weidong Huang is a professor of Northwestern Polytechnical University.
Xiaoteng Wang
Xiaoteng Wang is in the Lancaster University.
Ian Baker
Ian Baker is a professor of Dartmouth College.
References
- Aboulkhair, Nesma T., Ian Maskery, Chris Tuck, Ian Ashcroft, and Nicola M. Everitt. 2016. “On the Formation of AlSi10Mg Single Tracks and Layers in Selective Laser Melting: Microstructure and Nano-Mechanical Properties.” Journal of Materials Processing Technology 230: 88–98. doi: https://doi.org/10.1016/j.jmatprotec.2015.11.016
- Aboulkhair, Nesma T., Marco Simonelli, Luke Parry, Ian Ashcroft, Christopher Tuck, and Richard Hague. 2019. “3D Printing of Aluminium Alloys: Additive Manufacturing of Aluminium Alloys Using Selective Laser Melting.” Progress in Materials Science 106: 100578. doi: https://doi.org/10.1016/j.pmatsci.2019.100578
- Basavakumar, K. G., P. G. Mukunda, and M. Chakraborty. 2009. “Dry Sliding Wear Behaviour of Al–12Si and Al–12Si–3Cu Cast Alloys.” Materials & Design 30 (4): 1258–1267. doi: https://doi.org/10.1016/j.matdes.2008.07.003
- Bi, Jiang, Zhenglong Lei, Yanbin Chen, Xi Chen, Ze Tian, Jingwei Liang, Xikun Qin, and Xinrui Zhang. 2020. “Densification, Microstructure and Mechanical Properties of an Al-14.1Mg-0.47Si-0.31Sc-0.17Zr Alloy Printed by Selective Laser Melting.” Materials Science and Engineering: A 774: 138931. doi: https://doi.org/10.1016/j.msea.2020.138931
- Cunningham, Ross, Cang Zhao, Niranjan Parab, Christopher Kantzos, Joseph Pauza, Kamel Fezzaa, Tao Sun, and Anthony D. Rollett. 2019. “Keyhole Threshold and Morphology in Laser Melting Revealed by Ultrahigh-Speed x-ray Imaging.” Science 363 (6429): 849–852. doi: https://doi.org/10.1126/science.aav4687
- Demir, Ali Gökhan, and Carlo Alberto Biffi. 2019. “Micro Laser Metal Wire Deposition of Thin-Walled Al Alloy Components: Process and Material Characterization.” Journal of Manufacturing Processes 37: 362–369. doi: https://doi.org/10.1016/j.jmapro.2018.11.017
- Deuis, R. L., C. Subramanian, and J. M. Yellup. 1997. “Dry Sliding Wear of Aluminium Composites: A Review.” Composites Science and Technology 57 (4): 415–435. doi: https://doi.org/10.1016/S0266-3538(96)00167-4
- Dowden, John. 2009. The Theory of Laser Materials Processing.
- Ehtemam-Haghighi, Shima, Guanghui Cao, and Lai-Chang Zhang. 2017. “Nanoindentation Study of Mechanical Properties of Ti Based Alloys with Fe and Ta Additions.” Journal of Alloys and Compounds 692: 892–897. doi: https://doi.org/10.1016/j.jallcom.2016.09.123
- Ghayoor, Milad, Kijoon Lee, Yujuan He, Chih-hung Chang, Brian K Paul, and Somayeh Pasebani. 2019. “Selective Laser Melting of 304 L Stainless Steel: Role of Volumetric Energy Density on the Microstructure, Texture and Mechanical Properties.” Additive Manufacturing 32: 101011. doi: https://doi.org/10.1016/j.addma.2019.101011
- Girelli, L., M. Tocci, L. Montesano, M. Gelfi, and A. Pola. 2017. “Optimization of Heat Treatment Parameters for Additive Manufacturing and Gravity Casting AlSi10Mg Alloy.” IOP Conference Series: Materials Science and Engineering 264: 012016. doi: https://doi.org/10.1088/1757-899X/264/1/012016
- Greer, A. L., K. L. Rutherford, and I. M. Hutchings. 2002. “Wear Resistance of Amorphous Alloys and Related Materials.” International Materials Reviews 47 (2): 87–112. doi: https://doi.org/10.1179/095066001225001067
- Guo, Meng, Dongdong Gu, Lixia Xi, Lei Du, Hongmei Zhang, and Jiayao Zhang. 2019. “Formation of Scanning Tracks During Selective Laser Melting (SLM) of Pure Tungsten Powder: Morphology, Geometric Features and Forming Mechanisms.” International Journal of Refractory Metals and Hard Materials 79: 37–46. doi: https://doi.org/10.1016/j.ijrmhm.2018.11.003
- Guraya, T., S. Singamneni, and Z. W. Chen. 2019. “Microstructure Formed During Selective Laser Melting of IN738LC in Keyhole Mode.” Journal of Alloys and Compounds 792: 151–160. doi: https://doi.org/10.1016/j.jallcom.2019.03.419
- Hadadzadeh, Amir, Babak Shalchi Amirkhiz, and Mohsen Mohammadi. 2019. “Contribution of Mg2Si Precipitates to the Strength of Direct Metal Laser Sintered AlSi10Mg.” Materials Science and Engineering: A 739: 295–300. doi: https://doi.org/10.1016/j.msea.2018.10.055
- Herrera-Jimenez, E. J., A. Raveh, T. Schmitt, E. Bousser, J. E. Klemberg-Sapieha, and L. Martinu. 2019. “Solid Solution Hardening in Nanolaminate ZrN-TiN Coatings with Enhanced Wear Resistance.” Thin Solid Films 688: 137431. doi: https://doi.org/10.1016/j.tsf.2019.137431
- Joshi, Sumit, Ramesh Chandra Singh, and Rajiv Chaudhary. 2019. “Microstructural and Wear Characterisation of as-Cast AS21A Magnesium Alloy.” Journal of Physics: Conference Series 1240: 012127.
- Kang, Nan, Pierre Coddet, Hanlin Liao, Tiphaine Baur, and Christian Coddet. 2016. “Wear Behavior and Microstructure of Hypereutectic Al-Si Alloys Prepared by Selective Laser Melting.” Applied Surface Science 378: 142–149. doi: https://doi.org/10.1016/j.apsusc.2016.03.221
- Leary, Martin, Tobias Maconachie, Avik Sarker, Omar Faruque, and Milan Brandt. 2019. “Mechanical and Thermal Characterisation of AlSi10Mg SLM Block Support Structures.” Materials & Design 183: 108138. doi: https://doi.org/10.1016/j.matdes.2019.108138
- Li, Y., J. Zhou, P. Pavanram, M. A. Leeflang, L. I. Fockaert, B. Pouran, N. Tümer, K.-U. Schröder, J. M. C. Mol, and H. Weinans. 2018. “Additively Manufactured Biodegradable Porous Magnesium.” Acta Biomaterialia 67: 378–392. doi: https://doi.org/10.1016/j.actbio.2017.12.008
- Long, Teng, Xiaohong Zhang, Qianli Huang, Ling Liu, Yong Liu, Junye Ren, Yong Yin, Dengke Wu, and Hong Wu. 2018. “Novel Mg-Based Alloys by Selective Laser Melting for Biomedical Applications: Microstructure Evolution, Microhardness and in Vitro Degradation Behaviour.” Virtual and Physical Prototyping 13 (2): 71–81. doi: https://doi.org/10.1080/17452759.2017.1411662
- Mao, Cong, Chang Liang, Yuchen Zhang, Mingjun Zhang, Yongle Hu, and Zhuming Bi. 2017. “Grinding Characteristics of cBN-WC-10Co Composites.” Ceramics International 43 (18): 16539–16547. doi: https://doi.org/10.1016/j.ceramint.2017.09.040
- Medeiros, B. B., M. M. Medeiros, J. Fornell, J. Sort, M. D. Baró, and A. M. Jorge Junior. 2015. “Nanoindentation Response of Cu–Ti Based Metallic Glasses: Comparison Between as-Cast, Relaxed and Devitrified States.” Journal of Non-Crystalline Solids 425: 103–109. doi: https://doi.org/10.1016/j.jnoncrysol.2015.05.035
- Mizev, A. I., and D. Schwabe. 2009. “Convective Instabilities in Liquid Layers with Free Upper Surface Under the Action of an Inclined Temperature Gradient.” Physics of Fluids 21 (11): 112102. doi: https://doi.org/10.1063/1.3251755
- Okoro, Avwerosuoghene Moses, Ronald Machaka, Senzeni Sipho Lephuthing, Samuel Ranti Oke, Mary Ajimegoh Awotunde, and Peter Apata Olubambi. 2019. “Nanoindentation Studies of the Mechanical Behaviours of Spark Plasma Sintered Multiwall Carbon Nanotubes Reinforced Ti6Al4 V Nanocomposites.” Materials Science and Engineering: A 765: 138320. doi: https://doi.org/10.1016/j.msea.2019.138320
- Oliver, Warren Carl, and George Mathews Pharr. 1992. “An Improved Technique for Determining Hardness and Elastic Modulus Using Load and Displacement Sensing Indentation Experiments.” Journal of Materials Research 7 (6): 1564–1583. doi: https://doi.org/10.1557/JMR.1992.1564
- Pintaude, Giuseppe. 2013. “Introduction of the Ratio of the Hardness to the Reduced Elastic Modulus for Abrasion.” In Tribology-Fundamentals and Advancements. IntechOpen.
- Prashanth, K. G., B. Debalina, Z. Wang, P. F. Gostin, A. Gebert, M. Calin, U. Kühn, M. Kamaraj, S. Scudino, and J. Eckert. 2014. “Tribological and Corrosion Properties of Al–12Si Produced by Selective Laser Melting.” Journal of Materials Research 29 (17): 2044–2054. doi: https://doi.org/10.1557/jmr.2014.133
- Qi, Ting, Haihong Zhu, Hu Zhang, Jie Yin, Linda Ke, and Xiaoyan Zeng. 2017. “Selective Laser Melting of Al7050 Powder: Melting Mode Transition and Comparison of the Characteristics Between the Keyhole and Conduction Mode.” Materials & Design 135: 257–266. doi: https://doi.org/10.1016/j.matdes.2017.09.014
- Riley, R. J., and G. P. Neitzel. 1998. “Instability of Thermocapillary–Buoyancy Convection in Shallow Layers. Part 1. Characterization of Steady and Oscillatory Instabilities.” Journal of Fluid Mechanics 359: 143–164. doi: https://doi.org/10.1017/S0022112097008343
- Robinson, Joseph Henry, Ian Robert Thomas Ashton, Eric Jones, Peter Fox, and Chris Sutcliffe. 2019. “The Effect of Hatch Angle Rotation on Parts Manufactured Using Selective Laser Melting.” Rapid Prototyping Journal 25 (2): 289–298. doi: https://doi.org/10.1108/RPJ-06-2017-0111
- Shrestha, Subin, and Y. Kevin Chou. 2019. “A Numerical Study on the Keyhole Formation During Laser Powder Bed Fusion Process.” Journal of Manufacturing Science and Engineering 141 (10): 101002. doi: https://doi.org/10.1115/1.4044100
- Sol, T., S. Hayun, D. Noiman, E. Tiferet, O. Yeheskel, and O. Tevet. 2018. “Nondestructive Ultrasonic Evaluation of Additively Manufactured AlSi10Mg Samples.” Additive Manufacturing 22: 700–707. doi: https://doi.org/10.1016/j.addma.2018.06.016
- Tang, Wei-chen, Zhong-yu Piao, Jian Zhang, Shi-ying Liu, and Li-jun Deng. 2020. “Effect of Trace Elements on the Pinhole Fatigue-Resistance of Gasoline Al-Si Piston Alloy.” Engineering Failure Analysis 108: 104340. doi: https://doi.org/10.1016/j.engfailanal.2019.104340
- Teng, Chong, Deepankar Pal, Haijun Gong, Kai Zeng, Kevin Briggs, Nachiket Patil, and Brent Stucker. 2017. “A Review of Defect Modeling in Laser Material Processing.” Additive Manufacturing 14: 137–147. doi: https://doi.org/10.1016/j.addma.2016.10.009
- Thanki, Aditi, Louca Goossens, Raya Mertens, Gabriel Probst, Wim Dewulf, Ann Witvrouw, and Shofeng Yang. 2019. “Study of Keyhole-Porosities in Selective Laser Melting Using X-ray Computed Tomography.” Proceedings of iCT 2019: 1–7.
- Trevisan, Francesco, Flaviana Calignano, Massimo Lorusso, Jukka Pakkanen, Alberta Aversa, Elisa Ambrosio, Mariangela Lombardi, Paolo Fino, and Diego Manfredi. 2017. “On the Selective Laser Melting (SLM) of the AlSi10Mg Alloy: Process, Microstructure, and Mechanical Properties.” Materials 10 (1): 76. doi: https://doi.org/10.3390/ma10010076
- Tsotridis, G., H. Rother, and E. D. Hondros. 1989. “Marangoni Flow and the Shapes of Laser-Melted Pools.” The Science of Nature 76 (5): 216–218. doi: https://doi.org/10.1007/BF00627691
- Vierneusel, Bernd, Lisa Benker, Stephan Tremmel, Mathias Göken, and Benoit Merle. 2017. “Isolating the Effect of Residual Stresses on Coating Wear by a Mechanical Stress Relaxation Technique.” Thin Solid Films 638: 159–166. doi: https://doi.org/10.1016/j.tsf.2017.06.016
- Wahab, M. S., Aqeel Ahmed, A. A. Raus, K. Kamarudin, and E. Z. Radzi. 2019. “The DTA Curves for Melting of Hypereutectic AlSi Alloy.” International Journal of Engineering & Technology 8 (1.1): 31–35.
- Wang, Y. Morris, Thomas Voisin, Joseph T. Mckeown, Jianchao Ye, and Ting Zhu. 2017. “Additively Manufactured Hierarchical Stainless Steels with High Strength and Ductility.” Nature Materials 17 (1): 63–71. doi: https://doi.org/10.1038/nmat5021
- Wei, Pei, Zhengying Wei, Zhen Chen, Jun Du, Yuyang He, Junfeng Li, and Yatong Zhou. 2017. “The AlSi10Mg Samples Produced by Selective Laser Melting: Single Track, Densification, Microstructure and Mechanical Behavior.” Applied Surface Science 408: 38–50. doi: https://doi.org/10.1016/j.apsusc.2017.02.215
- Wu, Hong, Ian Baker, Yong Liu, Xiaolan Wu, Paul R. Munroe, and Jiangang Zhang. 2013. “Tribological Studies of a Zr-Based Bulk Metallic Glass.” Intermetallics 35: 25–32. doi: https://doi.org/10.1016/j.intermet.2012.11.010
- Wu, Hong, Junye Ren, Qianli Huang, Xiongfei Zai, Ling Liu, Chao Chen, Shifeng Liu, Xin Yang, and Ruidi Li. 2017. “Effect of Laser Parameters on Microstructure, Metallurgical Defects and Property of AlSi10Mg Printed by Selective Laser Melting.” Journal of Micromechanics and Molecular Physics 2(4): 1750017. doi: https://doi.org/10.1142/S2424913017500175
- Xi, Lixia, Shuang Guo, Dongdong Gu, Meng Guo, and Kaijie Lin. 2020. “Microstructure Development, Tribological Property and Underlying Mechanism of Laser Additive Manufactured Submicro-TiB2 Reinforced Al-Based Composites.” Journal of Alloys and Compounds 819: 152980. doi: https://doi.org/10.1016/j.jallcom.2019.152980
- Xiong, Z. H., S. L. Liu, S. F. Li, Y. Shi, Y. F. Yang, and R. D. K. Misra. 2019. “Role of Melt Pool Boundary Condition in Determining the Mechanical Properties of Selective Laser Melting AlSi10Mg Alloy.” Materials Science and Engineering: A 740: 148–156. doi: https://doi.org/10.1016/j.msea.2018.10.083
- Yang, Jingjing, Jie Han, Hanchen Yu, Jie Yin, Ming Gao, Zemin Wang, and Xiaoyan Zeng. 2016. “Role of Molten Pool Mode on Formability, Microstructure and Mechanical Properties of Selective Laser Melted Ti-6Al-4V Alloy.” Materials & Design 110: 558–570. doi: https://doi.org/10.1016/j.matdes.2016.08.036
- Yin, Yong, Qianli Huang, Luxin Liang, Xiaobo Hu, Tang Liu, Yuanzhi Weng, Teng Long, Yong Liu, Qingxiang Li, and Shaoqiang Zhou. 2019. “In Vitro Degradation Behavior and Cytocompatibility of ZK30/Bioactive Glass Composites Fabricated by Selective Laser Melting for Biomedical Applications.” Journal of Alloys and Compounds 785: 38–45. doi: https://doi.org/10.1016/j.jallcom.2019.01.165
- Yusoff, Zamri, and Shamsul Baharin Jamaludin. 2011. “Tribology and Development of Wear Theory: Review and Discussion.” International Journal of Current Research and Review 3 (2): 13–26.
- Zhang, Jinliang, Bo Song, Qingsong Wei, Dave Bourell, and Yusheng Shi. 2019. “A Review of Selective Laser Melting of Aluminum Alloys: Processing, Microstructure, Property and Developing Trends.” Journal of Materials Science & Technology 35 (2): 270–284. doi:https://doi.org/10.1016/j.jmst.2018.09.004.
- Zhou, F. F., L. P. Xu, C. M. Deng, J. B. Song, C. G. Deng, Y. Wang, and M. Liu. 2019. “Nanomechanical Characterization of Nanostructured La2(Zr0.75Ce0.25)2O7 Thermal Barrier Coatings by Nanoindentation.” Applied Surface Science 505: 144585. doi: https://doi.org/10.1016/j.apsusc.2019.144585
- Zhou, Libo, Tiechui Yuan, Ruidi Li, and Lanbo Li. 2019. “Two Ways of Evaluating the Wear Property of Ti-13Nb-13Zr Fabricated by Selective Laser Melting.” Materials Letters 242: 9–12. doi: https://doi.org/10.1016/j.matlet.2019.01.015