
ABSTRACT
NiTi-Fe ternary shape memory alloys were produced by laser powder bed fusion (L-PBF) using the pre-alloyed NiTi and elemental Fe powders. A large process window exists to fabricate dense NiTiFe0.3 and NiTiFe0.5 alloys, while severe cracks occur in the NiTiFe2 alloy. The cracking susceptibility is studied through thermodynamic analysis. Fe is mainly dissolved in the NiTi matrix, which is mainly due to the low Fe addition and rapid cooling associated with L-PBF process. The martensite transformation temperatures (MTTs) decrease monotonously with the increase of scanning speed, the decrease of laser power, or the increase of Fe addition, providing a feasible approach to tailoring the MTTs. Due to the decrease of the MTTs, the NiTiFe0.3 and NiTiFe0.5 alloys show good superelasticity, e.g. the NiTiFe0.3 alloy shows a superelastic recoverable strain of 5.2% (pre-strain of 6%). This work suggests that L-PBF is a potential method to in-situ synthesise ternary NiTiFe alloys.
1. Introduction
Near-equiatomic NiTi shape memory alloy (SMA) is attracting increasing interest in both medical and non-medical fields (Biesiekierski et al. Citation2012; Elahinia et al. Citation2012) due to its unique functional properties (i.e. shape memory effect, SME and superelasticity, SE) (Otsuka and Ren Citation2005), exceptional mechanical performance (total elongation of >50% (Miyazaki et al. Citation1990)) and good biocompatibility (Zheng et al. Citation2011; Li et al. Citation2019). SME (also called thermal memory) means that a deformed material could return to its original shape upon heating, while microscopically, it originates from thermal-induced thermoelastic martensitic transformation between a B2 structured austenite (A) and a B19’ structured martensite (M) phase (Otsuka and Ren Citation2005). SE (also called mechanical memory) refers to that a deformed material could recover its original shape upon unloading, which originates from the stress-induced thermoelastic martensitic transformation between austenite and martensite. In order to expand the application of binary NiTi alloys, many studies have been conducted to modify the transformation behaviour, including thermo-mechanical treatments (Otsuka and Ren Citation2005; Wang et al. Citation2015, Citation2019), tailoring chemical composition (Frenzel et al. Citation2007, Citation2010, Citation2015) and adding ternary alloying elements (Zhang et al. Citation2017; Shi et al. Citation2018; Fan et al. Citation2019).
Compared with other methods, the potential of adding the third element has been emphasised (Otsuka and Ren Citation2005; Sampath and Nguyen Citation2022). Fe is added into binary NiTi to obtain NiTiFe ternary alloy with low martensitic transformation temperatures (MTTs) (Xu et al. Citation2000; Zhang et al. Citation2021c), which has been widely used as couplings in the past decades (Barik and Samal Citation2022). NiTiNb alloy with a wide transformation hysteresis has been developed also for the application in couplings and sealings (Barik and Samal Citation2022), especially the one with nominal composition of Ni47Ti44Nb9 (He et al. Citation2005; Shu et al. Citation2014; Chen et al. Citation2015). NiTi-based high temperature SMAs have been designed by replacing Ni or Ti with the third element such as Hf and Zr, which enable their applications at temperatures of >400 K (Ma, Karaman, and Noebe Citation2013; Hayrettin et al. Citation2019). Nevertheless, the fabrication of ternary NiTi-X alloys via conventional metallurgical method (e.g. casting) is quite challenging, mainly due to the following issues: (i) high reactivity of Ni or Ti with the ternary elements, leads to the formation of intermetallics; (ii) large difference in melting points between Ni, Ti and the ternary alloying elements (e.g. Nb, Hf). Moreover, it is rather difficult to fabricate complex NiTi-X ternary alloy structures via conventional processing techniques (e.g. machining and welding), due to the low weldability and poor machinability associated with the NiTi-based alloys (Weinert and Petzoldt Citation2004; Hassan, Mehrpouya, and Dawood Citation2014; Oliveira, Miranda, and Braz Fernandes Citation2017).
Additive manufacturing (AM) is attracting increasing interest (DebRoy et al. Citation2018; Kim et al. Citation2020; Gu et al. Citation2021; Bandyopadhyay, Zhang, and Onuike Citation2022) due to its advantage in fabricating geometrically complex parts. AM of binary NiTi alloys has been studied frequently in the past decade (Bormann et al. Citation2014; Haberland et al. Citation2014; Parvizi et al. Citation2020; Wang et al. Citation2020; Lu et al. Citation2022a; Xue et al. Citation2022). The densification behaviour, phase transformation characteristics and functional properties with respect to the change of process conditions have been emphasised (Haberland et al. Citation2014; Wang et al. Citation2020; Xue et al. Citation2021). Laser powder bed fusion (L-PBF) fabricated NiTi parts with good mechanical and functional properties have been reported (Xiong et al. Citation2019; Wang et al. Citation2020; Zhang et al. Citation2020; Lu et al. Citation2021, Citation2022b; Xue et al. Citation2021; Xue et al. Citation2022). Moreover, in our previous work (Wang et al. Citation2020), it was found that the MTTs of the binary NiTi alloy change monotonously with the individual change of scanning speed (v), laser power (P) or hatch spacing (h), providing a feasible approach to tailoring the MTTs and the functional properties.
However, the binary NiTi alloy could not meet the requirements for some special applications due to its intrinsic transformation characteristics. For example, the operating temperature of binary NiTi alloys is normally below 373 K, and could not be used at high temperature occasions (>400 K). Therefore, the development of NiTi-X ternary shape memory alloys has attracted increasing interest (Zhang et al. Citation2017; Shi et al. Citation2018; Fan et al. Citation2019). However, AM of NiTi-X ternary SMAs has not been studied in depth (Elahinia et al. Citation2018; Toker et al. Citation2020).
Recently, in-situ alloying by L-PBF of mixed powders has received more attention due to its potential on rapid design and verification of novel alloys (Martinez, Todd, and Mumtaz Citation2019; Zhang et al. Citation2019; Sing and Yeong Citation2020; Sing et al. Citation2021; Zhang et al. Citation2021b). As compared with LPBF using composition-specific pre-alloyed powders, in-situ alloying is more flexible to modify the composition and microstructure, as well as reduces time and costs. In order to explore the potential of L-PBF on in-situ alloying of NiTi-X ternary SMAs and the ability to tailor the transformation behaviour, the attempt is reported in this work to fabricate NiTi-X ternary SMAs by L-PBF, taking the NiTiFe alloy as an example, from a mixture of pre-alloyed NiTi and elemental Fe powders. The influence of Fe addition on the densification behaviour, microstructure, phase transformation characteristics and functional properties of NiTiFex (x = 0, 0.3, 0.5, 2.0 at.%) alloy is studied. The results suggest: (i) L-PBF is a potential metallurgical method to in-situ synthesise ternary NiTiFe alloys; (ii) L-PBF provides a feasible approach to tailoring the transformation behaviour and functional properties of NiTiFe alloys.
2. Experimental procedure
2.1 Thermodynamic calculations
Ni-Ti-Fe equilibrium phase diagram is calculated using the Thermo-Calc (Andersson et al. Citation2002) software and the TCNi8: Ni-Alloys v8.2 database. The section with Ni/Ti ratio of 1 is given in (a), showing the pseudo-binary NiTi-Fe equilibrium phase diagram. The intermetallic phases, and solidification range are considered as the two important aspects to preliminarily estimate the printability of NiTiFe alloy. (a) shows that Fe has a high solubility in the NiTi matrix at elevated temperatures (e.g. around 10 at.% at the temperature >1200 K). However, brittle Ni3Ti intermetallics will precipitate due to the decreasing solubility of Fe in the NiTi matrix during cooling, and the amount of Ni3Ti phase increases with the increase of Fe addition. The solidification range (i.e. the temperature window between the liquidus and solidus) decreases first and then increases with the increase of Fe content ((b)). The solidification range is 2.9, 1.2 and 16.4 K with the Fe content of 0.3, 0.5 and 2.0 at.%, respectively. It is suggested that a wide solidification range will increase the probability for hot cracking (Li et al. Citation2020; Deng et al. Citation2021; Sui et al. Citation2021).
Figure 1. Pseudo-binary NiTi-Fe phase diagram (a), and its NiTi-rich side (b) calculated by the Thermo-Calc software using TCNi8: Ni-Alloys v8.2 database.
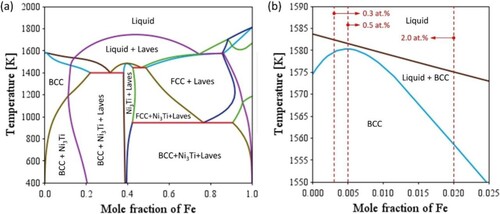
suggests that a small amount of Fe addition is favourable for good printability due to: (i) narrow solidification range, and (ii) reduced tendency toward formation of intermetallics. Therefore, low Fe content (0.3 or 0.5 at.%) is selected in this work for L-PBF in-situ alloying of NiTiFe alloys. The alloy with high Fe content (2.0 at.%) is also studied for comparison since conventional NiTiFe alloys normally have a high Fe content (e.g. 2.0 or 3.0 at.%) (Chen et al. Citation2021; Zhang et al. Citation2021c).
2.2 Feedstock powders
In this work, spherical pre-alloyed NiTi powders with nominal composition of Ti-50.6 at.% Ni and size of 15-53 µm (Minatech Co., Ltd., Shenzhen, China), and spherical Fe powders (>99.9 purity, Pantian Nano Materials Co., Ltd., Shanghai, China) with size of <10 µm were used. The chemical composition of the NiTi and Fe powders is given in Tables S1 and S2 in the supplement. NiTi-Fe powder mixtures with Fe content of 0.3, 0.5 and 2.0 at.%, labelled as NiTiFe0.3, NiTiFe0.5 and NiTiFe2, respectively, were prepared by mechanically mixing the NiTi and Fe powders using a tumbler mixer. (a and b) show the morphology of NiTi and Fe powders, respectively. Both the NiTi and Fe powders have spherical particles with smooth surfaces. Only a few satellite particles are observed. (c) and Figure S1 (in the supplement) show that the fine Fe powders mainly disperse on the surface of NiTi particles without apparent agglomeration.
Figure 2. Secondary electron images showing the morphology of (a) NiTi, (b) pure Fe and (c) NiTiFe2 powders. (d) Particle size distribution of the NiTi, Fe and NiTiFex powders, measured by laser diffraction method, (e) X-ray diffraction spectra of the NiTi and Fe powders, collected at room temperature and (f) transformation behaviour of the NiTi, Fe and NiTiFex powders, characterised by differential scanning calorimetry.
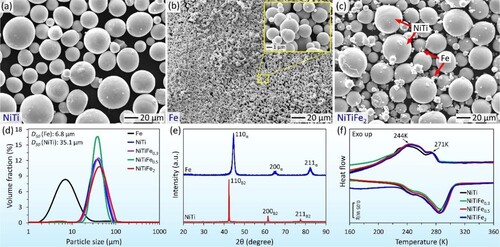
(d) shows the particle size distribution of NiTi, Fe and NiTiFex powders, as characterised by the laser diffraction method on a Malvern Panalytical Mastersizer 3000 particle size analyser. D50 of the NiTi and Fe powders is 35.1 and 6.8 μm, respectively. (e) shows the phase composition, as characterised by X-ray diffraction (XRD), of the NiTi and Fe powders at room temperature. The NiTi powders are mainly in B2 phase, and the Fe powders are in α-Fe phase. No obvious peak reflecting the secondary phase is detected by XRD. (f) shows the transformation behaviour, as characterised by differential scanning calorimetry (DSC), of the NiTi and NiTiFex powders. Although a small transformation peak is detected at 271 K, the main volume of the powders transforms into martensite at 244 K, indicating that the NiTi powders are slightly Ni-rich (Frenzel et al. Citation2010). No additional peak is detected in the NiTiFex powders since no transformation occurs in Fe powders at the temperature range for DSC measurements (123–423 K).
2.3 L-PBF process
NiTi and NiTiFex samples were fabricated on a NiTi baseplate using a commercial Laser Powder Bed Fusion (L-PBF) system (Renishaw RenAM 500E) equipped with a fibre laser of 500 W (beam size of 80 µm). All L-PBF experiments were processed under a continuous laser mode. The baseplate pre-heating function was not employed during the L-PBF process. In order to minimise the contamination by oxygen, the building chamber was first vacuumed to a pressure of −900 mbar followed by filling with high purity (>99.999%) argon gas. The process was repeated three times to reach a low oxygen content of <20 ppm before the laser was switched on. Afterwards, the chamber was filled with argon under a pressure of ca. 20 mbar higher than the atmospheric pressure. The rotated stripe scanning strategy was employed. The stripe width was 5 mm, and the rotation between successive layers is 67°.
In this work, different laser power (P) of 80–240 W and scanning speed (v) of 500–1200 mm s−1 were used to produce the NiTiFex samples. The hatch spacing of 80 μm and layer thickness of 30 μm were fixed for all samples. The detailed L-PBF process parameters used in this work are listed in . Small samples with size of 6×8×8 mm3 were prepared for characterising the density, microstructure and phase transformation behaviour. NiTiFex alloy blocks with a geometry of 60 (length)×10 (width)×8 (height) mm3 were produced for testing the mechanical properties. The blocks were first cut into slices (thickness of 2 mm) along the direction perpendicular to build direction using a wire electrical discharge machine. Afterwards, the plates were cut into dog-bone shaped specimens with a gauge length of 20 mm and width of 3 mm for tensile tests.
Table 1. List of L-PBF process parameters and the calculated volumetric energy density.
2.4 Characterisation techniques
The density of the LPBF fabricated NiTiFex sample was measured based on Archimedes’ principle. The cross-section microstructure of the samples along the build direction was investigated using a scanning electron microscope (SEM, COXEM EM-30+). The samples for SEM observation were etched using Keller’s reagent (1 vol.% HF, 1.5 vol.% HCl, 2.5 vol.% HNO3 and 95 vol.% H2O). The elemental distribution of Ni, Ti and Fe was studied using a JEOL JXA-8530F PLUS electron probe microanalyzer (EPMA). Transmission electron microscopy (TEM) study was conducted in an FEI Talos F200X microscope, operated at an accelerating voltage of 200 kV. The foils for TEM observation were prepared using a Gatan 695 precision ion polishing instrument. Phase composition at room temperature was determined using a Rigaku DMAX-2500PC X-ray Diffractometer (XRD) with Cu Kα radiation under scanning speed of 10° min−1. The crystallographic texture was registered using a Rigaku SmartLab diffractometer also at room temperature. The phase transformation behaviour was characterised using a NETZSCH DSC 3500 Sirius differential scanning calorimeter (DSC) at a cooling/heating rate of 10 K min−1. An MTS testing machine (E44.304) was used to study the mechanical properties and superelasticity under tension mode with a constant strain rate of 1.67×10⁻⁴ s−1 at different temperatures.
3. Results
3.1 Microstructure
shows the density of as-built NiTiFex samples (x = 0, 0.3, 0.5 and 2 at.%) as a function of laser power (80–240 W) and scanning speed (500–1200 mm s−1). Since the theoretical density of NiTiFex alloys is not well defined, the measured value is used to study the densification behaviour. The density of NiTiFex alloy increases generally with the increase of Fe addition since Fe (7.87 g cm−3) has a higher density than NiTi (6.45 g cm−3). (a) indicates that the density of NiTiFex alloy increases first as the laser power increases. For instance, the density of NiTiFe0.5 alloy increases from 6.44 to 6.46 g cm−3 with increasing laser power from 80 to 120 W (v = 800 mm s−1 is fixed). Afterwards, the density of NiTiFex alloy slightly decreases with further increasing the laser power to 240 W. The initial increase in density is attributed to the decrease of lack-of-fusion defects with increasing energy density (Haberland et al. Citation2014). The subsequent decrease in density is due to the increase of porosity (e.g. keyhole pores) under high energy density (Tan et al. Citation2020; Zhao et al. Citation2020). It is worth noting that the laser power corresponding to the peak density varies with the Fe content, which may be due to the variation in laser absorptivity of the powder feedstocks after Fe addition. (b) shows that the density of NiTi binary alloy gradually increases with the increase of scanning speed from 500 to 1200 mm s−1 (P = 140 W is fixed). The density of the NiTiFe0.3 and NiTiFe0.5 alloys maintain at a high level with scanning speed of 700–1200 mm s−1, indicating that there is a large process window to produce dense NiTiFex parts. The large variation in the density of NiTiFe2 alloy is due to severe cracking ().
Figure 3. Density of NiTiFex samples (x = 0, 0.3, 0.5 and 2.0 at.%) fabricated using L-PBF with (a) laser power from 80 to 240 W (v = 800 mm s−1 is fixed), and (b) scanning speed from 500 to 1200 mm s−1 (P = 140 W is fixed).
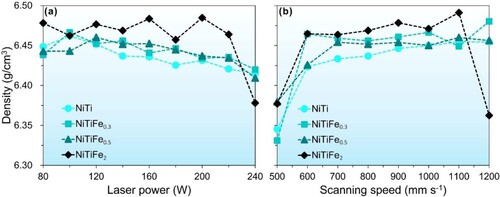
Figure 4. Secondary electron micrographs, taken from the surface parallel to build direction, of the NiTiFex (x = 0, 0.3, 0.5 and 2 at.%) alloys fabricated by L-PBF with scanning speeds of 500, 700 and 1200 mm s−1 (P = 140 W is fixed), respectively. (a–c) binary NiTi, (d–f) NiTiFe0.3, (g–i) NiTiFe0.5 and (j–l) NiTiFe2 alloy. MPBs, GBs and BD represent the melt pool boundaries, grain boundaries and building direction, respectively.
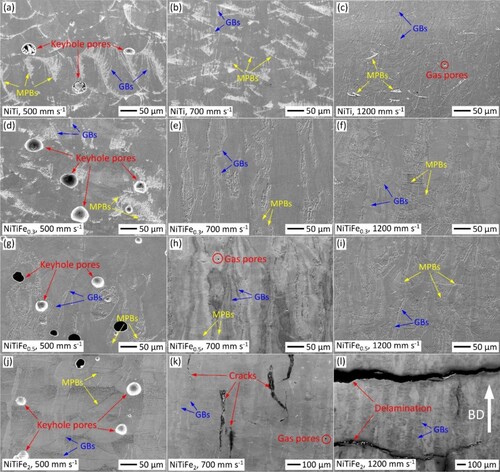
depicts the microstructure of the NiTiFex samples fabricated with different scanning speeds from 500 to 1200 mm s−1 (P = 140 W is fixed). The investigated surface is parallel to the build direction. (a) shows that many large pores with bumpy contour and size of up to 70 μm are formed in the NiTi sample fabricated with v = 500 mm s−1. The large pores are located at the bottom of the melt-pools, indicating that they are keyhole pores. Similar observation has been discussed previously in other L-PBF fabricated metals (DebRoy et al. Citation2018; Tan et al. Citation2020; Zhao et al. Citation2020; Kim et al. Citation2021). The unstable melting regime under extra-high laser energy may cause improper closure of the keyholes, and thus the cavities left in the L-PBF fabricated parts. The large keyhole pores could be minimised by reducing the laser energy input (Zhao et al. Citation2020). As shown in (b), the keyhole pores are mitigated remarkably by increasing the scanning speed to 700 mm s−1, and no obvious pore is detected by SEM from a large area. A few scattered spherical pores with size <10 μm are detected in the sample fabricated under v = 1200 mm s−1. The small spherical pores are considered as gas pores, which originate from entrapping the gas inside the powders, the protection Ar gas, or evaporation of alloying elements (Tan et al. Citation2020).
shows that the microstructural evolution with respect to the increase of scanning speed in NiTiFe0.3 and NiTiFe0.5 alloy is similar to that in binary NiTi alloy. It is worth mentioning that no cracks or delamination is observed in the sample with low Fe addition (0.3 and 0.5 at.%), despite of the large variation of scanning speed and laser power, indicating good printability of NiTiFe0.3 and NiTiFe0.5 alloys.
(j–l) show the microstructure of the NiTiFe2 alloy fabricated with different scanning speed (P = 140 W is fixed). Large keyhole poles are also observed in the sample fabricated with v = 500 mm s−1 ((j)). The keyhole pores are mitigated by the increase of scanning speed to 700 mm s−1 or higher. However, cracks parallel to the build direction ((k)) and delamination ((l)) are observed in the samples fabricated with high scanning speed. The cracks observed in (k) are considered as hot-tearing cracks caused by the increase of solidification range after adding 2.0 at.% Fe. (b) shows that the solidification range increases to 16.4 K with addition of 2.0 at.% Fe under equilibrium conditions. The solidification range is supposed to increase under non-equilibrium conditions (Gowri and Samuel Citation1992), e.g. rapid cooling. Delamination occurs in the NiTiFe2 alloy fabricated with v = 1200 mm s−1 ((l)), which is caused by the poor interlayer bonding at low energy density.
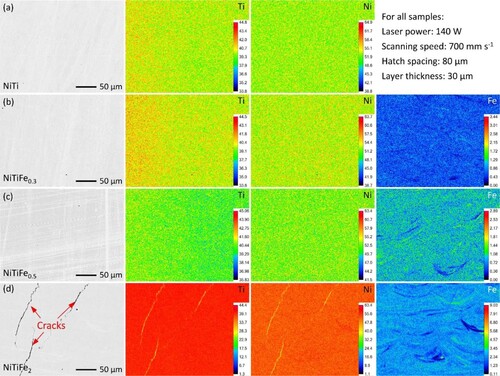
shows the distribution of Ni, Ti and Fe in the NiTiFex (x = 0, 0.3, 0.5, 2.0 at.%) alloys fabricated under the scanning speed of 700 mm s−1 (P = 140 W), as characterised by an electron probe microanalysis (EPMA). Both Ni and Ti distribute homogeneously in all NiTiFex alloys, due to the fact that pre-alloyed binary NiTi powders were used. In contrast, the boundary of melt pools and traces of metal flow can be revealed in the Fe distribution maps. These features become clear for high Fe content (e.g. 2.0 at.% in (d)), indicating an inhomogeneity in the distribution of Fe. During L-PBF process, the laser beam rapidly fuses the powders to form a melt-pool. The strong dynamical melt flow causes violent mixing of liquid metal from different places inside the melt pool, due to multiple physical effects, e.g. Marangoni convection and recoil pressure (Wei and Li Citation2021; Bouabbou and Vaudreuil Citation2022). As a result, the inhomogeneity in the distribution of Fe is attributed to (i) limited diffusion within the melt-pool due to the extremely fast cooling rate associated with the L-PBF process. (ii) lack of mixing, which is also due to the rapid cooling process. Post-process heat treatment and repetitive laser scanning may help to improve the microstructural homogeneity. However, future studies are highly required to study on this issue. It is worth noting that no obvious enrichment in Ni, Ti or Fe at the vicinity of cracks in the NiTiFe2 alloy is detected by means of EPMA.
Figure 5. Electron probe microanalysis (EPMA) images showing the Ti, Ni and Fe element distribution of the NiTiFex (x = 0, 0.3, 0.5 and 2.0 at.%) fabricated with v = 700 mm s−1, P = 140 W and h = 80 μm. (a), (b), (c), (d) show the element distribution of NiTi, NiTiFe0.3, NiTiFe0.5 and NiTiFe2 alloys, respectively. The scale bar represents in wt.%.
shows the detailed microstructure, as captured by TEM, of the as-printed NiTiFex (x = 0, 0.3, 0.5 and 2.0 at.%) alloys fabricated with the same process parameter of P = 140 W, v = 700 mm s−1. Both B2austenite and B19’ martensite phases are observed in the binary NiTi alloy ((a1)), which is due to the fact that the martensite transformation start (Ms) temperature is higher than the testing temperature (around 293 K). The volume fraction of B19’ phase decreases with the increase of Fe addition, and only B2 phase is detected in the NiTiFe2 alloy ((d1)). High density of dislocations is observed in the B2 matrix of NiTi ((a2)) and NiTiFex alloys (e.g. (b2)), mainly due to the high internal stress caused by rapid solidification during L-PBF process. This observation is consistent with previous reports for other LPBF-fabricated metallic materials (DebRoy et al. Citation2018; Wang et al. Citation2021; Zhang et al. Citation2021a; Kim, Kim, and Lee Citation2022). (a3 and c3) show the high-resolution TEM (HRTEM) images for the binary NiTi and NiTiFe0.5 alloys, respectively, taken along [001]B2 direction. The (110)B2 interplanar spacing increases from 2.136 to 2.157 Å with the addition of 0.5 at.% Fe. The lattice distortion of the B2 matrix is indicative of the dissolution of Fe into the NiTi matrix. Similar to the conventional ternary NiTiFe alloy (Otsuka and Ren Citation2005; Sampath and Nguyen Citation2022), the addition of Fe also promotes the occurrence of the R-phase transformation, as confirmed by the presence of extra diffraction spots at 1/3 positions of the B2 reciprocal lattice ((b3)). The volume fraction of the R-phase in the NiTiFe0.3 alloy is supposed to be very low since the R-phase transformation peak is not detected by DSC, which will be discussed in . Some Ti oxides are also observed ((d3)), which may be inherited from the NiTi ingots.
Figure 6. The microstructure, as characterised by transmission electron microscopy (TEM), of the L-PBF fabricated NiTiFex alloys: (a) binary NiTi, (b) NiTiFe0.3, (c) NiTiFe0.5 and (d) NiTiFe2. All the samples were fabricated with the same process parameters of P = 140 W, v = 700 mm s−1, h = 80 μm. BF, DF, HRTEM and HAADF represent the bright field image, dark filed image, high-resolution TEM image and high-angle annular dark-field image, respectively.
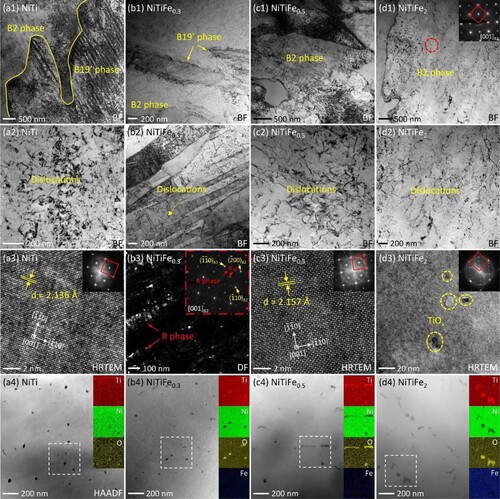
High-angle annular dark-field (HAADF) scanning transmission electron microscopy (STEM) and STEM-EDS analysis in (a4–d4) indicate a rather homogeneous distribution of Fe. The particles enriched in Ti and O are also detected in all NiTiFex (x = 0, 0.3, 0.5 and 2.0 at.%) alloys. The High-resolution TEM image and the corresponding the Fast-Fourier-Transform (FFT) pattern (Figure S2 in the supplement) as well as the EDS point analysis (Table S3 in the supplement) suggest that the particles are Ti4Ni2Ox, which has nearly the same lattice structure as Ti2Ni (Otsuka and Ren Citation2005). also indicates that the size of Ti4Ni2Ox particles increases with the increase of Fe addition to 0.5 and 2.0 at.%. Therefore, the large Ti4Ni2Ox particles in NiTiFe0.5 and NiTiFe2 alloys are mainly caused by the increased oxygen pick-up with the increase of Fe addition, since the fine Fe particles may cause an increase in the absorption of O on the surfaces (Elahinia, Moghaddam et al. Citation2016).
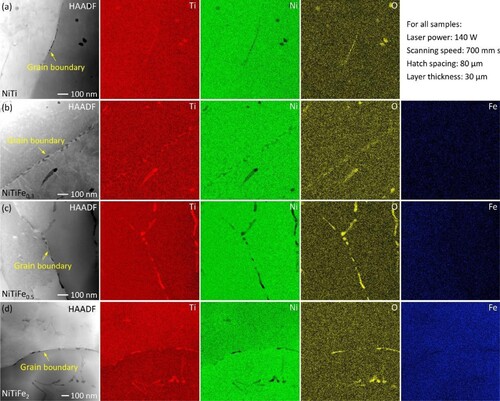
In order to further investigate the distribution of Fe at nano-scale, HAADF and STEM-EDS analysis at the grain boundary region are conducted (). Although the heterogeneity in Fe distribution is observed at micro-scale by means of EMPA (), the HAADF-STEM and the EDS maps do not detect clear segregation of Fe at both grain boundary and in grain interior at nano-scale, indicating that the main fraction of Fe addition is dissolved in the NiTi matrix. This may suggest that ternary NiTiFe alloys could be fabricated by in-situ alloying with NiTi and Fe mixed powders through L-PBF. also shows that the particles rich in Ti and O are present at the grain boundaries. According to the literature (Li et al. Citation2016; Lu et al. Citation2022b), Ti4Ni2Oxis a brittle intermetallic phase that may cause early fracture of NiTi alloys during plastic deformation. Therefore, these particles segregated at grain boundaries will deteriorate largely the mechanical and functional properties of NiTiFex alloys. Appropriate heat treatment may homogenise the distribution of Ti4Ni2Ox phases and mitigate their segregation at grain boundaries, thus improving the mechanical properties of as-printed parts, as suggested by Lu, Liu et al. (2022b).
Figure 7. Elemental maps showing the distribution of Ni, Ti O and Fe at the grain boundaries: (a) NiTi, (b) NiTiFe0.3, (c) NiTiFe0.5, (d) NiTiFe2. The left column shows the HAADF-STEM signal recorded simultaneously with the EDX maps. All samples were fabricated with v = 700 mm s−1, and P = 140 W.
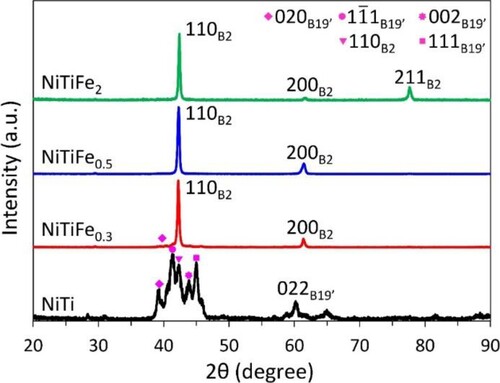
gives the XRD patterns, collected at room temperature, of the NiTiFex alloys fabricated by L-PBF with the same process parameters of P = 140 W, and v = 700 mm s−1. Both B19’ martensite and B2 austenite phases are detected in the binary NiTi alloy, indicating that room temperature is between the martensite transformation start (Ms) and finish (Mf) temperature. The volume fraction of B19’ phase decreases with the addition of 0.3 at.% Fe, indicating a decrease of B2→B19’ transformation temperatures by adding Fe element. The NiTiFe0.5 and NiTiFe2 alloys are fully in B2 austenite phase at room temperature. The decrease of B19’ martensite content with the increase of Fe addition at room temperature is consistent with the TEM results in (a–d). also shows that the diffraction peaks shift to higher angles with the increase of Fe addition. For instance, the (110)B2 peak of NiTiFe0.3 is detected at 2θ of 42.22°. It shifts to 42.26° for the NiTiFe0.5 alloy and further to 42.40° for the NiTiFe2 alloy. The shift of diffraction peaks suggests a strong lattice distortion caused by adding Fe.
Figure 8. X-ray diffraction patterns, collected at room temperature, of the NiTiFex (x = 0, 0.3, 0.5, 2.0 at%) alloys fabricated by L-PBF with the same process parameters: laser power of 140 W, scanning speed of 700 mm s−1, and hatch spacing of 80 μm. The XRD patterns are collected at the surface parallel to the build direction.
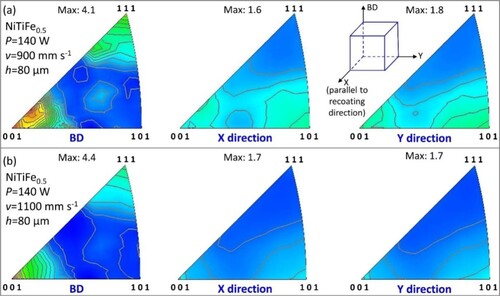
shows the crystallographic texture, as measured by XRD, of the NiTiFe0.5 alloy fabricated by L-PBF with v = 900 and 1100 mm s−1 (P = 140 W is fixed). BD represents the build direction, and X-direction is parallel to the recoating direction, and Y-direction is vertical to the X direction (Figure S3 in the supplement). High scanning speed is used in order to ensure that the sample is fully in the B2 phase at room temperature since the (100)B2, (110)B2 and (211)B2diffraction peaks were used to determine the texture. indicates that the <001 > B2//BD fibre texture is developed in L-PBF fabricated NiTiFe0.5 alloy, which is in good agreement with previous studies on additive manufactured NiTi alloys [45,64,65]. The formation of fibre texture is a result of preferential growth of grains along the maximum temperature gradient, which is parallel to the build direction during L-PBF process (Wei, Mazumder, and DebRoy Citation2015; DebRoy et al. Citation2018). At elevated temperatures (e.g. > 373 K), the NiTiFe alloy is in austenite with BCC (body-centred cubic) crystal structure. Many studies show that the easy growth direction of cubic crystals is <100> (DebRoy et al. Citation2018; Gao et al. Citation2021). Moreover, the crystals prefer to solidify in an epitaxial manner during L-PBF process, leading to the formation of coarse columnar grains (Martin et al. Citation2017; DebRoy et al. Citation2018). As a result, the strong <100 > B2//BD fibre texture is developed. Similar to the binary NiTi alloys (Otsuka and Ren Citation2005), the strong texture will influence the functional properties of NiTiFe alloys, since the transformation strain depends strongly on the crystallographic orientation (Miyazaki, Kimura, and Otsuka Citation1988; Miyazaki Citation2017).
Figure 9. Inverse pole figures, measured by XRD, of the NiTiFe0.5 alloy fabricated by L-PBF with different scanning speeds of: (a) 900 and (b) 1100 mm s−1 (P = 140 W is fixed). BD marks the build direction, and X direction is parallel to the recoating direction.
3.2 Phase transformation behaviour
The phase transformation behaviour, as characterised by DSC, of the NiTiFex (x = 0, 0.3, 0.5 and 2.0 at.%) fabricated with different scanning speed (500–1200 mm s−1) and laser power (80–240 W) is shown in . The variation of the characteristic transformation temperatures with respect to the change of scanning speed and laser power is summarised in (a and b), respectively. (a and b) indicate that all binary NiTi samples show a one-stage A↔M transformation during both cooling and heating. However, MTTs vary largely with respect to the change of process parameters. (a) shows that the MTTs increase monotonously with the decrease of scanning speed. For instance, the martensite transformation peak temperature (Mp) increases by 44 K (from 261 to 305 K) with the decrease of scanning speed from 1200 to 500 mm s−1 ((a)). (b) indicates that the transformation peaks shift to higher temperature side with the increase of laser power. The Mp temperature increases from 240 to 296 K with the increase of laser power from 80 to 240 W. As discussed in our previous work (Wang et al. Citation2020), the increase of MTTs is attributed to the increased Ni-depletion, by evaporation, under high laser energy density.
Figure 10. DSC scans showing the transformation behaviour of the L-PBF fabricated samples: (a–b) NiTi, (c–d) NiTiFe0.3, (e–f) NiTiFe0.5, (g–h) NiTiFe2 alloys. The samples presented in the (a), (c), (e) and (g) are produced with different scanning speeds from 500 to 1200 mm s−1 (P = 140 is fixed). The samples presented in the (b), (d), (f) and (h) are fabricated under different laser powers from 80 to 240 W (v = 800 mm s−1is fixed).
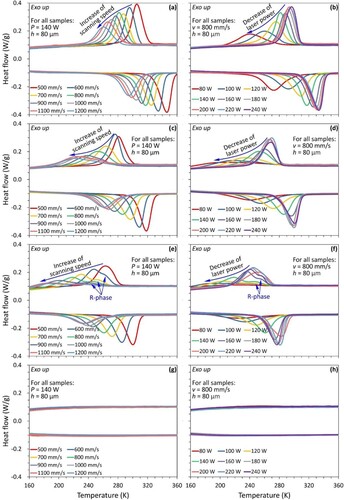
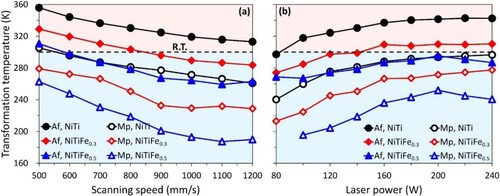
Figure 11. The variation of martensite transformation peak temperature (Mp) and austenite transformation finish temperature (Af) of NiTiFex (x = 0, 0.3, 0.5 and 2.0 at.%) alloys with respect to the change of (a) scanning speed (P = 140 W is fixed), and (b) laser power (v = 800 mm s−1is fixed).
(c–d) show that the NiTiFe0.3 alloy also undergoes one stage A→M, despite of the large variation of L-PBF process parameters. Similar to the binary NiTi alloy, the MTTs of NiTiFe0.3 alloy decreases with the increase of scanning speed ((c)), and increase with the increase of laser power ((d)). Broad transformation peaks are observed in the samples fabricated under low energy density, for example, the sample fabricated under v = 1200 mm s−1 ((c)), and the sample fabricated with P = 80 W ((d)). This is mainly due to the microstructural inhomogeneity at micron scale (), which is enhanced under low laser energy density. indicates that the MTTs of the NiTiFe0.3 alloy is lower than that of the binary NiTi alloy, when fabricated under the same L-PBF conditions. This is due to the fact that the dissolution of Fe into NiTi matrix causes lattice distortion, which suppresses the B19’ transformation (Krishnan et al. Citation2008).
The R-phase transformation is detected in the samples with 0.5 at.% Fe addition ((e and f)), as featured by a small DSC peak preceding the B19’ transformation during cooling. The two stage A→R→M transformation has been frequently reported previously in ternary NiTiFe alloys (Otsuka and Ren Citation2005; Krishnan et al. Citation2008). The addition of Fe causes distortion of NiTi lattice. The lattice deformation suppresses largely the A→M transformation, which associated with a large lattice strain. As a result, an intermediate R-phase transformation, associated with a small lattice strain (around 1%), occurs to help to climb up the energy barrier for martensite transformation (Liu, Kim, and Miyazaki Citation2004; Otsuka and Ren Citation2005), leading to the change of the transformation sequence from one-stage A→M to two stage A→R→M. The MTT of NiTiFe0.5 alloy also increases with the increase of laser energy density ((a–b)). also shows that the MTT is further decreased with the increase of Fe addition to 0.5 at.%.
No obvious transformation peak could be identified in the NiTiFe2 alloy ((g–h)), despite of the large variation of L-PBF process parameters. The addition of a high amount of Fe, e.g. 2.0 at.% in the near-equiatomic NiTi matrix, will cause severe distortion of NiTi lattice, which largely suppresses both the R-phase and B19’ martensite transformation. Therefore, no transformation peak could be detected by means of DSC.
The above results indicate that both the L-PBF process parameters and Fe addition influence the transformation behaviour of L-PBF fabricated NiTiFex (x = 0, 0.3, 0.5 and 2.0 at.%) alloys. The MTTs change monotonically with the respective change of scanning speed or laser power. Moreover, the MTTs are lowered by the increase of Fe addition from 0 to 0.5at.%, and the transformation is not detected by DSC in the alloy with 2.0 at.% Fe. According to , it could be estimated that the transformation temperature drops ca. 10 K for 0.1 at.% increase of Fe content. Similar to the conventional NiTiFe alloys, the addition of Fe also changes the transformation sequence of the L-PBF fabricated NiTiFe alloy from A→M to the two stage A→R→M transformation.
3.3 Mechanical properties
Room temperature superelasticity is essential for utilisation of NiTi-based SMAs, since most of the devices working at RT. In order to obtain RT superelasticity, the Af temperature has to be lower than RT (Otsuka and Ren Citation2005). (a) suggests that the Af temperature of NiTiFe0.3 is lower than RT when v = 900 and 1200 mm s−1 (P = 140 W is fixed). An even wider process window exists for NiTiFe0.5 alloy, covering scanning speeds between 600 and 1200 mm s−1. In order to study the influence of Fe addition on the functional properties of NiTiFex alloy, the samples fabricated using the same L-PBF process parameters of P = 140 W, v = 700 mm s−1 (i.e. V3 in ), were selected.
(a) demonstrates the tensile curves, registered at RT, of the as-built NiTiFex alloys (x = 0, 0.3 and 0.5 at.%). The NiTiFe2 alloy was not tested, since it is very brittle due to severe cracking ((k)). The stress plateau, which corresponds to the stress-induced A→M transformation, is observed in all 3 samples. The binary NiTi and NiTiFe0.3 alloy show good ductility with total elongation of 15.0% and 13.6%, respectively. The NiTiFe0.5 alloy shows a lower ductility with total elongation of 9.2%. According to the TEM results in , the segregation of Ti4Ni2Oxintermetallics at grain boundaries increases with Fe content. The intermetallics deteriorates the continuity of the matrix, leading to the reduced ductility of the NiTiFe0.5 alloy. (a) shows that the plateau stress increases with Fe content, which results from the drop of MTTs with the Fe additions, in accordance with the Clausius–Clapeyron type relation.
Figure 12. (a) Tensile stress–strain curves and (b) superelastic response of the NiTiFex (x = 0, 0.3, 0.5 at.%) alloys fabricated by L-PBF under the same process parameter of P = 140W, v = 700 mm s−1. The tensile tests were conducted at 298 K.
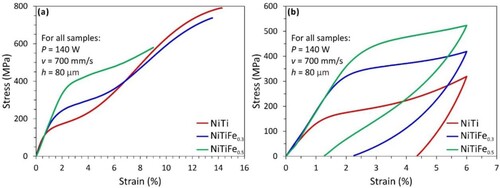
(b) shows the loading-unloading curves (pre-strain of 6%) of the L-PBF fabricated NiTiFex (x = 0, 0.3 and 0.5 at.%) alloy, tested at RT. The NiTiFe0.5 alloy shows good superelasticity with a recoverable strain of 4.7%, since the Af temperature (287 K) below RT. The binary NiTi alloy has a high Af temperature of 336 K and, therefore, shows mostly irrecoverable strain of 4.4% with only traces of superelasticity.
In order to better evaluate the superelasticity of the L-PBF fabricated NiTiFex alloys, cyclic loading-unloading (up to 6%) tests were conducted at a temperature 10 K above Af of each alloy. The stress–strain curves are shown in (a–d), and the residual strain and recoverable strain versus cycle number are summarised in (e and f), respectively. The way to derive the residual and recoverable strain is illustrated in (a). The samples in (a–c) are fabricated under the same L-PBF process parameters of v = 700 mm s−1 and P = 140 W. The NiTiFe0.3 alloy in (d) is fabricated with a higher v = 1200 mm s−1, which has a low Af of 283 K ((a)).
Figure 13. Cyclic loading-unloading curves, tested at temperatures 10 K above Af, for the L-PBF fabricated (a) binary NiTi with v = 700 mm s−1, (b) NiTiFe0.3 with v = 700 mm s−1 (c) NiTiFe0.5, with v = 700 mm s−1 and (d) NiTiFe0.3 with v = 1200 mm s−1. All the samples were fabricated with P = 140 W. Panels (e) and (f) summarise the residual strain and recoverable strain in each cycle, respectively.
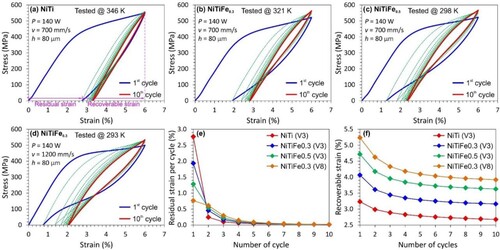
The binary NiTi alloy hardly shows superelasticity, even the testing temperature is 10 K above the Af temperature ((a)). A large residual strain of 2.8% is left after the first loading cycle ((e)), and the stable recoverable strain is only 2.7% after 10 training cycles. This is mainly due to the occurrence of plastic deformation during martensite transformation at elevated temperatures. The superelasticity in SMAs is always a competition between the recoverable stress-induced thermoelastic martensite transformation and the irrecoverable plastic deformation. The critical stress for inducing A→M transformation increases with the increase of testing temperature, while the critical stress for plastic deformation (i.e. yield stress) decreases. As a result, the plastic deformation will prevail when the sample is deformed at elevated temperatures, leading to the loss of superelasticity.
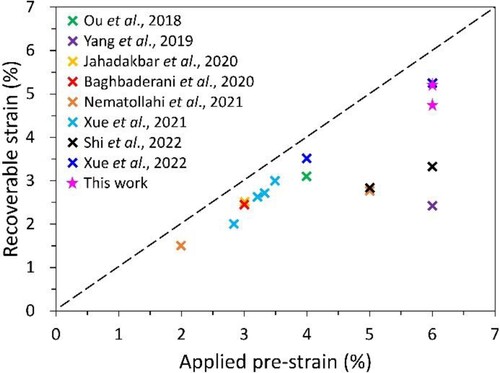
shows that the superelasticity improves with the increase of Fe addition to 0.3 at.% (NiTiFe0.3) and 0.5 at.% (NiTiFe0.5). After 10 training cycles, the stable recoverable strain of NiTiFe0.3 and NiTiFe0.5 alloy is 3.2% and 3.6%, respectively ((f)). The improvement of superelasticity is mainly due to the lower testing temperatures: the critical stress to induce martensite becomes lower while the plastic activities are suppressed. (d) indicates that the NiTiFe0.3 alloy fabricated with a high scanning speed (1200 mm s−1) also shows good superelasticity with a recoverable strain of 5.2% for the first cycle, and a stable recoverable strain of 3.9% after 10 training cycles. It is worth mentioning that the superelasticity achieved in this work is comparable with the results in literature, as indicated in .
Figure 14. The tensile superelasticity of the as-printed NiTiFe alloys in this work and the L-PBF fabricated NiTi alloys reported in literature (Ou et al. Citation2018; Yang et al. Citation2019; Baghbaderani et al. Citation2020; Jahadakbar et al. Citation2020; Nematollahi et al. Citation2021; Xue et al. Citation2021, Citation2022; Shi et al. Citation2022). All the alloys are as-printed state without post-processing heat treatment.
4. Discussions
4.1 Processability of NiTiFex alloy for L-PBF
During the L-PBF process, metallic powders melt rapidly when exposed to laser beams. Inside the melt-pool, the melts mix violently due to the Marangoni convection and recoil pressure (Khairallah et al. Citation2016; Wei and Li Citation2021; Yao et al. Citation2021; Bouabbou and Vaudreuil Citation2022), providing a potential approach for in-situ alloying (Huang et al. Citation2021, Citation2022), when using powder mixture as feedstocks. However, a successful in-situ alloying is quite challenging because of the formation of defects, such as intermetallics and unmelted particles, as well as the common defects (e.g. porosity, cracking) in L-PBF. Optimisation of the process parameters is commonly adopted to mitigate these microstructural defects, but with limited results in some cases. For instance, a porosity-segregation dilemma exists in the L-PBF in-situ alloyed Ti50Ta alloy (Sing, Wiria, and Yeong Citation2018). The addition of alloying elements will affect largely the solidification behaviour, e.g. the size and type of intermetallic phase, compositional segregation tendency, and hot cracking susceptibility.
Cracking is the most serious defect that deteriorates the mechanical properties of an alloy and even leads to the failure of printing. Recently, Kou (Citation2015a) proposed a thermodynamic model for predicting the susceptibility of solidification cracking. The maximum steepness of |dT/dfs1/2| near fs1/2 = 1 is considered as the cracking susceptibility index, where T and fs is the temperature and the fraction of solid, respectively. A higher |dT/dfs1/2| means a lower lateral growth rate of two columnar dendritic grains. Meanwhile, it also causes a longer intergranular liquid channel, which is not conducive for liquid backfilling. The poor grain bridging and liquid feeding ability increase the tendency for hot cracking ((a)). The validity of this model has been experimentally verified in AlSi, AlCu and AlMg alloys (Kou Citation2015b; Liu and Kou Citation2016; Hyer et al. Citation2021).
Figure 15. (a) Schematic of solidification cracking. (b) Temperature vs. fs1/2 of NiTiFex with the Fe content ranging from 0 to 10 at.%. Non-equilibrium solidification behaviour is calculated using Scheil–Gulliver solidification model. (c) Enlarged view of T − fs1/2 curves of NiTiFex alloys (x = 0, 0.3, 0.5, 2.0). The tangential line at fs1/2 = 0.99 is used to determine the maximum steepness of |dT/dfs1/2|. (d) Calculated maximum crack susceptibility index as a function of Fe content. (e) Schematic diagram of the microstructure evolution with increasing Fe content.
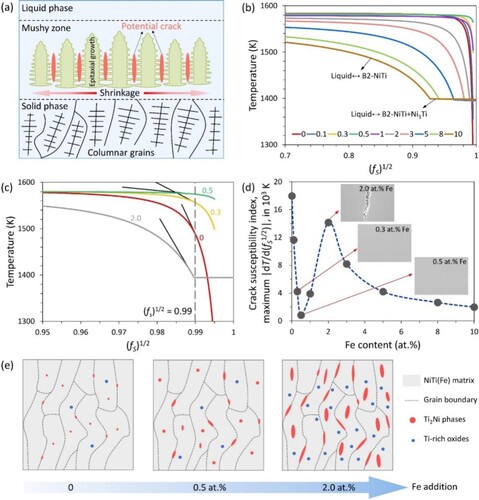
In order to reveal the composition-dependent solidification cracking behaviour of NiTiFex alloys, non-equilibrium solidification behaviour with different Fe addition is examined using the Scheil–Gulliver solidification model in the Thermo-Calc (Andersson et al. Citation2002) software. The T − fs1/2 curves of the NiTiFex alloys with Fe content ranging from 0 to 10 at.% are shown in (b). The maximum steepness of |dT/dfs1/2| is derived at fs1/2 = 0.99 ((c)), which is calculated using the adjacent three sets of T − fs1/2 data based on the statistical slope function (see details in Figure S4 in the supplement). The cracking susceptibility index as a function of Fe content is summarised in (d). As the Fe addition increases from 0 to 0.5 at.%, the crack susceptibility index decreases to a minimum value (at 0.5 at.%). The crack susceptibility increases gradually with further increase of Fe content, and reaches a peak value at 2 at.%. Afterwards, the crack susceptibility decreases slowly upon further increasing the Fe content (> 2 at.%). The alloys with 0.3 and 0.5 at.% Fe additions show a low crack susceptibility, while NiTIFe2 alloy has a high crack susceptibility, which is in good agreement with experimental results (). Although the cracking susceptibility is reduced at a high Fe content (> 3 at.%), the following issues may be caused. (i) The formation of Ti-rich particles, including Ti2Ni and Ti-rich oxides. These particles segregated at grain boundaries may be detrimental to the printability and mechanical properties. As illustrated in and 15e, the size and volume fraction of Ti-rich particles increase with the increase of Fe addition. The formation of Ti-rich particles with the addition of Fe has also been reported in conventionally fabricated NiTiFe alloys (Zhang et al. Citation2017). (ii) The formation of Ni3Ti phase. According to (a), a large number of Ni3Ti intermetallics will form with high Fe addition, which will also deteriorate largely the mechanical properties of NiTiFex alloys. (iii) Inhibition of martensitic transformation. As shown in , no transformation is detected by DSC in the NiTiFe2 alloy. High Fe addition will cause severe lattice distortion of the matrix, which largely inhibits the martensitic transformation, and thus the functional properties.
As discussed above, the amount of alloying element and L-PBF process parameters determine the defects that generated during L-PBF in-situ alloying. In this work, highly dense, crack-free and compositional homogeneous NiTiFe alloys could be in-situ synthesised by L-PBF with NiTi and Fe mixed powders in the case of low Fe addition (0.3 and 0.5 at.%).
4.2 Phase transformation behaviour
The unique thermal history associated with the L-PBF process leads to complex microstructural evolution, including evaporation of alloying elements, pickup of oxygen, formation of precipitates, generation of high density dislocations and accumulation of internal stress ((a)) (Wang, Kustov, and Van Humbeeck Citation2018). Since the phase transformation behaviour of NiTi-based alloys is very sensitive to the microstructural change (Otsuka and Ren Citation2005), it is essential to understand the inter-relationship between the L-PBF process and the transformation behaviour of the NiTiFex alloys.
Figure 16. (a) Schematic of melt-pool behaviour during L-PBF of NiTiFex alloy. (b) Equilibrium vapour pressures of Ni, Ti and Fe elements over the liquid alloy for NiTiFe0.5 alloy. The detailed calculation is presented in the supplement. (c) Variation of Ni, Ti and Fe contents in the NiTiFe0.3 alloy with increasing scanning speed from 500 to 1200 mm s−1 (P = 140 W is fixed). (d) Variation of Ni, Ti and Fe contents in the NiTiFex (x = 0, 0.3 and 0.5 at.%) alloys fabricated with the same process parameter set (v = 700 mm s−1, and P = 140 W). The chemical compositions in (c) and (d) are average values measured at 10 different sites using SEM-EDS point analysis.
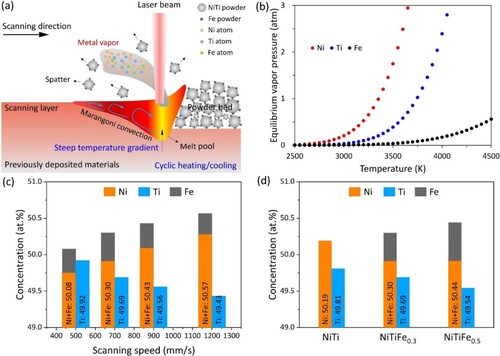
According to our previous work (Wang et al. Citation2020), the variation of Ni/Ti ratio caused by preferential Ni evaporation is the dominant factor influencing the MTTs of binary NiTi alloy under different L-PBF conditions. Similarly, the variation of (Ni + Fe)/Ti ratio caused by Ni evaporation under different laser energy density conditions is considered as the main reason affecting the MTTs of L-PBF-fabricated NiTiFex alloy. The powders melt rapidly when exposed to the high energy laser beam, and the peak temperature in the melt-pool may exceed the boiling point of the elements. As illustrated in (b) and Figure S5 in the supplement, Ni has a higher partial pressure than Ti and Fe in NiTiFe melts at elevated temperatures (e.g. > 3000 K). Consequently, the Ni-loss causes the decrease of (Ni + Fe)/Ti ratio, and thus the increase of MTTs of the LPBF-fabricated NiTiFe alloys. It is also suggested that the size, temperature, and lifetime of the melt-pool increase with the increase of energy density, which results in increased Ni-depletion by evaporation, and thus decrease of (Ni + Fe)/Ti ratio. (c) gives the chemical composition of NiTiFe0.3 matrix, as characterised by SEM-EDS point analysis, with the change of scanning speed. It is clear that (Ni + Fe)/Ti ratio decreases monotonously with the decrease of scanning speed. Therefore, with a fixed Fe addition, Ni-loss caused by the preferential evaporation is the main reason for the decrease of (Ni + Fe)/Ti ratio. As a result, MTTs increase with the increase of laser energy density (e.g. increase of laser power, decrease of scanning speed).
Besides the Ni-depletion, the addition of Fe also increases the (Ni + Fe)/Ti ratio. As shown in (d), the Ni + Fe content gradually increases with the addition of Fe. The (Ni + Fe)/Ti ratio increases from 1.008 to 1.013 with the addition of Fe from 0 to 0.5 at.%, thus leading to the decrease of MTTs (). The dissolution of Fe into the NiTi matrix causes severe lattice distortion, which largely suppresses the martensitic transformation. As shown in , no obvious transformation peak is detected by DSC in the NiTiFe2 alloy. Combined with Fe addition and optimisation of process parameters, a large process window with Af temperature below room temperature could be obtained in the NiTiFe0.3 and NiTiFe0.5 alloys, thus achieving room temperature superelasticity ().
5. Conclusions
In this work, NiTiFex alloys (x = 0, 0.3, 0.5 and 2.0 at.%) are fabricated by L-PBF of pre-alloyed NiTi and elemental Fe powders. The influence of Fe addition and L-PBF process parameters on the densification behaviour, microstructure, phase transformation behaviour and mechanical/functional properties is studied. The results suggest that L-PBF: (i) could serve as a metallurgical method to in-situ synthesise ternary NiTiFe alloys; (ii) provides a feasible approach to tailoring the transformation behaviour and functional properties of NiTiFe alloys. The following results could be summarised:
A wide window of process parameters exists to fabricate dense NiTiFex alloys with low Fe addition (0.3 and 0.5 at.%). The alloy with high Fe addition (2.0 at.%) shows severe solidification cracking and delamination. The thermodynamic calculation suggests a strong composition dependency of cracking susceptibility.
Fe is mainly dissolved in the NiTi matrix since no Fe-rich intermetallic phase is detected. The addition of Fe causes the lattice distortion of NiTi matrix, leading to the decrease of martensite transformation temperatures and the appearance of the R-phase. The Ti-rich particles (Ti4Ni2Ox) are detected in all NiTiFex alloy, and an increase in the size of Ti4Ni2Ox particles with the increase of Fe addition is observed.
The martensite transformation temperatures of the L-PBF fabricated NiTiFex (x = 0, 0.3, 0.5at.%) alloy change monotonously with the individual change of scanning speed or laser power, providing a feasible approach to tailoring the phase transformation temperatures. Fe content can be used as an additional parameter controlling the transformation temperature. The sensitivity of the transformation temperature to Fe content is ca. 10 K per 0.1 at.% Fe.
The NiTiFe0.3 and NiTiFe0.5 alloys show good ductility with total strain of 13.6% and 9.2%, respectively. The ductility of NiTiFex alloys is deteriorated with Fe content, mainly due to the presence of larger Ti4Ni2Oxparticles. Superelasticity at RT is successfully achieved by adding Fe and optimisation of L-PBF process parameters.
Disclosure statement
No potential conflict of interest was reported by the author(s).
Data availability statement
The data that support the findings of this study are available from the corresponding author upon reasonable request.
Additional information
Funding
References
- Andersson, J.-O., T. Helander, L. Hoglund, P. Shi, and B. Sundman. 2002. “Thermo-Calc & DICTRA, Computational Tools for Materials Science.” Calphad 26: 273–312. doi:10.1016/S0364-5916(02)00037-8.
- Baghbaderani, K. S., M. Nematollahi, P. Bayatimalayeri, H. Dabbaghi, A. Jahadakbarand, and M. Elahinia. 2020. “Mechanical Evaluation Of Selective Laser Melted Ni-Rich Niti: Compression, Tension, And Torsion.” ArXiv 15659, doi:10.48550/arXiv.2006.15659.
- Bandyopadhyay, A., Y. Zhang, and B. Onuike. 2022. “Additive Manufacturing of Bimetallic Structures.” Virtual and Physical Prototyping 17: 256–294. doi:10.1080/17452759.2022.2040738.
- Barik, L., and S. K. Samal. 2022. “NiTi-based Coupling Devices.” In Nickel-Titanium Smart Hybrid Materials, edited by S. Thomas, A. Behera, and T. A. Nguyen, 215–243. Amsterdam: Elsevier.
- Biesiekierski, A., J. Wang, M. A.-H. Gepreel, and C. Wen. 2012. “A new Look at Biomedical Ti-Based Shape Memory Alloys.” Acta Biomaterialia 8: 1661–1669. doi:10.1016/j.actbio.2012.01.018.
- Bormann, T., G. Schulz, H. Deyhle, F. Beckmann, M. de Wild, J. Kuffer, C. Munch, W. Hoffmann, and B. Muller. 2014. “Combining Micro Computed Tomography and Three-Dimensional Registration to Evaluate Local Strains in Shape Memory Scaffolds.” Acta Biomaterialia 10: 1024–1034. doi:10.1016/j.actbio.2013.11.007.
- Bouabbou, A., and S. Vaudreuil. 2022. “Understanding Laser-Metal Interaction in Selective Laser Melting Additive Manufacturing Through Numerical Modelling and Simulation: A Review.” Virtual and Physical Prototyping 17: 543–562. doi:10.1080/17452759.2022.2052488.
- Chen, X., X. Peng, B. Chen, J. Han, Z. Zeng, and N. Hu. 2015. “Experimental Investigation on Transformation, Reorientation and Plasticity of Ni47Ti44Nb9SMA Under Biaxial Thermal–Mechanical Loading.” Smart Materials and Structures 24: 075025. doi:10.1088/0964-1726/24/7/075025.
- Chen, Y., A. Li, Z. Ma, T. Wang, Y. Liu, K. Yu, F. Yang, et al. 2021. “Step-wise R Phase Transformation Rendering High-Stability two-way Shape Memory Effect of a NiTiFe-Nb Nanowire Composite.” Acta Materialia 219: 117258. doi:10.1016/j.actamat.2021.117258.
- DebRoy, T., H. L. Wei, J. S. Zuback, T. Mukherjee, J. W. Elmer, J. O. Milewski, A. M. Beese, A. De Wilson-Heid, and W. Zhang. 2018. “Additive Manufacturing of Metallic Components – Process, Structure and Properties.” Progress in Materials Science 92: 112–224. doi:10.1016/j.pmatsci.2017.10.001
- Deng, J., C. Chen, X. Liu, Y. Li, K. Zhou, and S. Guo. 2021. “A High-Strength Heat-Resistant Al−5.7Ni Eutectic Alloy with Spherical Al3Ni Nano-Particles by Selective Laser Melting.” Scripta Materialia 203: 114034. doi:10.1016/j.scriptamat.2021.114034.
- Elahinia, M., N. S. Moghaddam, M. T. Andani, A. Amerinatanzi, B. A. Bimber, and R. F. Hamilton. 2016. “Fabrication of NiTi through Additive Manufacturing: A Review.” Progress in Materials 83: 630–663. doi: 10.1016/j.pmatsci.2016.08.001.
- Elahinia, M., N. S. Moghaddam, A. Amerinatanzi, S. Saedi, G. P. Toker, H. Karaca, G. S. Bigelow, and O. Benafan. 2018. “Additive Manufacturing of NiTiHf High Temperature Shape Memory Alloy.” Scripta Materialia 145: 90–94. doi:10.1016/j.scriptamat.2017.10.016.
- Elahinia, M. H., M. Hashemi, M. Tabesh, and S. B. Bhaduri. 2012. “Manufacturing and Processing of NiTi Implants: A Review.” Progress in Materials Science 57: 911–946. doi:10.1016/j.pmatsci.2011.11.001.
- Fan, Q. C., Y. Zhang, Y. H. Zhang, Y. Y. Wang, E. H. Yan, S. K. Huang, and Y. H. Wen. 2019. “Influence of Ni/Ti Ratio and Nb Addition on Martensite Transformation Behavior of NiTiNb Alloys.” Journal of Alloys and Compounds 790: 1167–1176. doi:10.1016/j.jallcom.2019.02.330.
- Frenzel, J., E. P. George, A. Dlouhy, C. Somsen, M. F.-X. Wagner, and G. Eggeler. 2010. “Influence of Ni on Martensitic Phase Transformations in NiTi Shape Memory Alloys.” Acta Materialia 58: 3444–3458. doi:10.1016/j.actamat.2010.02.019.
- Frenzel, J., A. Wieczorek, I. Opahle, B. Maaß, R. Drautz, and G. Eggeler. 2015. “On the Effect of Alloy Composition on Martensite Start Temperatures and Latent Heats in Ni–Ti-Based Shape Memory Alloys.” Acta Materialia 90: 213–231. doi:10.1016/j.actamat.2015.02.029.
- Frenzel, J., Z. Zhang, C. Somsen, K. Neuking, and G. Eggeler. 2007. “Influence of Carbon on Martensitic Phase Transformations in NiTi Shape Memory Alloys.” Acta Materialia 55: 1331–1341. doi:10.1016/j.actamat.2006.10.006.
- Gao, T., S. Zhang, G. Liu, Q. Sun, J. Liu, Q. Sun, J. Sun, Z. Wang, X. Liu, and X. Wang. 2021. “A High Strength AlSi10Mg Alloy Fabricated by Laser Powder bed Fusion with Addition of Al–Ti–C–B Master Alloy Powders.” Materialia 16: 101103.
- Gowri, S., and F. H. Samuel. 1992. “Effect of Cooling Rate on the Solidification Behavior of Al-7 pct Si-SiCp Matal-Matrix Composites.” Metallurgical Transactions A 23: 3369–3376. doi:10.1007/BF02663446.
- Gu, D., X. Shi, R. Poprawe, D. L. Bourell, R. Setchi, and J. Zhu. 2021. “Material-structure-performance Integrated Laser-Metal Additive Manufacturing.” Science 372: 1487. doi:10.1126/science.abg1487.
- Haberland, C., M. Elahinia, J. M. Walker, H. Meier, and J. Frenzel. 2014. “On the Development of High Quality NiTi Shape Memory and Pseudoelastic Parts by Additive Manufacturing.” Smart Materials and Structures 23: 104002. doi:10.1088/0964-1726/23/10/104002.
- Hassan, M. R., M. Mehrpouya, and S. Dawood. 2014. “Review of the Machining Difficulties of Nickel-Titanium Based Shape Memory Alloys.” Applied Mechanics and Materials 564: 533–537. doi:10.4028/www.scientific.net/AMM.564.533.
- Hayrettin, C., O. Karakoc, I. Karaman, J. H. Mabe, R. Santamarta, and J. Pons. 2019. “Two way Shape Memory Effect in NiTiHf High Temperature Shape Memory Alloy Tubes.” Acta Materialia 163: 1–13. doi:10.1016/j.actamat.2018.09.058.
- He, X. M., L. J. Rong, D. S. Yan, and Y. Y. Li. 2005. “Temperature Memory Effect of Ni47Ti44Nb9 Wide Hysteresis Shape Memory Alloy.” Scripta Materialia 53: 1411–1415. doi:10.1016/j.scriptamat.2005.08.022.
- Huang, S., P. Kumar, W. Y. Yeong, R. L. Narayan, and U. Ramamurty. 2022. “Fracture Behavior of Laser Powder bed Fusion Fabricated Ti41Nb via in-Situ Alloying.” Acta Materialia 225: 117593. doi:10.1016/j.actamat.2021.117593.
- Huang, S., R. L. Narayan, J. H. K. Tan, S. L. Sing, and W. Y. Yeong. 2021. “Resolving the Porosity-Unmelted Inclusion Dilemma During in-Situ Alloying of Ti34Nb via Laser Powder bed Fusion.” Acta Materialia 204: 116522. doi:10.1016/j.actamat.2020.116522.
- Hyer, H., L. Zhou, A. Mehta, S. Park, T. Huynh, S. Song, Y. Bai, K. Cho, B. McWilliams, and Y. Sohn. 2021. “Composition-dependent Solidification Cracking of Aluminum-Silicon Alloys During Laser Powder bed Fusion.” Acta Materialia 208: 116698.
- Jahadakbar, A., M. Nematollahi, K. Safaei, P. Bayati, G. Giri, H. Dabbaghi, D. Dean, and M. Elahinia. 2020. “Design, Modeling, Additive Manufacturing, and Polishing of Stiffness-Modulated Porous Nitinol Bone Fixation Plates Followed by Thermomechanical and Composition Analysis.” Metals 10: 151. doi:10.3390/met10010151.
- Khairallah, S. A., A. T. Anderson, A. Rubenchik, and W. E. King. 2016. “Laser Powder-bed Fusion Additive Manufacturing: Physics of Complex Melt Flow and Formation Mechanisms of Pores, Spatter, and Denudation Zones.” Acta Materialia 108: 36–45. doi:10.1016/j.actamat.2016.02.014.
- Kim, S. H., H. Lee, S. M. Yeon, C. Aranas Jr, K. Choi, J. Yoon, S. W. Yang, and H. Lee. 2021. “Selective Compositional Range Exclusion via Directed Energy Deposition to Produce a Defect-Free Inconel 718/SS 316L Functionally Graded Material.” Additive Manufacturing 47: 102288. doi:10.1016/j.addma.2021.102288.
- Kim, S. H., S.-M. Yeon, J. H. Lee, Y. W. Kim, H. Lee, J. Park, N.-K. Lee, et al. 2020. “Additive Manufacturing of a Shift Block via Laser Powder bed Fusion: The Simultaneous Utilisation of Optimised Topology and a Lattice Structure.” Virtual and Physical Prototyping 15: 460–480. doi:10.1080/17452759.2020.1818917.
- Kim, Y.-K., M.-C. Kim, and K.-A. Lee. 2022. “1.45 GPa Ultrastrong Cryogenic Strength with Superior Impact Toughness in the in-Situ Nano Oxide Reinforced CrMnFeCoNi High-Entropy Alloy Matrix Nanocomposite Manufactured by Laser Powder bed Fusion.” Journal of Materials Science & Technology 97: 10–19. doi:10.1016/j.jmst.2021.04.030.
- Kou, S. 2015a. “A Criterion for Cracking During Solidification.” Acta Materialia 88: 366–374. doi:10.1016/j.actamat.2015.01.034.
- Kou, S. 2015b. “A Simple Index for Predicting the Susceptibility of Solidification Cracking.” Welding Journal 94: 374–388.
- Krishnan, V. B., R. M. Manjeri, B. Clausen, D. W. Brown, and R. Vaidyanathan. 2008. “Analysis of Neutron Diffraction Spectra Acquired in Situ During Mechanical Loading of Shape Memory NiTiFe at low Temperatures.” Materials Science and Engineering A 481-482: 3–10. doi:10.1016/j.msea.2006.11.176
- Li, G., S. D. Jadhav, A. Martín, M. L. Montero-Sistiaga, J. Soete, M. S. Sebastian, C. M. Cepeda-Jiménez, and K. Vanmeensel. 2020. “Investigation of Solidification and Precipitation Behavior of Si-Modified 7075 Aluminum Alloy Fabricated by Laser-Based Powder bed Fusion.” Metallurgical and Materials Transactions A 52: 194–210. doi:10.1007/s11661-020-06073-9.
- Li, H. F., F. L. Nie, Y. F. Zheng, Y. Cheng, S. C. Wei, and R. Z. Valiev. 2019. “Nanocrystalline Ti49.2Ni50.8 Shape Memory Alloy as Orthopaedic Implant Material with Better Performance.” Journal of Materials Science & Technology 35: 2156–2162. doi:10.1016/j.jmst.2019.04.026.
- Li, S., H. Hassanin, M. M. Attallah, N. J. Adkins, and K. Essa. 2016. “The Development of TiNi-Based Negative Poisson's Ratio Structure Using Selective Laser Melting.” Acta Materialia 105: 75–83. doi:10.1016/j.actamat.2015.12.017.
- Liu, J., and S. Kou. 2016. “Crack Susceptibility of Binary Aluminum Alloys During Solidification.” Acta Materialia 110: 84–94. doi:10.1016/j.actamat.2016.03.030.
- Liu, Y., J. I. Kim, and S. Miyazaki. 2004. “Thermodynamic Analysis of Ageing-Induced Multiple-Stage Transformation Behaviour of NiTi.” Philosophical Magazine 84: 2083–2102. doi:10.1080/14786430410001678262.
- Lu, H. Z., T. Chen, L. H. Liu, H. Wang, X. Luo, C. H. Song, Z. Wang, and C. Yang. 2022a. “Constructing Function Domains in NiTi Shape Memory Alloys by Additive Manufacturing.” Virtual and Physical Prototyping 17: 563–581. doi:10.1080/17452759.2022.2053821.
- Lu, H. Z., L. H. Liu, C. Yang, X. Luo, C. H. Song, Z. Wang, J. Wang, et al. 2022b. “Simultaneous Enhancement of Mechanical and Shape Memory Properties by Heat-Treatment Homogenization of Ti2Ni Precipitates in TiNi Shape Memory Alloy Fabricated by Selective Laser Melting.” Journal of Materials Science & Technology 101: 205–216. doi:10.1016/j.jmst.2021.06.019.
- Lu, H. Z., H. W. Ma, W. S. Cai, X. Luo, Z. Wang, C. H. Song, S. Yin, and C. Yang. 2021. “Stable Tensile Recovery Strain Induced by a Ni4Ti3 Nanoprecipitate in a Ni50.4Ti49.6 Shape Memory Alloy Fabricated via Selective Laser Melting.” Acta Materialia 219: 117261. doi:10.1016/j.actamat.2021.117261.
- Ma, J., I. Karaman, and R. D. Noebe. 2013. “High Temperature Shape Memory Alloys.” International Materials Reviews 55: 257–315. doi:10.1179/095066010X12646898728363
- Martin, J. H., B. D. Yahata, J. M. Hundley, J. A. Mayer, T. A. Schaedler, and T. M. Pollock. 2017. “3D Printing of High-Strength Aluminium Alloys.” Nature 549: 365–369. doi:10.1038/nature23894.
- Martinez, R., I. Todd, and K. Mumtaz. 2019. “In Situ Alloying of Elemental Al-Cu12 Feedstock Using Selective Laser Melting.” Virtual and Physical Prototyping 14: 242–252. doi:10.1080/17452759.2019.1584402.
- Miyazaki, S. 2017. “My Experience with Ti-Ni-Based and Ti-Based Shape Memory Alloys.” Shape Memory and Superelasticity 3: 279–314. doi:10.1007/s40830-017-0122-3.
- Miyazaki, S., S. Kimura, and K. Otsuka. 1988. “Shape-memory Effect and Pseudoelasticity Associated with the R-Phase Transition in Ti-50·5 at.% Ni Single Crystals.” Philosophical Magazine A 57: 467–478. doi:10.1080/01418618808204680.
- Miyazaki, S., Y. Kohiyama, K. Otsuka, and T. W. Duerig. 1990. “Effects of Several Factors on the Ductility of the Ti-Ni Alloys.” Materials Science Forum 56-58: 765–770. doi:10.4028/www.scientific.net/MSF.56-58.765
- Nematollahi, M., S. E. Saghaian, K. Safaei, P. Bayati, P. Bassani, C. Biffi, A. Tuissi, H. Karaca, and M. Elahinia. 2021. “Building Orientation-Structure-Property in Laser Powder bed Fusion of NiTi Shape Memory Alloy.” Journal of Alloys and Compounds 873: 159791. doi:10.1016/j.jallcom.2021.159791.
- Oliveira, J. P., R. M. Miranda, and F. M. Braz Fernandes. 2017. “Welding and Joining of NiTi Shape Memory Alloys: A Review.” Progress in Materials Science 88: 412–466. doi:10.1016/j.pmatsci.2017.04.008.
- Otsuka, K., and X. Ren. 2005. “Physical Metallurgy of Ti–Ni-Based Shape Memory Alloys.” Progress in Materials Science 50: 511–678. doi:10.1016/j.pmatsci.2004.10.001.
- Ou, S., B. Peng, Y. Chen, and M. Tsai. 2018. “Manufacturing and Characterization of NiTi Alloy with Functional Properties by Selective Laser Melting.” Metals 8: 342. doi:10.3390/met8050342.
- Parvizi, S., S. M. Hashemi, F. Asgarinia, M. Nematollahi, and M. Elahinia. 2020. “Effective Parameters on the Final Properties of NiTi-Based Alloys Manufactured by Powder Metallurgy Methods: A Review.” Progress in Materials Science 117: 100739. doi:10.1016/j.pmatsci.2020.100739.
- Sampath, S., and T. A. Nguyen. 2022. “NiTi-based Ternary Shape-Memory Alloys.” In Nickel-Titanium Smart Hybrid Materials, edited by S. Thomas, A. Behera, and T. A. Nguyen, 123–137. Amsterdam: Elsevier.
- Shi, G., L. Li, Z. Yu, R. Liu, P. Sha, Z. Xu, Y. Guo, et al. 2022. “The Interaction Effect of Process Parameters on the Phase Transformation Behavior and Tensile Properties in Additive Manufacturing of Ni-Rich NiTi Alloy.” Journal of Manufacturing Processes 77: 539–550. doi:10.1016/j.jmapro.2022.03.027.
- Shi, X., H. Yang, H. Mao, Y. Li, J. Zhang, and X. Yin. 2018. “Effect of Plastic Deformation of V Nanowires on the Transformation Characteristics of NiTiV Alloys.” Materials Science and Engineering A 735: 162–165. doi:10.1016/j.msea.2018.08.041.
- Shu, X. Y., S. Q. Lu, G. F. Li, J. W. Liu, and P. Peng. 2014. “Nb Solution Influencing on Phase Transformation Temperature of Ni47Ti44Nb9 Alloy.” Journal of Alloys and Compounds 609: 156–161. doi:10.1016/j.jallcom.2014.04.165.
- Sing, S. L., S. Huang, G. D. Goh, G. L. Goh, C. F. Tey, J. H. K. Tan, and W. Y. Yeong. 2021. “Emerging Metallic Systems for Additive Manufacturing: In-Situ Alloying and Multi-Metal Processing in Laser Powder bed Fusion.” Progress in Materials Science 119: 100795. doi:10.1016/j.pmatsci.2021.100795.
- Sing, S. L., F. E. Wiria, and W. Y. Yeong. 2018. “Selective Laser Melting of Titanium Alloy with 50 wt% Tantalum: Effect of Laser Process Parameters on Part Quality.” International Journal of Refractory Metals and Hard Materials 77: 120–127. doi:10.1016/j.ijrmhm.2018.08.006.
- Sing, S. L., and W. Y. Yeong. 2020. “Laser Powder bed Fusion for Metal Additive Manufacturing: Perspectives on Recent Developments.” Virtual and Physical Prototyping 15: 359–370. doi:10.1080/17452759.2020.1779999.
- Sui, S., Y. Chew, F. Weng, C. Tan, Z. Du, and G. Bi. 2021. “Achieving Grain Refinement and Ultrahigh Yield Strength in Laser Aided Additive Manufacturing of Ti−6Al−4V Alloy by Trace Ni Addition.” Virtual and Physical Prototyping 16: 417–427. doi:10.1080/17452759.2021.1949091
- Tan, Q., Y. Liu, Z. Fan, J. Zhang, Y. Yin, and M.-X. Zhang. 2020. “Effect of Processing Parameters on the Densification of an Additively Manufactured 2024 Al Alloy.” Journal of Materials Science & Technology 58: 34–45. doi:10.1016/j.jmst.2020.03.070.
- Toker, G. P., M. Nematollahi, S. E. Saghaian, K. S. Baghbaderani, O. Benafan, M. Elahinia, and H. E. Karaca. 2020. “Shape Memory Behavior of NiTiHf Alloys Fabricated by Selective Laser Melting.” Scripta Materialia 178: 361–365. doi:10.1016/j.scriptamat.2019.11.056.
- Wang, X., S. Kustov, K. Li, D. Schryvers, B. Verlinden, and J. Van Humbeeck. 2015. “Effect of Nanoprecipitates on the Transformation Behavior and Functional Properties of a Ti–50.8at.% Ni Alloy with Micron-Sized Grains.” Acta Materialia 82: 224–233. doi:10.1016/j.actamat.2014.09.018.
- Wang, X., S. Kustov, and J. Van Humbeeck. 2018. “A Short Review on the Microstructure, Transformation Behavior and Functional Properties of NiTi Shape Memory Alloys Fabricated by Selective Laser Melting.” Materials 11: 1683. doi:10.3390/ma11091683.
- Wang, X., Z. Pu, Q. Yang, S. Huang, Z. Wang, S. Kustov, and J. Van Humbeeck. 2019. “Improved Functional Stability of a Coarse-Grained Ti-50.8 at.% Ni Shape Memory Alloy Achieved by Precipitation on Dislocation Networks.” Scripta Materialia 163: 57–61. doi:10.1016/j.scriptamat.2019.01.006.
- Wang, X., J. Yu, J. Liu, L. Chen, Q. Yang, H. Wei, J. Sun, et al. 2020. “Effect of Process Parameters on the Phase Transformation Behavior and Tensile Properties of NiTi Shape Memory Alloys Fabricated by Selective Laser Melting.” Additive Manufacturing 36: 101545. doi:10.1016/j.addma.2020.101545.
- Wang, Z., X. Lin, N. Kang, J. Chen, H. Tan, Z. Feng, Z. Qin, H. Yang, and W. Huang. 2021. “Laser Powder bed Fusion of High-Strength Sc/Zr-Modified Al–Mg Alloy: Phase Selection, Microstructural/Mechanical Heterogeneity, and Tensile Deformation Behavior.” Journal of Materials Science & Technology 95: 40–56. doi:10.1016/j.jmst.2021.03.069.
- Wei, C., and L. Li. 2021. “Recent Progress and Scientific Challenges in Multi-Material Additive Manufacturing via Laser-Based Powder bed Fusion.” Virtual and Physical Prototyping 16: 347–371. doi:10.1080/17452759.2021.1928520.
- Wei, H. L., J. Mazumder, and T. DebRoy. 2015. “Evolution of Solidification Texture During Additive Manufacturing.” Scientific Reports 5: 16446. doi:10.1038/srep16446.
- Weinert, K., and V. Petzoldt. 2004. “Machining of NiTi Based Shape Memory Alloys.” Materials Science and Engineering A 378: 180–184. doi:10.1016/j.msea.2003.10.344.
- Xiong, Z., Z. Li, Z. Sun, S. Hao, Y. Yang, M. Li, C. Song, P. Qiu, and L. Cui. 2019. “Selective Laser Melting of NiTi Alloy with Superior Tensile Property and Shape Memory Effect.” Journal of Materials Science & Technology 35: 2238–2242. doi:10.1016/j.jmst.2019.05.015.
- Xu, H., C. Jiang, S. Gong, and G. Feng. 2000. “Martensitic Transformation of the Ti50Ni48Fe2 Alloy Deformed at Different Temperatures.” Materials Science and Engineering A 281: 234–238. doi:10.1016/S0921-5093(99)00722-4.
- Xue, L., K. C. Atli, S. Picak, C. Zhang, B. Zhang, A. Elwany, R. Arroyave, and I. Karaman. 2021. “Controlling Martensitic Transformation Characteristics in Defect-Free NiTi Shape Memory Alloys Fabricated Using Laser Powder bed Fusion and a Process Optimization Framework.” Acta Materialia 215: 117017. doi:10.1016/j.actamat.2021.117017.
- Xue, L., K. C. Atli, C. Zhang, N. Hite, A. Srivastava, A. Leff, A. Wilson, et al. 2022. “Laser Powder bed Fusion of Defect-Free NiTi Shape Memory Alloy Parts with Superior Tensile Superelasticity.” Acta Materialia 229: 117781. doi:10.1016/j.actamat.2022.117781.
- Yang, Y., J. B. Zhan, Z. Z. Sun, H. L. Wang, J. X. Lin, Y. J. Liuand L, and C. Zhang. 2019. “Evolution of Functional Properties Realized by Increasing Laser Scanning Speed for the Selective Laser Melting Fabricated NiTi Alloy.” Journal of Alloys and Compounds 804: 220–229. doi:10.1016/j.jallcom.2019.06.340.
- Yao, L., S. Huang, U. Ramamurty, and Z. Xiao. 2021. “On the Formation of “Fish-Scale” Morphology with Curved Grain Interfacial Microstructures During Selective Laser Melting of Dissimilar Alloys.” Acta Materialia 220: 117331. doi:10.1016/j.actamat.2021.117331.
- Zhang, C. C., H. L. Wei, T. T. Liu, L. Y. Jiang, T. Yang, and W. H. Liao. 2021a. “Influences of Residual Stress and Micro-Deformation on Microstructures and Mechanical Properties for Ti-6.5Al-3.5Mo-1.5Zr-0.3Si Alloy Produced by Laser Powder bed Fusion.” Journal of Materials Science & Technology 75: 174–183. doi:10.1016/j.jmst.2020.08.061.
- Zhang, D., D. Qiu, M. A. Gibson, Y. Zheng, H. L. Fraser, D. H. StJohn, and M. A. Easton. 2019. “Additive Manufacturing of Ultrafine-Grained High-Strength Titanium Alloys.” Nature 576: 91–95. doi:10.1038/s41586-019-1783-1.
- Zhang, Q., S. Hao, Y. Liu, Z. Xiong, W. Guo, Y. Yang, Y. Ren, L. Cui, L. Ren, and Z. Zhang. 2020. “The Microstructure of a Selective Laser Melting (SLM)-Fabricated NiTi Shape Memory Alloy with Superior Tensile Property and Shape Memory Recoverability.” Applied Materials Today 19: 100547. doi:10.1016/j.apmt.2019.100547.
- Zhang, T., Z. Huang, T. Yang, H. Kong, J. Luan, A. Wang, D. Wang, W. Kuo, Y. Wang, and C. Liu. 2021b. “In Situ Design of Advanced Titanium Alloy with Concentration Modulations by Additive Manufacturing.” Science 374: 478–482. doi:10.1126/science.abj3770.
- Zhang, Y., S. Jiang, M. Tang, B. Yan, J. Yu, and C. Zhao. 2021c. “Mechanisms for Influence of Post-Deformation Annealing on Microstructure of NiTiFe Shape Memory Alloy Processed by Local Canning Compression.” Journal of Materials Processing Technology 291: 116998. doi:10.1016/j.jmatprotec.2020.116998.
- Zhang, Y., S. Jiang, X. Zhu, Y. Zhao, Y. Liang, and D. Sun. 2017. “Influence of Fe Addition on Phase Transformation Behavior of NiTi Shape Memory Alloy.” Transactions of Nonferrous Metals Society of China 27: 1580–1587. doi:10.1016/s1003-6326(17)60179-1.
- Zhao, C., N. D. Parab, X. Li, K. Fezzaa, W. Tan, A. D. Rollett, and T. Sun. 2020. “Critical Instability at Moving Keyhole tip Generates Porosity in Laser Melting.” Science 370: 1080–1086. doi:10.1126/science.abd1587.
- Zheng, Y. F., B. B. Zhang, B. L. Wang, Y. B. Wang, L. Li, Q. B. Yang, and L. S. Cui. 2011. “Introduction of Antibacterial Function Into Biomedical TiNi Shape Memory Alloy by the Addition of Element Ag.” Acta Biomaterialia 7: 2758–2767. doi:10.1016/j.actbio.2011.02.010.