
 ?Mathematical formulae have been encoded as MathML and are displayed in this HTML version using MathJax in order to improve their display. Uncheck the box to turn MathJax off. This feature requires Javascript. Click on a formula to zoom.
ABSTRACT
Laser powder bed fusion (L-PBF) is one of the most widely used metal additive manufacturing technology for fabrication of functional and structural components. However, inconsistency in quality and reliability of L-PBF products is still a significant barrier preventing it from wider adoption. Machine learning (ML) of monitoring data offers a unique solution to effectively identify possible defects and predict the quality of L-PBF products. In this work, we introduce a semi-supervised ML approach to detect anomalies that occurred in L-PBF products. We train the ML model to classify surface appearances in the reference monitoring data. We then correlate the classified appearances to post-process characteristics, e.g. surface roughness, morphology, or tensile strength. We demonstrate that the established correlation enables the determination of key appearances indicative of the quality of the printed samples including anomaly-free, lack-of-fusion and overheated. We further validate our ML approach by performing prediction on test samples having various geometries.
1. Introduction
3D printing or additive manufacturing (AM) has become the key enabling factor in advanced manufacturing sector of Industry 4.0 technologies thanks to its numerous advantages such as minimal geometrical constraints in design, flexibility in customisation, and most of all, reduction of material wastage which is a crucial pillar in circular economy to sustainably develop society (Joshi and Sheikh Citation2015; Tofail et al. Citation2018; Liu et al. Citation2021). Laser powder bed fusion (L-PBF) is a metal AM technology that has tremendous potential in manufacturing functional and structural components in most industrial sectors (Ladani and Sadeghilaridjani Citation2021; Wang et al. Citation2022).
Lack of standardised methods to ensure consistency and reliability is widely recognised as the critical barrier that slowdowns the acceptance of L-PBF products into highly regulated industries (King et al. Citation2015). Generally, L-PBF processes involve a large (up to 50) number of process parameters (Oliveira, LaLonde, and Ma Citation2020), e.g. laser power, scanning speed, scanning strategy, layer thickness and gas flow rate. Internal defects of the products inevitably emerge with inadequate parameters. Even with optimal sets of process parameters, defects may occur due to geometrical complexity of printed parts, e.g. overhang structures, or thin walls. Once a defect is initiated from a layer, it may propagate to subsequent ones, either causing visible damages to the entire printed part or generating internal structural weaknesses only detectable by costly post-process detection methods. The lack of well-established quality control technologies is unacceptable in automobile, aerospace or biomedical, which are among industrial sectors known for having the most elaborate quality control protocols but having a leading role in driving development of the AM sector.
The discovery of structural weakness during quality check on the manufactured part is costly for the resources, money and time invested. Therefore, in-situ monitoring of the printing process to detect potential defects and make predictions of the product quality leads to a more efficient manufacturing process of L-PBF technology (Everton et al. Citation2016; McCann et al. Citation2021). Several in-process monitoring systems have been developed using various types of sensors, including optical sensors (zur Jacobsmühlen et al. Citation2015; Abdelrahman et al. Citation2017; zur Jacobsmühlen et al. Citation2017; Grasso et al. Citation2017; Lu et al. Citation2019; Zhang, Liu, and Shin Citation2019; Lu et al. Citation2020), thermal sensors (Lane et al. Citation2016; Raplee et al. Citation2017; Khanzadeh et al. Citation2018), acoustic sensors (Kouprianoff et al. Citation2017; Shevchik et al. Citation2018; Ye et al. Citation2018; Drissi-Daoudi et al. Citation2022) or X-ray (Leung et al. Citation2018) to acquire visual information, e.g. surface pattern, powder bed homogeneity, thermal information, e.g. temperature intensity, melt pool geometry, heat affected zone along the scan path or acoustic information of L-PBF processes. The acquired information has been routinely used to validate empirical or physics-based models targeting to detect defects or predict the overall quality of printed parts. The modelling approach relies on various simplifying assumptions to reduce the computational cost caused by entangled physical phenomena, large number of involving parameters and complex boundary conditions, thereby leading to simplified results incapable of indicating the actual quality of printed parts. Moreover, it is not trivial to correlate the acquired monitoring data with the hidden defective patterns as there is a huge volume of continuously generated data. Therefore, machine learning (ML) has been increasingly adopted in recent years to extract useful information from monitoring data for quality control of L-PBF products (Wang, Tan, et al. Citation2020; Sing et al. Citation2021).
Machine learning (ML) algorithms can be classified as supervised (with labelled training data) or unsupervised (with unlabelled training data) (Alloghani et al. Citation2020). Unsupervised ML algorithms, e.g. support vector regression (SVR) (Song et al. Citation2016; Grasso et al. Citation2017), support vector machine (SVM) (Aoyagi et al. Citation2019), self-organising maps (SOM) clustering (Khanzadeh et al. Citation2019) and k-means clustering (Scime and Beuth Citation2018a), have been extensively used for defect detection, defect classification and process parameter optimisation in L-PBF systems. Various supervised ML models have also been employed to predict printability and repeatability of L-PBF products (Scime and Beuth Citation2018b; Chen et al. Citation2020; Huang and Li Citation2021). The applications of supervised and unsupervised ML algorithms in various aspects of additive manufacturing are comprehensively reviewed by Wang, Sun, et al. (Citation2020); Goh, Sing, and Yeong (Citation2021) and Sing et al. (Citation2021). The reported studies utilising supervised or unsupervised approaches have demonstrated significant advancements in quality control of L-PBF processes. Nevertheless, there are still certain limitations in these approaches. On the one hand, there is a lack of transparency in predictive outputs of unsupervised ML models. This requires human intervention to validate prediction results. On the other hand, supervised ML models are costly and potentially inefficient as they require human experts to manually label features in the training datasets. Semi-supervised learning is an approach that falls between unsupervised and supervised learning. It combines a small amount of labelled data with a large amount of unlabelled training data. Semi-supervised learning has not been widely utilised for quality control of L-PBF processes (Okaro et al. Citation2019; Pandiyan et al. Citation2021) despite their flexibility in implementation.
In this work, we introduce a semi-supervised ML approach with minimal effort in labelling training datasets to detect anomalies occurring during the printing process and predict the quality of L-PBF printed parts. We first train the ML model using layer-wise images of reference samples printed with varying process parameters to classify characteristic appearances of the reference samples at the pixel level by performing semantic segmentation. We then correlate the classified appearances with post-process characteristics, e.g. surface roughness, morphology, or tensile strength, to determine key appearances indicative of the quality of the printed samples including anomaly-free, lack-of-fusion and overheated. Finally, we demonstrate the capability of our ML model in defect detection and quality prediction of test samples having various geometries, e.g. cubes, bevel gears, overhanging and unsupported structures. The ML model offers a quantitative tool to evaluate the quality of test samples. Our approach using semi-supervised ML approach can be expanded to control the quality of products printed by other 3D printing processes and materials thanks to its simplicity in labelling training data.
2. Methodology
2.1. Experimental materials and designs
We carry out all printing experiments on a metal 3D printer (SLM 500-HL, SLM Solutions Group AG). The printer has a building chamber of and two fibre lasers having a maximum power of
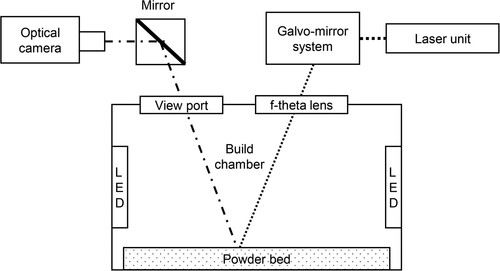
. The printed material is stainless steel 316L (SS316L) powders. In our experiment, we capture images of the powder bed using a monitoring system attached to the printing chamber as shown in . With this setup, layer-wise images of printed samples are captured through a viewport on top of the printing chamber by a digital single lens reflex camera (D850, Nikon) having pixel resolution of
pixels (Lu et al. Citation2019). For each layer, two images are captured: one after laser scanning, and the other one after powder recoating.
Figure 1. Schematic figure of experiment setup.
We perform an extensive experimental study as follows: in each print job, we print 10 reference samples using 10 distinct parameter settings. Here, we note that the printing parameter setting including the laser energy and scanning velocity can be set separately for each sample. The reference samples are designed as circular cylinders having a diameter of and height of
We then repeat the print job seven times keeping the same arrangement for printing parameter settings to obtain sufficient data for ML training. After excluding bad images resulted from technical difficulties, we obtain a total of
layer-wise images of reference samples from the repeated print jobs. In , we show the arrangement of these reference samples within the region of interest of the experiment setup.
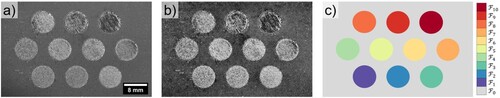
Figure 2. (a) Representative raw image of reference samples. (b) Processed image. (c) Corresponding ground truth pixel-labelled image.
In , we show the printing parameter settings and the corresponding labels used in our machine learning (ML) analysis. We vary the printing parameters by adjusting the laser power and the scanning velocity
. The laser energy density
of each printing parameter is defined as
(1)
(1) where h is the hatch spacing and t is the layer thickness. The hatch spacing and layer thickness are kept constant at
and
, respectively. The laser power
and scanning velocity
are varied in multiples of the baseline parameters recommended by the manufacturer: the baseline laser power is
and the baseline scanning velocity is
. We define the baseline energy density as
. In our experiment, we vary the energy density between
and
to induce the formation of various surface appearances, and subsequently identify the correlation between surface appearances with post-process characteristics, e.g. surface roughness, morphology and tensile strength.
Table 1. Printing parameter settings and corresponding appearance labels for printed reference samples.
2.2. Image processing
To reduce artefacts potentially causing bias in the ML model, we process raw layer-wise images using Matlab (R2021a, MathWorks) environment with the following steps (Lu et al. Citation2019). First, we define a region of interest (ROI) covering an area of around the 10 cylindrical reference samples and extract images within the ROI before downsizing them from
pixels to
pixels to reduce the computational cost for ML model training. Each pixel of the cropped images represents a physical area of
((a)).
Second, we perform background subtraction on the cropped images to enhance features of interest and remove any non-uniform illumination in the background. Here, we generate a background image for calibration by taking a uniformly coated powder bed before printing and then applying Gaussian blur to this image to remove small features from it. The background image is then subtracted from all layer-wise images using an absolute difference operation. To avoid over saturation in the resulting images, the brightness of the background image is slightly reduced. The resulting images are enhanced in contrast and freed of intensity variation caused by non-uniform illumination. Contrast-limited adaptive histogram equalisation is then applied to further enhance the contrast of the resulting images ((b)).
Finally, we create an image of ground truth pixel labels based on the designed areas and corresponding printing parameter settings of the reference samples. The pixel-labelled image consists of 10 classes of surface appearance ( to
) of reference samples correspondingly printed by 10 printing parameter settings (
to
) and one class of the area covered by unfused powder
. Here, since there is no variation in the geometries of the reference samples and printed areas are kept fixed across all layers, we expect that for the reference samples, each unique parameter setting, e.g.
for
from
to
, directly results in a distinct printed surface appearance, labelled as
().
(c) displays the ground truth pixel-labelled image used in our analysis. As the reference samples are all vertical circular cylinders, we only need one pixel-labelled image for the entire stack of images. This simplifies the labelling step in training supervised ML models.
We note that in a typical printing process, a part printed with the same parameter setting as a reference sample may have printed areas with significantly different appearances compared to those of the reference sample. This may result from the variation of either the printed part’s geometry, e.g. overhang or thin-walled structures, or other printing conditions, e.g. preheated temperature of the base plate or gas flow rate. As a result, a typical printing process using any of the preset printing parameter settings may result in a printed surface with appearance identified by the ML model as one consisting of multiple appearance classes.
2.3. Machine learning models
We implement ML models in Matlab environment (R2021a, MathWorks) to perform semantic segmentation on the training dataset obtained from the reference samples. Semantic segmentation allows identification and classification of various classes at pixel level by learning the context of the input images. Taking advantage of the tremendous growth of deep learning models in recent years, we compare three commonly used classification networks for semantic image segmentation, i.e. Vgg16 as the backbone of SegNet, ResNet50 as the backbone of DeepLab v3+ and Xception as the backbone of DeepLab v3+. We then utilise the network with the highest performance to perform testing on datasets obtained from samples different from the reference ones.
The size of input layers of the ML networks is modified to [350,550,1] to match the size of processed images. The number of class labels is adjusted to , which is the number of appearance classes in our training data. The class weights for the final pixel classification layer of each network are then rebalanced by the median frequency of each class label to avoid biasing the ML model toward the unfused powder class, which dominates the training dataset owning to its largest area in each input image.
The dataset of reference samples in our study comprises images obtained from multiple print jobs; half of the images are captured after laser scanning and the other half are captured after powder recoating. To train our ML models, we only use the images captured after laser scanning to obtain information on surface morphology of the reference samples. We use
of the images captured after laser scanning for training the ML models and the remaining
for performance testing.
Data augmentation is applied on the training dataset to enhance the robustness of the ML model. The training images are augmented with random reflection, random translation between pixels and
pixels, random rotation with the angle between
and
, and random scaling with scale factor varying from
to
. To optimise memory usage, augmented images are randomly created in Matlab during the training process without saving them to memory.
2.4. Microstructure characterisation and tensile testing
Microstructural characteristics of the reference samples are examined by a scanning electron microscope (JCM-6000, Jeol Ltd.). Surface roughness of the reference samples is measured using a surface profiler (SJ400, Mitutoyo). Subsize dogbone tensile coupons are printed with the same parameter settings as reference samples in the XYZ orientation according to the coordinate system specified by ISO/ASTM 52921:2016 standard. The dimensions of tensile samples are specified by ASTM E8/E8M-15a standard. Tensile tests are carried out in displacement control using a universal testing machine (10 kN, Instron 5569, Instron).
3. Results and discussion
3.1. Performance comparison between machine learning networks
Performances of three semantic segmentation network structures, i.e. Vgg16 as the backbone of SegNet, ResNet50 as the backbone of DeepLab v3+, and Xception as the backbone of DeepLab v3+, are tested on 86 images, or equivalently of the dataset captured after laser scanning of the reference samples. We evaluate the performance of the ML network structures using three performance scores typically used for semantic segmentation: global accuracy, average intersection over union
and average contour matching score for boundary F1
(Csurka et al. Citation2013). First, the global accuracy estimates the percentage of correctly classified pixels of all classes in all images of a dataset and is defined as
(2)
(2)
Second, the metric describes the intersection of different classes and is defined by the ratio of correctly classified pixels to the union of ground truth and predicted pixels in that class:
(3)
(3) where
and
, respectively, denote the ground truth and the predicted results. The
is the average
score of all classes in all images of the dataset.
Finally, the score measures how the boundary of each class matches the ground truth boundary. It is defined as the F1-measure of the precision (P) and recall (R) values calculated within a distance error tolerance, i.e.
of the length of the image diagonal (Csurka et al. Citation2013):
(4)
(4)
The is the average
score of all classes in all images of the dataset.
In , we show comparisons between the overall performances of the ML network structures on the testing dataset of reference samples. The DeepLab v3+ based network structures, with both backbones ResNet50 and Xception, outperform SegNet in all performance metrics. Here, we note that ResNet50 as the backbone of the network performs slightly better than Xception. In , we show representative predictions and the corresponding errors of the tested ML network structures. We observe that most errors of the SegNet based network structure occur at the boundaries of the samples, consistent with its low and
scores shown in . The outstanding performance of DeepLab v3 + network structure is due to its Atrous Convolution, which enhances the receptive field of convolutional layers (Tianhua, Siqun, and Junchuan Citation2018) and allows the model to capture crucial information surrounding each pixel, e.g. at the boundaries separating laser-scanned areas from the unfused powder areas. The resulting
and
scores of DeepLab v3 + based network structure are therefore noticeably higher than those by SegNet based network structure even though the global accuracies of all three network structures are comparably high
.
Figure 3. Performance scores of three ML network structures measured on the testing datasets of reference samples.
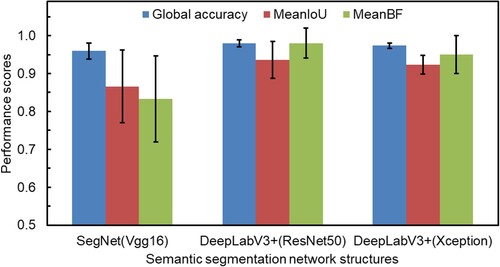
Figure 4. (a) Input image. (b–d) Representative predictions of three ML network structures on the testing dataset of reference samples. (e) Corresponding ground truth pixel-labelled image. (f–h) Comparison of prediction results with expected ground truth. The green and magenta highlight errors outside and inside of the laser-scanned areas, respectively.
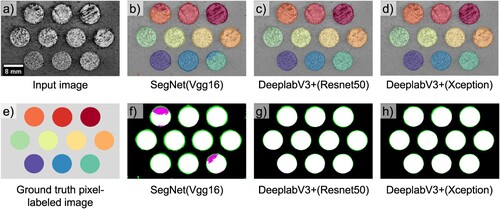
As the backbone of the DeepLab v3 + network, ResNet50 produces slightly better results than Xception even though the structure of Xception reportedly performed better in semantic segmentation tasks compared to VGG-Net or ResNet backbones (Zhang et al. Citation2020). This may be linked to Xception’s focus on training efficiency enhancement and the resulting cost of lowering the number of parameters for capturing image features compared to ResNet. As a result, we use DeepLab v3 + network structure with ResNet50 as the backbone for our ML model in subsequent analysis.
3.2. Microstructures and tensile properties
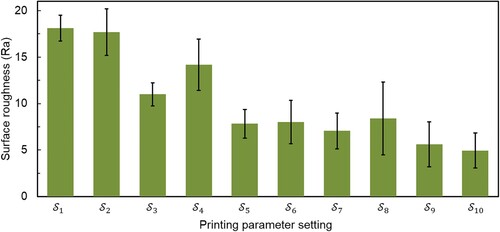
To identify the relations between appearances of printed surfaces and quality, we characterise surface morphology and tensile performance of samples printed with the same parameter settings as those of reference samples. In and , we show representative snapshots of the surface morphology and the corresponding surface roughness of several reference samples. We observe that the surface morphology of samples printed with low energy density, e.g. , is characterised by discontinuous melting tracks and lack of fusion of metal powders while those with moderate energy density, e.g.
and
, have smoother surface texture. For samples printed with the same energy density
, the one printed by parameter setting
has rougher surface and more discontinuous melting tracks than the one printed by parameter setting
This may result from instability of melt pool due to higher printing speed of parameter setting
. However, there is no significant variation in surface morphology and roughness caused by different printing speeds between samples printed with the same energy density in the range between
and
(). Further increasing energy density to
and
causes overheating and micro cracks ((g,h)), indicating significant residue stress in samples printed with parameter setting
and
. This observation strongly suggests that samples printed with parameter settings
,
and
tend to suffer from lack-of-fusion, while those printed with
and
are likely to be overheated during printing.
Figure 5. Surface morphology of reference samples printed with varying printing parameter settings.
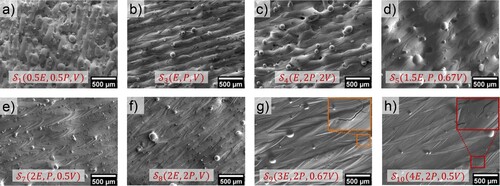
Figure 6. Surface roughness of reference samples printed with varying printing parameter settings.
In (a), we present the yield strength and the ultimate strength of tensile coupons printed with the same parameter settings as reference samples. First, we note that the sample printed with the baseline parameter setting has high yield strength and tensile strength, consistent with the manufacturer’s recommendation. Other samples having comparable tensile performances are those printed by
,
. This group of samples has yield strengths higher than
and tensile strengths higher than
, which respectively are minimum requirements specified by ASTM F3184-16 standard. The samples printed by
and
have poor tensile performance due to lack of fusion of metal powders, consistent with their observed surface morphology (). Those printed with the highest energy densities, i.e.
and
, have slightly lower tensile strengths than those of highest performance, e.g.
,
,
, due to the residue stress.
Figure 7. Tensile performance of coupons printed with the same parameter settings as reference samples.
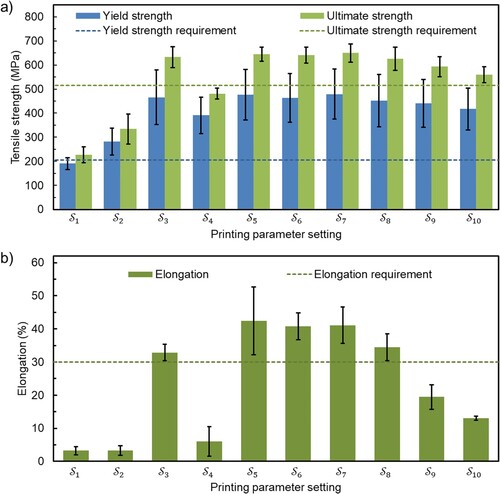
In (b), we show elongation at break of tensile coupons printed with the same parameter settings as reference samples. The presence of residue stress significantly reduces the ductility of samples printed with parameter settings and
. However, their ductility is still higher than that of samples printed with energy density of
, a result consistent with the discontinuous melting tracks and incomplete powder melting shown in . For samples printed with parameter setting
, the reduced yield strength, ultimate strength and ductility may result from instability of melt pool caused by high printing speed.
The above results demonstrate that (1) different printing parameter settings could result in similar surface appearances and mechanical performances and (2) there is a strong correlation between possible defects and surface appearances observed during printing. In particular, surface appearances of samples printed by parameter settings ,
,
are associated with lack of fusion and poor tensile strength, while those by
and
are associated with overheated printing and reduced ductility due to residue stress. Samples printed by parameter settings
,
,
,
have smooth surface texture and tensile strength meeting minimum requirements specified by ASTM F3184-16.
As a result, in subsequent predictive analysis using ML, we adopt the following labels to summarise the relations between surface appearances and possible defects: areas predicted as are labelled lack-of-fusion; areas predicted as
,
are labelled overheated, and areas predicted as
,
are labelled anomaly-free.
3.3. Evaluation of trained machine learning network
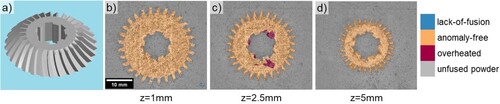
We evaluate the ML model’s robustness using separate datasets obtained from samples of wider variety of shapes, i.e. cubes and spiral bevel gear. In and , we show representative predictions of the ML model on cubes printed with varying printing parameter settings and representative predictions at several built heights of a spiral bevel gear printed with the parameter setting . We note that our ML model differentiates unfused powder areas from laser-scanned areas with remarkably high accuracy, despite geometrical differences between reference samples and the tested samples.
Figure 8. Representative predictions of the ML model on cubes printed with varying printing parameter settings.
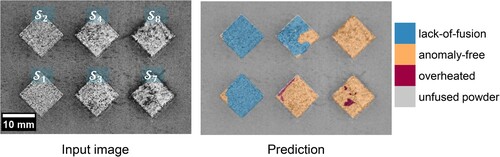
Figure 9. Representative predictions at different built heights of a spiral bevel gear.
We recall that our ML model is incorporated with data augmentation (see Section 2.3), which helps to prevent overfitting ML models. To confirm the effectiveness of data augmentation in preventing overfitting, we train the ML model without data augmentation and subsequently observe that it performs well on the testing dataset obtained from the reference samples but poorly on those obtained from the printing of the cubes and the spiral bevel gear. In particular, the ML model without data augmentation is not capable of distinguishing unfused powder areas from laser-scanned areas for printed samples having different shapes from that of reference samples.
To further quantify our ML model’s ability in differentiating the unfused powder and the laser-scanned areas, we show in the global accuracy, and
scores for unfused powder areas and laser-scanned areas of both the cubes and the bevel gear. Here we note that the areas scanned with laser include those indicated by either lack-of-fusion, anomaly-free, or overheated. As a result, all classes indicating lack-of-fusion, anomaly-free and overheated are merged into one indicating laser-scanned areas to calculate the scores for the areas scanned with laser and the areas of unfused powder.
Figure 10. Performance scores, i.e. global accuracy, MeanIoU and MeanBF, of the selected ML model for cubes and bevel gear.
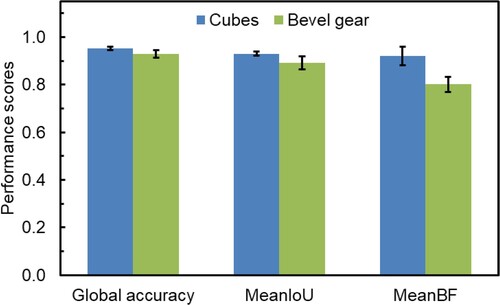
We observe that the and
scores are lower for the bevel gear compared to those for the cubes as the ML model does not perform well for thin features such as teeth on top of the spiral bevel gear ((d)). Nevertheless, the
and
scores for both cases are higher than
, suggesting that our ML model is well capable of differentiating the laser-scanned areas and unfused areas.
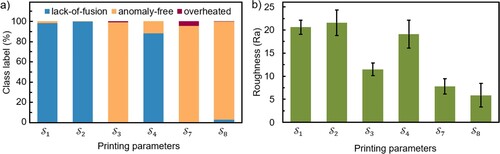
To evaluate the predictive capability of the ML model, we show in (a) the distribution of class labels identified by the ML model over the entire image stack obtained from cubes printed with varying printing parameter settings, and in (b) the corresponding surface roughness of the printed cubes. For those printed with the parameter settings ,
and
, high percentages of the laser-scanned areas are predicted as lack-of-fusion, consistent with their correspondingly high surface roughness values. This is also consistent with the known correlation between low laser energy density and lack-of-fusion between printed layers. Likewise, for those printed with the parameter settings
,
and
, more than
of the laser-scanned areas are predicted as anomaly-free, consistent with their low surface roughness, i.e.
. We note that predictions made for cubes printed by a single printing parameter setting are not uniform throughout the entire image stack, e.g. a noticeable portion of the laser-scanned areas of cubes printed with
is predicted as anomaly-free. These inhomogeneous predictions may originate either from variation in surface appearance caused by uncontrolled fluctuation of printing conditions, e.g. unstable air flow, or change in thermal distribution of the test samples. Nonetheless, further research incorporating thermal history and information from previously printed layers using Long Short-Term Memory (LSTM) (Hochreiter and Schmidhuber Citation1997) module may greatly enhance capability of this ML model toward prediction of defects based on surface.
Figure 11. (a) Distribution of class labels identified by the ML model for cubes; each column corresponds to the entire image stack of a distinct printing parameter setting. (b) Surface roughness of cubes printed with varying printing parameter settings.
3.4. Anomaly detection
To demonstrate the anomaly detection capability of our ML model, we perform predictions on images captured after laser scanning and after powder recoating of a sample printed using parameter setting with overhanging structures ((a)), which typically cause super-elevation, i.e. an anomaly potentially endangering structural integrity of L-PBF products. We note that super-elevation typically occurs due to overheating of sintered powder, causing elevation of the overheated areas from the surrounding. The elevated sintered areas typically are not covered by powder in the subsequent powder recoating step. As a result, an area suffered from super-elevation is detected if it is identified as laser-scanned in the image captured after powder recoating.
Figure 12. (a) Geometry of sample with overhanging structures. (b) Images and corresponding analysis for build height z = 7.5 mm. From left to right: image captured after laser scanning; image after powder coating; anomaly predictions after laser scanning; anomaly prediction after powder coating. (c) Images and anomaly predictions for build height z = 10 mm. Arrow indicates powder recoating direction.
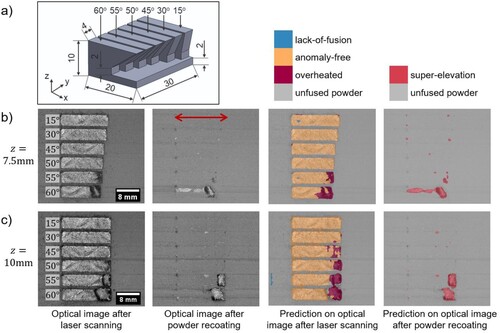
In (b), we show images captured after laser scanning and after powder coating for a layer at build height and corresponding anomalies predictions by our ML model. For structures with low overhanging angles (less than
), most laser-scanned areas are predicted as anomaly-free by the ML model. As the overhanging angle increases, more and more laser-scanned areas are predicted as overheated. This observation is consistent with the thermal characteristics of overhanging structures in L-PBF: structures with high overhanging angles have more unfused powder underneath, hence are prone to local overheating and subsequently cause elevation of the built part due to low thermal conductivity of unfused powder. In the subsequent stage, i.e. after powder recoating, the areas predicted as laser-scanned are identified as those super-elevation.
We highlight that the areas identified as overheated after laser scanning are not always the same as those identified as super-elevation in the subsequent after powder recoating stage, as demonstrated in (c) for the overhanging structures with angles and
at build height
. This implies that overheating does not always cause super-elevation. Nevertheless, close proximity of overheated and super-elevation areas observed in our experiment strongly suggest that surface appearance can be used as an early warning tool for possible defects such as super-elevation.
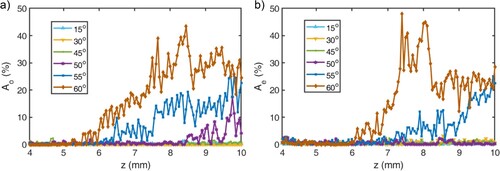
To quantitatively evaluate overheating and super-elevation in overhanging structures, we calculate the normalised overheated area and super-elevation area
in each layer using the predictions of ML model and the designed laser-scanned areas of overhanging structures. In , we show the dependences of
and
on build height
for overhanging structures of angles from
to
. We observe a strong correlation between
and
for large overhanging angles,
and
. For the structure having overhanging angle of
, super-elevation is absent, while overheating effect is detectable at top layers, i.e. for build height larger than
, indicating that this is the maximum overhanging angle possible for printing without super-elevation using setting
.
Figure 13. (a) Normalised overheated area Ao vs. build height z. (b) Normalised super-elevation area Ae vs z for overhanging structures of different angles. Both Ao and Ae are detected by the ML model on sample with over hanging structures.
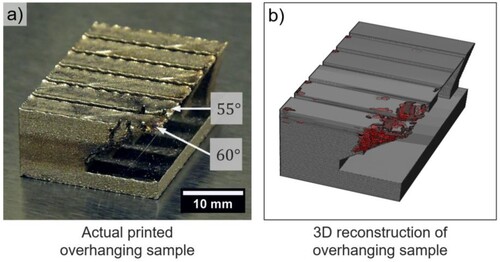
We exhibit the anomaly detection capability of our ML model by showing an actual sample printed with overhanging structures and its corresponding 3D model overlayed with super-elevation locations (). It is evidenced that severe elevation and overheating occur in the printed sample for overhanging angles and
similar to the super-elevation regions indicated in the 3D model. This strongly demonstrates the practical use of our ML model to monitor and detect possible defects that occurred in L-PBF process.
Figure 14. (a) Actual printed overhanging sample, the arrows indicate super-elevation for the two largest overhanging angles. (b) 3D model reconstructed from CAD file overlapping with super-elevation regions detected by the ML model.
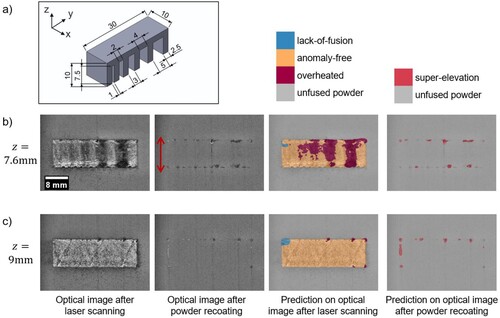
Finally, we provide a separate demonstration of our ML model’s capability in detecting anomalies during the printing of bridge structures without supports. In our sample design, the bridge span varies from to
((a)). We perform predictions on images captured both after laser scanning and after powder recoating. At the bottom surfaces of the unsupported bridges, i.e.
, the ML model detects large overheating areas for bridge span
,
and
in the image captured after laser scanning ((b)). However, these overheated areas do not cause extensive elevation, as observed from the subsequent image captured after powder recoating. At larger build height, e.g.
, prediction on image captured after laser scanning shows insignificant overheating, except a few locations where super-elevation occurs at the sample’s edge, as there are sufficient printed layers below the bridges ((c)).
Figure 15. (a) Geometry of sample with unsupported bridges. (b) Images and anomaly predictions for build height z = 7.6 mm. From left to right: image capture after laser scanning; image after powder spreading; anomaly prediction after laser scanning; anomaly prediction after powder coating. (c) Images and anomaly predictions for z = 9 mm. Arrow indicates powder recoating direction.
In , we further quantify overheating and super-elevation for build height from to
by showing the normalised overheated area
and super-elevation area
for each layer, calculated using the bridge span areas, versus build height. In (a), significant increase in overheated areas for
,
and
bridge spans when the build height reaches the bridge height
, consistent with the defective regions of the actual printed part (). We however note that overheating only persists from
to
, beyond which
reduces to a small level
. It is also worth noting that super-elevation for unsupported structures remains low, as shown in (b).
Figure 16. (a) Normalised overheated area Ao vs. build height z. (b) Normalised super-elevation area Ae vs z for bridges of different spans. Both Ao and Ae are detected by the ML model.
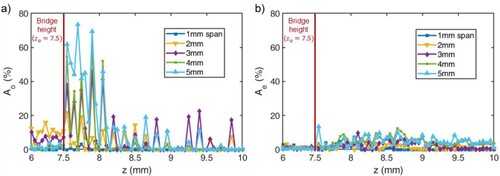
Figure 17. Actual printed sample with unsupported bridges.
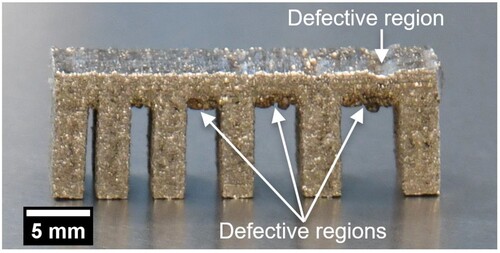
4. Conclusion
In this work, we introduce and implement a semi-supervised machine learning (ML) approach for anomaly detection in L-PBF processes. First, we obtain a reference set of layer-wise images acquired from monitoring reference samples printed with various pre-defined parameter settings. We train our ML model to classify surface appearances in the reference images. By examining the correlation between surface appearances and post-process characteristics such as surface roughness, morphology and tensile strength, we establish key surface appearances indicative of quality of the printed samples, including anomaly-free, lack-of-fusion and overheated. We then experimentally confirm that our ML model’s capability in classifying these quality-indicative surface appearances can be used for either defect detection or quality prediction of samples having various geometries, e.g. cubes, bevel gears, overhanging and unsupported structures.
The semi-supervised ML approach to quality monitoring of L-PBF processes can be expanded to other materials and 3D printing processes thanks to its simplicity in labelling training data. Further work using more extensive training datasets or incorporating thermal history by adopting Long Short-Term Memory (LSTM) module may be beneficial to both enhancing quality prediction capabilities of the ML model and confirming the occurrence of defects.
Acknowledgement
The computational work for this article was performed using resources of the National Supercomputing Centre, Singapore (https://www.nscc.sg).
Disclosure statement
No potential conflict of interest was reported by the author(s).
Additional information
Funding
References
- Abdelrahman, Mostafa, Edward W Reutzel, Abdalla R Nassar, and Thomas L Starr. 2017. “Flaw Detection in Powder Bed Fusion Using Optical Imaging.” Additive Manufacturing 15: 1–11.
- Alloghani, Mohamed, Dhiya Al-Jumeily, Jamila Mustafina, Abir Hussain, and Ahmed J. Aljaaf. 2020. “A Systematic Review on Supervised and Unsupervised Machine Learning Algorithms for Data Science.” In Supervised and Unsupervised Learning for Data Science. Unsupervised and Semi-Supervised Learning, edited by M. Berry, A. Mohamed, and B. Yap, 3–21. Cham: Springer. https://doi.org/10.1007/978-3-030-22475-2_1.
- Aoyagi, Kenta, Hao Wang, Hideki Sudo, and Akihiko Chiba. 2019. “Simple Method to Construct Process Maps for Additive Manufacturing Using a Support Vector Machine.” Additive Manufacturing 27: 353–362.
- Chen, Yingyan, Hongze Wang, Yi Wu, and Haowei Wang. 2020. “Predicting the Printability in Selective Laser Melting with a Supervised Machine Learning Method.” Materials 13 (22): 5063.
- Csurka, Gabriela, Diane Larlus, Florent Perronnin, and France Meylan. 2013. “What is a Good Evaluation Measure for Semantic Segmentation?.” Paper presented at the Bmvc, 24th British Machine Vision Conference (BMVC), University of Bristol, September 9–13.
- Drissi-Daoudi, Rita, Vigneashwara Pandiyan, Roland Logé, Sergey Shevchik, Giulio Masinelli, Hossein Ghasemi-Tabasi, Annapaola Parrilli, and Kilian Wasmer. 2022. “Differentiation of Materials and Laser Powder Bed Fusion Processing Regimes from Airborne Acoustic Emission Combined with Machine Learning.” Virtual and Physical Prototyping 17 (2): 181–204.
- Everton, Sarah K, Matthias Hirsch, Petros Stravroulakis, Richard K Leach, and Adam T Clare. 2016. “Review of in-Situ Process Monitoring and in-Situ Metrology for Metal Additive Manufacturing.” Materials & Design 95: 431–445.
- Goh, Guo Dong, Swee Leong Sing, and Wai Yee Yeong. 2021. “A Review on Machine Learning in 3D Printing: Applications, Potential, and Challenges.” Artificial Intelligence Review 54 (1): 63–94.
- Grasso, Marco, Vittorio Laguzza, Quirico Semeraro, and Bianca Maria Colosimo. 2017. “In-Process Monitoring of Selective Laser Melting: Spatial Detection of Defects via Image Data Analysis.” Journal of Manufacturing Science and Engineering 139 (5): 051001.
- Hochreiter, Sepp, and Jürgen Schmidhuber. 1997. “Long Short-Term Memory.” Neural Computation 9 (8): 1735–1780.
- Huang, De Jun, and Hua Li. 2021. “A Machine Learning Guided Investigation of Quality Repeatability in Metal Laser Powder Bed Fusion Additive Manufacturing.” Materials & Design 203: 109606.
- Joshi, Sunil C, and Abdullah A Sheikh. 2015. “3D Printing in Aerospace and its Long-Term Sustainability.” Virtual and Physical Prototyping 10 (4): 175–185.
- Khanzadeh, Mojtaba, Sudipta Chowdhury, Mohammad Marufuzzaman, Mark A Tschopp, and Linkan Bian. 2018. “Porosity Prediction: Supervised-Learning of Thermal History for Direct Laser Deposition.” Journal of Manufacturing Systems 47: 69–82.
- Khanzadeh, Mojtaba, Sudipta Chowdhury, Mark A Tschopp, Haley R Doude, Mohammad Marufuzzaman, and Linkan Bian. 2019. “In-Situ Monitoring of Melt Pool Images for Porosity Prediction in Directed Energy Deposition Processes.” IISE Transactions 51 (5): 437–455.
- King, Wayne E, Andrew T Anderson, Robert M Ferencz, Neil E Hodge, Chandrika Kamath, Saad A Khairallah, and Alexander M Rubenchik. 2015. “Laser Powder Bed Fusion Additive Manufacturing of Metals; Physics, Computational, and Materials Challenges.” Applied Physics Reviews 2 (4): 041304.
- Kouprianoff, D., N. Luwes, E. Newby, I. Yadroitsava, and I. Yadroitsev. 2017. “On-Line Monitoring of Laser Powder Bed Fusion by Acoustic Emission: Acoustic Emission for Inspection of Single Tracks Under Different Powder Layer Thickness.” Paper presented at the 2017 Pattern Recognition Association of South Africa and Robotics and Mechatronics (PRASA-RobMech).
- Ladani, Leila, and Maryam Sadeghilaridjani. 2021. “Review of Powder Bed Fusion Additive Manufacturing for Metals.” Metals 11 (9): 1391.
- Lane, Brandon, Shawn Moylan, Eric P Whitenton, and Li Ma. 2016. “Thermographic Measurements of the Commercial Laser Powder Bed Fusion Process at NIST.” Rapid Prototyping Journal 22 (5): 778–787.
- Leung, Chu Lun Alex, Sebastian Marussi, Robert C. Atwood, Michael Towrie, Philip J. Withers, and Peter D. Lee. 2018. “In Situ X-ray Imaging of Defect and Molten Pool Dynamics in Laser Additive Manufacturing.” Nature Communications 9 (1): 1–9.
- Liu, Sen, Aaron P Stebner, Branden B Kappes, and Xiaoli Zhang. 2021. “Machine Learning for Knowledge Transfer Across Multiple Metals Additive Manufacturing Printers.” Additive Manufacturing 39: 101877.
- Lu, Q. Y., N. V. Nguyen, A. J. W. Hum, T. Tran, and C. H. Wong. 2019. “Optical in-Situ Monitoring and Correlation of Density and Mechanical Properties of Stainless Steel Parts Produced by Selective Laser Melting Process Based on Varied Energy Density.” Journal of Materials Processing Technology 271: 520–531.
- Lu, Q. Y., N. V. Nguyen, A. J. W. Hum, T. Tran, and C. H. Wong. 2020. “Identification and Evaluation of Defects in Selective Laser Melted 316L Stainless Steel Parts via in-Situ Monitoring and Micro Computed Tomography.” Additive Manufacturing 35: 101287.
- McCann, Ronan, Muhannad A Obeidi, Cian Hughes, Éanna McCarthy, Darragh S Egan, Rajani K Vijayaraghavan, Ajey M Joshi, Victor Acinas Garzon, Denis P Dowling, and Patrick J McNally. 2021. “In-Situ Sensing, Process Monitoring and Machine Control in Laser Powder Bed Fusion: A Review.” Additive Manufacturing 45: 102058.
- Okaro, Ikenna A, Sarini Jayasinghe, Chris Sutcliffe, Kate Black, Paolo Paoletti, and Peter L Green. 2019. “Automatic Fault Detection for Laser Powder-bed Fusion Using Semi-Supervised Machine Learning.” Additive Manufacturing 27: 42–53.
- Oliveira, João Pedro, A. D. LaLonde, and J. Ma. 2020. “Processing Parameters in Laser Powder Bed Fusion Metal Additive Manufacturing.” Materials & Design 193: 108762.
- Pandiyan, Vigneashwara, Rita Drissi-Daoudi, Sergey Shevchik, Giulio Masinelli, Tri Le-Quang, Roland Logé, and Kilian Wasmer. 2021. “Semi-supervised Monitoring of Laser Powder Bed Fusion Process Based on Acoustic Emissions.” Virtual and Physical Prototyping 16 (4): 481–497.
- Raplee, J., A. Plotkowski, Michael M Kirka, R. Dinwiddie, A. Okello, Ryan R Dehoff, and Sudarsanam Suresh Babu. 2017. “Thermographic Microstructure Monitoring in Electron Beam Additive Manufacturing.” Scientific Reports 7 (1): 1–16.
- Scime, Luke, and Jack Beuth. 2018a. “Anomaly Detection and Classification in a Laser Powder Bed Additive Manufacturing Process Using a Trained Computer Vision Algorithm.” Additive Manufacturing 19: 114–126.
- Scime, Luke, and Jack Beuth. 2018b. “A Multi-Scale Convolutional Neural Network for Autonomous Anomaly Detection and Classification in a Laser Powder Bed Fusion Additive Manufacturing Process.” Additive Manufacturing 24: 273–286.
- Shevchik, Sergey A, Christoph Kenel, Christian Leinenbach, and Kilian Wasmer. 2018. “Acoustic Emission for in Situ Quality Monitoring in Additive Manufacturing Using Spectral Convolutional Neural Networks.” Additive Manufacturing 21: 598–604.
- Sing, S. L., C. N. Kuo, C. T. Shih, C. C. Ho, and C. K. Chua. 2021. “Perspectives of Using Machine Learning in Laser Powder Bed Fusion for Metal Additive Manufacturing.” Virtual and Physical Prototyping 16 (3): 372–386.
- Song, Lijun, Wenkang Huang, Xu Han, and Jyoti Mazumder. 2016. “Real-time Composition Monitoring Using Support Vector Regression of Laser-induced Plasma for Laser Additive Manufacturing.” IEEE Transactions on Industrial Electronics 64 (1): 633–642.
- Tianhua, Chen, Zheng Siqun, and Yu Junchuan. 2018. “Remote Sensing Image Segmentation Using Improved DeepLab Network.” Measurement and Control Technology 37 (11): 40–45.
- Tofail, Syed AM, Elias P Koumoulos, Amit Bandyopadhyay, Susmita Bose, Lisa O’Donoghue, and Costas Charitidis. 2018. “Additive Manufacturing: Scientific and Technological Challenges, Market Uptake and Opportunities.” Materials Today 21 (1): 22–37.
- Wang, Di, Linqing Liu, Guowei Deng, Cheng Deng, Yuchao Bai, Yongqiang Yang, Weihui Wu, Jie Chen, Yang Liu, and Yonggang Wang. 2022. “Recent Progress on Additive Manufacturing of Multi-Material Structures with Laser Powder bed Fusion.” Virtual and Physical Prototyping 17 (2): 329–365.
- Wang, Jingdong, Ke Sun, Tianheng Cheng, Borui Jiang, Chaorui Deng, Yang Zhao, Dong Liu, Yadong Mu, Mingkui Tan, and Xinggang Wang. 2020. “Deep High-Resolution Representation Learning for Visual Recognition.” IEEE Transactions on Pattern Analysis and Machine Intelligence 43 (10): 3349–3364.
- Wang, Chengcheng, X. P. Tan, S. B. Tor, and C. S. Lim. 2020. “Machine Learning in Additive Manufacturing: State-of-the-Art and Perspectives.” Additive Manufacturing 36: 101538.
- Ye, Dongsen, Geok Soon Hong, Yingjie Zhang, Kunpeng Zhu, and Jerry Ying Hsi Fuh. 2018. “Defect Detection in Selective Laser Melting Technology by Acoustic Signals with Deep Belief Networks.” The International Journal of Advanced Manufacturing Technology 96 (5): 2791–2801.
- Zhang, Rongyu, Lixuan Du, Qi Xiao, and Jiaming Liu. 2020. “Comparison of Backbones for Semantic Segmentation Network.” Paper presented at the Journal of Physics: Conference Series, Suzhou, China, March 20–22.
- Zhang, Bin, Shunyu Liu, and Yung C Shin. 2019. “In-process Monitoring of Porosity During Laser Additive Manufacturing Process.” Additive Manufacturing 28: 497–505.
- zur Jacobsmühlen, Joschka, Stefan Kleszczynski, Gerd Witt, and Dorit Merhof. 2015. “Elevated Region Area Measurement for Quantitative Analysis of Laser Beam Melting Process Stability.” Paper presented at the 26th International Solid Freeform Fabrication Symposium, Austin, TX.
- zur Jacobsmühlen, Joschka, Stefan Kleszczynski, Gerd Witt, and Dorit Merhof. 2017. “Compound Quality Assessment in Laser Beam Melting Processes Using Layer Images.” Paper presented at the 2017 IEEE International Instrumentation and Measurement Technology Conference (I2MTC), Torino, Italy, May 22–25.