
 ?Mathematical formulae have been encoded as MathML and are displayed in this HTML version using MathJax in order to improve their display. Uncheck the box to turn MathJax off. This feature requires Javascript. Click on a formula to zoom.
ABSTRACT
A convolutional neural network (CNN) guided Bayesian optimisation framework is introduced to strategically maximise the surface to volume ratio of 3D printed lattice supercapacitors. We applied Bayesian optimisation on printing parameters to exploit regions where uniform and narrow lines are printed. A line shape classifying CNN model guided the optimiser’s search space to straight-line printed regions, minimising optimisation time and cost. An automatic scoring method allowed each iteration to be conducted within two minutes with accurate and precise measurements. The optimisation process has been demonstrated with graphene oxide (GO) and poly(3,4-ethylenedioxythiophene):polystyrene sulphonate (PEDOT:PSS) inks. The results were compared to the parameters that follow the conventional methodologies of direct ink writing (DIW) 3D printing. For each printed line of GO and PEDOT:PSS inks, irregularities decreased by 61.8% and 18.9% and average widths decreased by 39.0% and 28.6%. PEDOT:PSS lattice supercapacitor printed using optimised result showed a 151.0% increase in specific capacitance.
Introduction
In the recent decade, there has been an uprising demand for micro power sources and small energy storages devices. New materials and methodologies to obtain favourable mechanical and electrochemical properties are widely being researched (Li and Liang Citation2020; Zong et al. Citation2022; Monisha and Agarwala Citation2022). In accordance with the new development of material candidates, 3D printing techniques have gained the spotlight for their high adaptability to new materials, customisable designs, inexpensive accessories, and simple operating systems (Goh et al. Citation2022; Park et al. Citation2022; Rao et al. Citation2022; Tan et al. Citation2022). In particular, 3D printed supercapacitors have been extensively researched for their high areal energy density and their convenient integration with other electronic systems (Li et al. Citation2020; Egorov et al. Citation2020; Li et al. Citation2022). Among the 3D printing techniques, DIW has many advantages since it can form complex structures with a wide range of materials with ease compared to other 3D printing technologies. Furthermore, formation of porous structures in 3D printed lattices has been demonstrated to increase supercapacitor performance dramatically (Jiang et al. Citation2018; Yao et al. Citation2021).
However, there has been lack of studies on tuning the process variables of the DIW. Much research was conducted on material characteristics, such as viscoelasticity, electrical conductivity, and mechanical strength, but less attention had been given to printer parameters that can affect the print fidelity and surface area. Unlike the simple pneumatic extrusion process, the 3D printed product is not only affected by the ink’s rheological properties, but also by the extrusion pressure, nozzle speed, nozzle type, nozzle diameter, nozzle standoff distance (distance of the nozzle from the platform or the previous layer), reservoir temperature, platform temperature, room humidity, and many others (Udofia and Zhou Citation2018; Yuk and Zhao Citation2018). Predicting the behaviour of the extruded ink under these correlated process variables is much difficult. There have been trials to mathematically model the extruded ink flowrate depending on the applied syringe pressure (Li et al. Citation2011; Suntornnond et al. Citation2016), and empirical studies on recommended standoff distances (Jin, Zhao, and Huang Citation2018; Li, Clark, and Church Citation2007) and how it possibly affects the flow rate (Wang and Shaw Citation2005). However, no analytic solutions or template guidelines exist so far to predict the morphology of the 3D printed ink structure. DIW still accompanies the printer’s trial and error method to print the desired structure.
Recent advances in 3D printing have started implementing machine learning (ML) to replace the traditional costly and laborious trial and error approach in process parameter optimisation (Ng et al. Citation2020; Wang et al. Citation2020). ML techniques train datasets to statistically model relationships between input data and output data without any explicit codes. Although collecting large datasets can help to model complex relationships, it is important to understand the governing equations as they help to collect quality data and reduce the number of dataset required for optimisation (Bone et al. Citation2020; Menon et al. Citation2019). Requiring large train datasets can limit its usage and application in 3D printing.
On the other hand, Bayesian optimisation, a technique used in ML, builds a statistical model from ground up, requiring no pretrained dataset (Kandasamy et al. Citation2018). Recent research demonstrated its use in the field of DIW (Ruberu et al. Citation2021). Throughout the optimisation, it has successfully found that improved printing parameters result in better printed filament morphologies. In the more recent trial, automised Bayesian optimisation system was built to tune nozzle delay and speed and drop ink on a pre-set area (Deneault et al. Citation2021). However, the objective of using Bayesian optimisation in printability optimisations have often been vague because printability can be hard to quantify. Scorings done by human evaluators with the optimisation objectives to achieve ‘good printability’ has not only confused the optimisation by human errors but also directed the optimiser into biased directions. The meanings in using Bayesian optimisation method have been hindered. In the previous research, the human evaluator’s expertise or the subjectively pre-set ‘optimal point guideline’ has acted as an upper limit of the optimiser’s performance.
A rather reasonable method of scoring should use measurable scales and seek to optimise with no pre-set critical point. This way, the Bayesian optimiser is guided in the right direction while its potential to maximise/minimise is fully utilised. Human evaluators are also prevented from hindering the Bayesian optimiser capabilities to exploit a local critical point. The Bayesian optimiser selects the next scoring point through either exploration or exploitation. Exploration occurs when the optimiser expects the new global optimum (min or max) on an unexplored section with the highest uncertainty. Exploitation occurs when the optimiser expects the global optimum point to be near the current optimum point and searches areas near it. While exploration points can be roughly scored by human evaluation method, exploitation points are vulnerable to human error.
We herein present a simple yet practical CNN-guided Bayesian optimisation method to find the printing parameters that result in uniform and narrow printed lines. Three optimising parameters of applied pressure (P), nozzle velocity (V), and nozzle standoff distance (H) have been chosen. We make use of the available knowledge of the relationship between applied pressure and ink extrusion speed in a syringe, as derived in a previous work (Suntornnond et al. Citation2016), and extrusion speed (C) and nozzle velocity relation(V) using a dimensionless number V* (Yuk and Zhao Citation2018). V* is defined as ink extrusion speed over nozzle velocity (V* = C/V). The CNN model built upon different stages of V* is used to classify line morphologies. When it detects a non-straight line, it guides the Bayesian optimiser’s search space to the straight region, preventing unnecessary and costly explorations. As the CNN model narrows down the search space, Bayesian optimiser builds its surrogate model of the unknown P-V-H relationship, and the acquisition function attempts to search for a global maximum.
Material and methods
Ink preparation
Preparation of PEDOT:PSS ink
PEDOT:PSS, a widely used conducting polymer, has been reported 3D printable, allowing to print 3D conductive microstructures (Lu et al. Citation2019; Yuk et al. Citation2020). PEDOT:PSS nanofibrils were extracted through lyophilisation of pristine PEDOT:PSS solution. 6 wt% of PEDOT:PSS nanofibrils were redispersed in solution of deionised (DI) water and dimethyl sulfoxide (DI water: DMSO = 85: 15 v/v). Although conductive in nature, after-treatment of annealing in 140°C boosts up the conductivity.
Preparation of GO ink
Single layer graphene oxide of 0.7–1.2 nm thickness was dispersed in DI water (GO: DI water = 40 mg / ml). Hydroxypropyl methylcellulose and carbomer was added 1.5 wt% and 1.3 wt% respectively to form ink’s viscoelastic behaviour. Sodium hydroxide (NaOH) was added (NaOH: DI water = 1 : 1
) to counter balance the PH of the GO ink. Unlike PEDOT:PSS, GO inks are not conductive in nature. To gain conductivity, it must be reduced into rGO through thermal or chemical reduction.
Optimisation parameters
The key parameters in DIW are summarised in . In this work, we opt to optimise the operation parameters that are related to the printing operation and has continuous datasets. Parameters such as the reservoir temperature and room humidity were maintained at 25°C and 63% throughout the whole study as they influence the ink’s rheological property. As mentioned above, the ink formulations of PEDOT:PSS and GO were optimised in other works, and the optimum ink formulations were used in this study without change. On the other hand, nozzle shape, although a key parameter in determining ink flowrate and filament diameter, was excluded for its discrete datasets. For our optimisation, we selected tapered nozzles with smallest available or possible diameters for each ink. 27-gauge precision tapered tip (200 Nordson EFD) was selected for PEDOT:PSS ink and 25-gauge precision tapered tip (250
Nordson EFD) was selected for GO ink. The platform material was fixed to microscope slides (Marienfeld GmbH & Co.KG).
Table 1. List of key parameters in pressure driven DIW 3d printing.
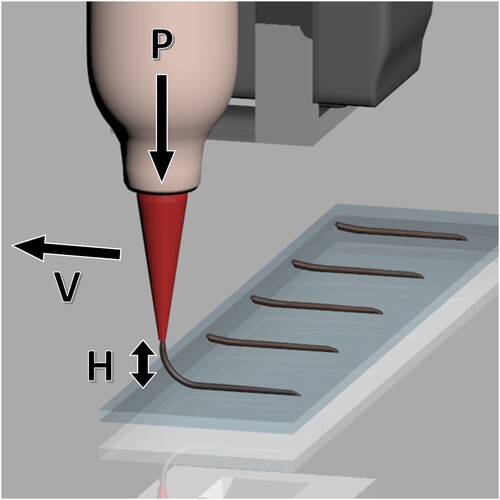
We selected pressure (P), nozzle velocity (V) and standoff distance (H) as our optimisation parameters (). The pressure controls the ink exit flowrate at the nozzle. As the ink gets extruded, the nozzle moves with a constant velocity, determining the filament morphology on the platform. Thus, a careful balance between P and V is required to acquire the desired structure. The standoff distance is the distance between the nozzle tip and the platform, or the preceding deposited filament layer. It affects the contact angle between the extruded ink and substrate. A low standoff distance is vulnerable to ink accumulation. On the other hand, high standoff distance can cause the flowrate to increase as the back pressure generated from the physical contact of the extruded filament and platform is reduced (Cao et al. Citation2009; Wang and Shaw Citation2005). However, such high standoff distances increase time for the ink to reach the platform and can cause instable behaviours of the dropping ink. Experimental data suggest that the standoff distance should be higher than the nozzle diameter () and lower than
.
Figure 1. Schematic of extrusion type DIW printer operation with applied pressure (P), nozzle velocity (V), and standoff distance (H).
Although parameters P, V, and H are observable to the optimiser, the Bayesian optimiser will be optimising . The relationship between P and
is explained in the following manner.
For incompressible shear thinning ink, the relationship between applied pressure and extruded ink velocity (C) inside a capillary tube is defined as below.
where
is ink viscosity,
is nozzle length,
is flow index,
is nozzle diameter, and
is the printed filament diameter. Assuming homogeneous ink and fixed nozzle shape,
where is a constant decided upon the ink rheology and nozzle shape. However, the ink has a behaviour of the Hershcel–Bulkley fluid and has a distinct yield stress. Thus, as there exists a minimum pressure
to initiate the extrusion process, the P–C relationship can be finalised as:
Now the dimensionless number V* (V* = C / V) is defined as:
Then the relationship between P and kV* can be shown as:
At a given point V, optimising has the same effect as optimising P itself. Through taking
as our optimisation parameter, we leverage our domain knowledge on
to reduce the optimiser’s search space. Calculating the constant
is impractical as it requires prior knowledge of the ink’s rheological properties and nozzle shape. Therefore, while the calculated pressure
is given to the user, the optimiser will optimise
, a pressure to velocity ratio.
The minimum pressures required to initiate ink extrusion () were experimentally found to be 24 and 105 kPa for PEDOT:PSS and GO ink respectfully. Prior to the optimisation, initial boundaries of nozzle velocity were set to the user’s needs. For our optimisation on PEDOT:PSS and GO inks, we chose a lower and upper boundary of 10 and 20 mm/s. The parameter kV* initially has a boundary between 0 and 5 but will be modified by the CNN model as the optimisation proceeds. The lower boundary of the standoff distance is set 0.05 mm below the nozzle inner diameter (D) and the upper boundary is set 0.05 mm above 3D (Cao et al. Citation2009; Middleman Citation1995).
Process diagram
The overall process diagram of the CNN guided Bayesian optimisation is shown in a. The process initiates with a set of random sampling points. In the initial experiments and in every iteration, the experimenter is required to print out a line segment with the given batch of ,
, and
. The printed line segment is captured using a camera that has a fixed x and z location ((b)). Changes in the y-location does not affect the scoring method if the line is within the camera angle. Additionally, as pneumatic extrusion process often shows irregular behaviours in the initial and final stages of applying and releasing pressure, we set our G-code to print out a 15mm line and captured 6.5mm from the middle. We used a built-in camera of the Nordson Pro4 3D printer. The captured images of printed GO and PEDOT:PSS lines from two separate optimisations are shown in c and d, respectively. It is noticeable how strongly the images are affected by lighting conditions. Unlike the GO ink, PEDOT:PSS ink was shot under a darker environment and thus has more noise on the captured image. The noise is later removed through image processing steps and does not affect the optimisation.
Figure 2. CNN guided Bayesian optimisation process diagram. (a) CNN guided Bayesian optimiser and experimenter’s iteration process. (b) Capturing line image from the camera. Captured line images of (c) GO and (d) PEDOT:PSS inks.
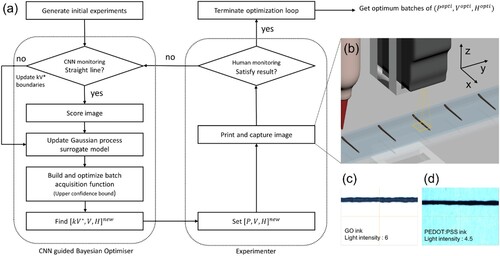
The experimenter can proceed the optimisation process by feeding the image into the optimiser. The input image is monitored by the CNN model and categorised into discontinuous, straight, coiled, or accumulated lines. If it detects a discontinuous line, the lower boundary of the Bayesian Optimiser’s parameter kV* will be updated to the current sampling point’s kV* value. If the model detects coiled or accumulated line, the upper boundary of the kV* of the Bayesian Optimiser’s parameter kV* will be updated to the current kV* value. Through several optimisation trials, we found that setting a harsh lower boundary on kV* can hinder the optimiser’s ability to exploit the borderline between thinning and discontinuous line regions. Thus, when setting lower boundaries of kV*, we gave a patience value of 0.1 to account for possible errors in the mathematical modelling of kV* or irregularities caused by inhomogeneous ink. Once passing the CNN model, the image is scored depending on its line morphology. Lines with congruent widths will score high marks. The scores are fed into the Bayesian Optimiser to update the Gaussian process surrogate model. The Gaussian process is specified by the mean function and estimations on its near points are given by the covariance function (Rasmussen and Williams Citation2006). The acquisition function, built using the model’s mean and covariance, picks up the next sampling batch and notifies the experimenter. The experimenter then repeats the process of printing, capturing, and feeding back to the optimiser. As the surrogate model gets updated throughout the experiment iterations, the acquisition function reduces the uncertainties in the surrogate model and seeks to find its global maximum. Therefore, as the Bayesian optimisation improves its search speed based on its prior searches, it allows an efficient global optimisation on the complex and noisy results of DIW. The experimenter can terminate the process when he/she is satisfied with the printed line. For our demonstration with GO and PEDOT:PSS inks, we applied upper confidence bound acquisition function (Brochu, Cora, and De Freitas Citation2010) and prolonged the optimisation process until the search boundaries of kV* were set fixed and no apparent improvements were made in the scorings.
CNN model
3D printed ink filaments were categorised into six different categories based on different levels of kV* in a similar manner to a previous work (Yuk and Zhao Citation2018) (). Die-swelling, equi-dimensional, and thinning were merged into a single ‘straight’ category because there were not enough image features to distinguish among the three printed lines. Around 1000 images for the resulting four categories of discontinuous, straight, coiled, and accumulated were prepared by carefully controlling the applied pressure and nozzle velocity ratio. The images were captured in identical methods used in the optimisation process, as illustrated in b.
Table 2. 3d printed line morphologies categorised by increasing kV* value.
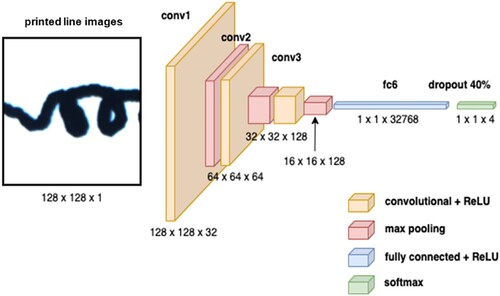
The prepared images were pre-processed with the steps of greyscale conversion, normalisation, and downscaling to 128 × 128 pixels. Due to the relatively simple model, information loss during the rescaling was considered minor and thus its damage on the model accuracy was ignored. As illustrated in , the processed images were fed into the network consisting of 3 convolutional layers, followed by 1 flatten layer, and a Softmax activation function to classify the 4-line categories. Adam optimiser was selected for training the model and a total of 3750 datasets (about 930 for each category) were trained. The model was early stopped after 17 epochs to avoid overfitting. It gave 99.57% training accuracy, 99.75% validation accuracy with 0.0104 validation loss. The model was evaluated using 416 test datasets. The model successfully predicted the test datasets with a 99.75% accuracy. The 0.25% error came from the model mistakenly predicting a ‘straight line’ as ‘accumulated line’ (Supplement Figure 1).
Figure 3. Architecture of the CNN model built for classifying line images.
Scoring method
For scoring of printed filaments and removal of external noises other than printed filaments, the input image is turned into greyscale and is categorised into either white or black by comparing the greyscale intensity to a threshold value. The threshold value is determined experimentally as 100. Pixels that exceed the given threshold value will be given an intensity value of 255 (white) and pixels that struggle to exceed will be turned to 0 (black). a shows images of 6 different PEDOT:PSS lines and the processed results without external noises are shown in b. Each image has a width of 800 pixels a height of 600 pixels (images vertically cropped for fitting in (a) and (b)). For every 800 pixels, we can measure the width of the printed filament line by counting the number of black pixels () in that column. The resulting measurements (
) for each line are plotted on a graph and shown in c. The average line width can be represented by the mean value of the 800 width measurements.
The line uniformity can be represented by the standard deviation of the 800 width measurements.
Figure 4. Scorings given to six different lines printed using PEDOT:PSS ink. (a) Original images captured from the camera. Each image height is cropped to fit the figure. (b) Images after greyscale transition and thresholding process. (c) Line width measurements plotted on graph by number of pixels with their mean and standard deviation values. (d) Standard deviations plotted against mean.
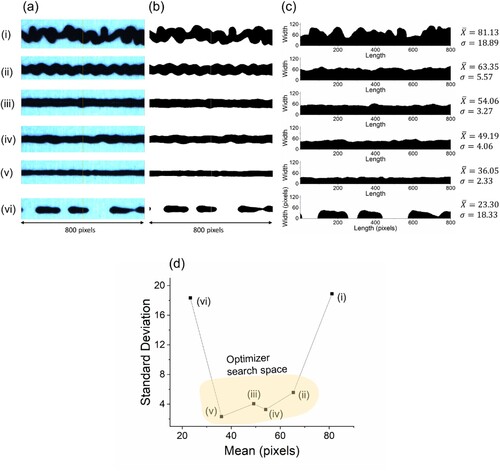
Extreme standard deviation values are found in accumulated and discontinuous lines. As the line width measurements show more consistency, the standard deviation values drop, and the lowest values are given to the straightest lines. Therefore, we set the standard deviation as our scoring method. The scoring algorithm is summarised in Python language in Supplement Figure 2. In d, standard deviation values of the 6 lines are plotted against the average width values. The scorings are fed into the Bayesian optimiser in a negative value for the optimiser to maximise. Therefore, the optimiser will seek for lines with the lowest standard deviation values and its search space will be focused on the highlighted region. Narrower average line width does not necessarily mean lower standard deviation value. It is noticeable that line (iii) is wider line than line (iv) but still has a lower standard deviation value. This shows that wider lines can achieve low scores as long as its line uniformity is guaranteed. However, there is a general tendency for narrower lines to achieve lower standard deviation values in the whole optimiser search space. Therefore, the best scoring lines are expected in the uniform thinning region as in point (v) in d. The optimiser will explore the yellow region and optimally exploit a boundary between thinning and discontinuous lines.
Results
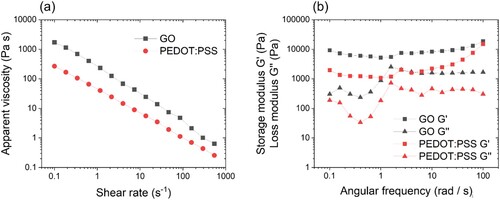
The optimisation was initiated by searching five random points and was prolonged until kV* boundaries were set fixed and no significant improvements on the scores were made. The full optimisation log is available in Supplemental Tables I and II. In , the optimisation points for each parameter with their scores represented in colour is plotted in the order of experiment iterations. During the early stages of the optimisation, the CNN model aggressively narrowed down the search space of the parameter kV*. Its initial boundary of [0, 5] was narrowed down to [1.14, 2.31] after 73 iterations for GO ink optimisation, and to [1.68, 2.10] after 49 iterations for PEDOT:PSS ink optimisation. This search space was highly affected by the rheological properties of a printing ink. GO ink had relatively higher viscoelasticity than PEDOT:PSS inks and thus showed higher resistance to tensile stresses (). Therefore, the degree of stretching of printed filaments is lower for the GO ink than for the PEDOT:PSS ink. This explains the lower sensitivity of the stretching degree the GO filament in response to the variation of nozzle speed, V. This results in the wider kV* range of GO inks than PEDOT:PSS inks. On the other hand, PEDOT:PSS inks were more dominantly influenced by stretching owing to relatively faster movement of a printing nozzle than the speed of filament printing. Such stretching-prone characteristic of PEDOT:PSS inks are originated from their low viscoelasticity compared to GO inks. However, the easy stretchiness can cause discontinuity relatively easily for too low value of kV*.
Figure 5. Applied pressure and the three optimisation parameters of kV*, nozzle velocity, and standoff distance are plotted against experiment iteration. Straight lines are plotted in filled circles, discontinuous lines are plotted in empty circles, and coiled or accumulated lines are plotted in empty stars. The plot colour of the filled circles represents the line score. (a) Optimisation results of GO ink. (b) Optimisation results of PEDOT:PSS ink.
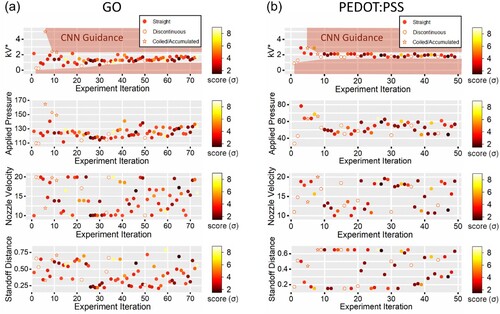
Figure 6. (a) Apparent viscosities of GO and PEDOT:PSS ink as a function of shear rate. (b) Shear storage modulus and loss modulus of GO and PEDOT:PSS ink as a function of angular frequency.
a shows the 73 iterations in GO ink optimisation. Throughout the optimisation, 4 discontinuous, 66 straight, 2 coiling, and 1 accumulation lines were detected by the CNN model. As kV* was regulated by the CNN model, applied pressure was controlled to search within ‘straight’ regions. This did not only save optimisation time and experimenter’s labour, but also saved ink waste caused by searching harsh accumulation or coiling regions. On the other hand, nozzle velocity and standoff distance were searched freely within their boundaries throughout the optimisation. There were no specific nozzle velocity regions that showed optimal results. The nozzle velocity itself did not affect the printability of the ink filament. However, when coupled with the applied pressure, there were regions in their ratio where linear uniform lines were printed. Specifically, the lines tended to score higher when kV* value reached close to its lower bound, 1.68. The ink showed relatively random results at high standoff distances. External noises coming from the experiment environment, or large grainy undermixed molecules in the GO ink could have affected the irregular behaviours of free-falling ink. Lines printed at standoff distances close to the nozzle diameter showed more orderly results, following the conventional methodologies of 3D printing to some extent. However, some of the best-scoring lines were also printed at high standoff distances.
b shows PEDOT:PSS ink optimised for 49 iterations, composed of 38 straight, 9 discontinuous, and 1 coiled, and 1 aggregated lines. Discontinuous lines were printed frequently throughout the optimisation because kV* boundaries were narrow and a patience value of 0.1 was given to its lower boundary. Because the CNN model guided to such an extreme level, the optimiser was able to quickly exploit the thinning-discontinuous regions and the optimisation was terminated by the experimenter quicker than the previous GO ink optimisation.
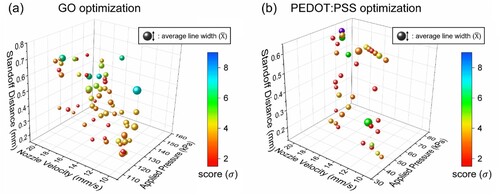
The straight lines are plotted according to the 3 optimisation parameters in 3-dimensional graphs in . Scores are represented by the plot colour and the average width are represented by the plot size. The trends in red plots graphically show that there exists a trend in the ratio of nozzle velocity and applied pressure for both inks. The CNN guided Bayesian optimisation keeps its search space close to that trend line, occupying only 20.5% and 12.4% of the original Bayesian optimisation’s cubic search space for GO and PEDOT:PSS ink, respectively. Within the narrow search space, GO optimisation in a has fully explored its points. However, as shown in b, some regions have not been explored in PEDOT:PSS optimisation. The search points on the standoff distance are biased to its two extreme values. Returning to the 2d plots in b, the optimiser initially explores the two extreme values of the standoff distance for 20 iterations, then gradually starts investigating the mid regions. Therefore, taking more iterations should fix this problem. Another solution can be to increase the Kappa value so that more weight is given to exploration when selecting the next search point. Currently, the acquisition function of upper confidence bound method is given a kappa value of 2.576 to balance between exploration and exploitation.
Figure 7. Straight line results are plotted in 3D graphs according to applied pressure, nozzle velocity, and standoff distance. The plot colour represents the line score and the plot size represents the average line width. (a) 3D plot of straight lines printed from GO inks. (b) 3D plot of straight lines printed from PEDOT:PSS inks.
In and , top 5 results are given with their scores and average width. Notice that the results don’t all have the narrowest achievable widths. The tables rather give a set of options of lines where the line uniformity, the structure rigidity of the 3D printed ink filament, is guaranteed. In the conventional methodology of DIW, the nozzle speed is set equal to ink extrusion speed and standoff distance is set equal to ink extrusion width (Yuk and Zhao Citation2018). When applied pressure levels were set to 120 and 45 kPa for GO and PEDOT:PSS ink respectively, their extrusion speeds were measured to be 7.42 and 12.12 mm/s (Supplemental Video 1, Supplemental Video 2). The extrusion widths are measured using a microscope to be 0.28 and 0.22 mm (Supplemental Figure 3). The two lines printed using these conventional methods are scored and listed at the bottom of the tables for comparison with the optimised results. For GO ink in , ‘optimised result 1’ showed 61.8% decrease in standard deviation and ‘optimised result 3’ showed 39.0% decrease in mean. For PEDOT:PSS ink in , ‘optimised result 1’ showed 18.9% decrease in standard deviation and 28.6% decrease in mean.
Table 3. Top 5 optimised and conventional results for GO ink.
Table 4. Top 5 optimised and conventional results for PEDOT:PSS ink.
Application
Both printed PEDOT:PSS and GO filaments require post processing in order to gain capacitance and structural rigidity. However, while PEDOT:PSS requires a relatively short process of dry-annealing, GO requires freezing, lyophilisation, and thermal/chemical reduction. Due to the limitations in reduction equipment, supercapacitor’s capacitance enhancements are demonstrated using PEDOT:PSS ink. Lattice structures were printed with fixed volume of 5 mm × 5 mm × 1.2 mm, but different ligament numbers (a). For lattice structures printed with the conventional method, pores started closing when 10 ligaments got lined up close to each other. The pores fully closed as an additional ligament was added. However, in the case of ‘optimised result 2’ from , narrower ligaments with enhanced uniformity maintained the porous structure even when 11 ligaments were piled for each layer.
Figure 8. PEDOT:PSS lattice supercapacitors are built using the conventional parameters and optimised parameters for 3D printing. The lattice structures have fixed volume but the number of ligaments in each floor is increased from 9 to 11. Specific capacitances of the supercapacitors are measured through the cyclic voltammetry (CV) and the results are compared. (a) Lattice supercapacitors printed using the conventional and optimised parameters. (b) Schematic of PEDOT:PSS electrode and the formation of double layer capacitance between PEDOT and PSS regions. (c) CV measurements of the supercapacitors. (d) Specific capacitance calculated using the CV measurements.
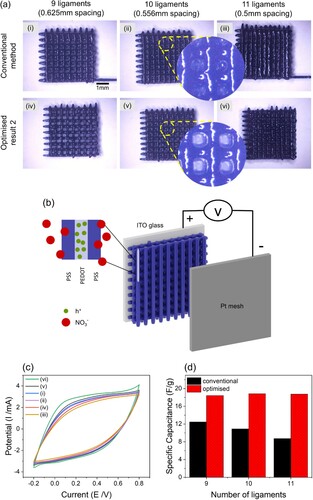
The printed lattice structures were dried at 60°C for 24 h, followed by 3 cycles of annealing at 130°C for 30 min. During the annealing process, PEDOT rich nanofibrils recrystallised and PEDOT and PSS chains were rearranged. During the rearrangement, the PEDOT rich centre becomes a hole conductive region and the PSS rich surface becomes an ion conductive region, creating a double layer capacitance (b). Therefore, the capacitance is highly affected by the surface area of the electrode that forms the double layer. The lattice structures were reswelled in electrolyte, 100 mM of potassium nitrate (KNO3) in phosphate buffered saline (PBS), for 10 min and the specific capacitances were measured from the cyclic voltammetry (CV) at scan rate 50 mV/s. A platinum mesh and Ag/AgCl electrodes were employed as counter and reference electrodes, respectively. When printed with the same ligament number, thicker ligaments in (i) result in larger areas under the CV curve than in (iv) (c). However, as additional ligaments are introduced, the area under the CV curve starts to decrease for the lattices printed using the conventional parameters, indicating a decrease in the surface area to volume ratio. On the other hand, lattices printed using the optimised parameters show a slight increase in the area under the CV curve as additional ligaments are introduced. Specific capacitance is calculated from the measured CV curves. As the specific capacitance also accounts the supercapacitor mass, the difference in using optimised parameters was highlighted (d). The highest specific capacitances of the two conventional and optimised types were achieved by (i) and (vi) as 12.48 and 18.84 F/g respectively. Through the CNN guided Bayesian optimisation, we were able to increase the specific capacitance of the printed supercapacitors by 151.0%.
Discussion
We have demonstrated the optimisation of two recently discovered inks used in DIW to print electrodes or supercapacitors. Optimisation of printing parameters is always necessary to achieve the desired morphologies of printing patterns. The difficulty of this optimisation has been a long disadvantage and thus a limiting factor of DIW. Unlike its simple operating system, analytic solutions to viscoelastic ink’s behaviour have yet been discovered and for that reason, making general guidelines is impractical. Laborious trial and error method is still used to tune the printing parameters. However, the ink’s rheological properties change often. This not only accounts for situations when new methods & materials are introduced, but also when the ink’s rheological behaviours change due to minor changes in the manufacturing process. Some variables like evaporation and inhomogeneity significantly affect the ink rheological behaviour but are hard for the experimenter to perfectly control. If the ink rheology changes even slightly, the printing parameters should be re-optimised. Therefore, a simpler yet practical method to optimise the printing parameters is necessary and the Bayesian optimisation may hold the key to setting guidelines for DIW.
The biggest advantage in using Bayesian optimisation is that no pre-set datasets are required unlike other ML algorithms. Preparing large datasets in 3D printing involves extensive preparation time and thus faces challenges in real-life applications (Yu and Jiang Citation2020). Meanwhile, Menon et al. showed that the dataset can be reduced when underlying physical modelling is integrated into the current statistics-based ML process. They have demonstrated optimisation of 3D printed silicone elastomer using only 38 datasets (Menon et al. Citation2019). Follow-up research has applied the same framework to DIW 3D printed biopolymers using 48 datasets, resulting a 95% linewidth match to their original CAD design (Bone et al. Citation2020). Inspired from their works, we integrated the physical modelling of P-V relationship into the Bayesian optimiser with the help of the CNN model guidance. We successfully reduced the search space by 79.5% and 87.6% for GO and PEDOT:PSS ink, respectively. Unlike the top-down approaches of the conventional ML optimisations, CNN-guided Bayesian optimisation takes a bottom-up approach, giving more flexibility in applications to different inks as no datasets or pre-set CAD designs are required.
As the CNN model guided the Bayesian optimiser to such a narrow search space, the human visual assessment method made in previous Bayesian optimisation was no longer applicable (Ruberu et al. Citation2021). Any inconsistent or biased feedbacks led to fatal errors. Therefore, we developed a novel scoring algorithm that allowed accurate and precise measurements on filament width uniformity. Exploitations of close sampling points were fed back with objective, accurate and precise score data. The experimenter now requires no prior knowledge on the optimisation method or the ink’s rheological behaviour. The optimisation can be applied to unfamiliar inks. Through the image processing steps of greyscale transformation and thresholding, we isolated the ink filament from its background regardless of its colour. The model training and line scorings are thus not affected by the ink type.
Previous applications of Bayesian optimisation in DIW used large batch sizes, ranging from 4 to 10, as each iteration demanded laborious scoring and printer setup (Erps et al. Citation2021; Ruberu et al. Citation2021). Taking a larger batch size saved optimisation time but the optimiser became prone to recommending points with low confidence, especially in the early stages of optimisation. On the other hand, the CNN-guided Bayesian optimisation method takes less than 2 min for each iteration. As each iteration time is now only confined to the experimenter’s line printing and capturing time, the optimiser uses an ideal batch size of 1. Therefore, only the points with the highest confidence get searched, achieving a more efficient optimisation. This gives our optimisation framework high potential to be applied to other types of 3D printing. For example, if piston-actuated DIW is used instead of pneumatic, the extrusion multiplier can be optimised instead of pressure (Bonatti et al. Citation2022). For electrohydrodynamic jet printing, applied voltage can be added as the 4th parameter (Wang et al. Citation2021) and it would still achieve the same efficient optimisation.
Through sampling 73 and 49 points for GO and PEDOT:PSS ink, the optimiser has suggested batches of printing parameters that result in uniform lines with relatively narrow line widths. In , the average line widths decrease from (i) to (vi). This is likely due to a combinatory effect of both less ink dispensed out from the nozzle and increased axial tension given on the free-falling inks. This indicates the uniformity optimisation tends to result in thinner printing lines. This is directly related to the supercapacitance of 3D lattice electrodes, since 3D lattice electrodes with higher SA:V can be fabricated with narrow line widths. As shown in a, the uniform and thin ligaments in the ‘optimised result 2' lattices prevent themselves from merging onto neighbouring ligaments and maintain the porous structure. The specific capacitance of the ‘optimised result 2'-(vi) showed 151.0% enhanced results compared to ‘conventional method'-(i), due to an increased SA:V. The enhancement is merely done by the structural enhancement of the electrode, and it would bring the same effect in different electrolytes.
In b, we measured the double layer capacitance of PEDOT:PSS electrode, formed between holes in the PEDOT region and nitrate ions in the PSS region. Through optimising PEDOT:PSS lines, we enhanced the SA:V of lattice structures and showed an increase in the double layer capacitance. However, PEDOT:PSS electrodes can also function as a pseudo capacitor by using electrolytes that reduce on the PEDOT:PSS electrode. Such electrolyte uses the PEDOT:PSS chains as a catalyst (Song et al. Citation2014; Gao et al. Citation2018). As a result, the PEDOT:PSS lattice behaves like a supercapacitor by modulating the hole density, which is compensated with the ions provided from the electrolyte. As in the case of double layer capacitance, surface area is a key factor in determining the pseudo capacitance. The maximised SA:V of the lattice structures will generate more ion reduction on the PEDOT:PSS, increasing the overall capacitance.
Conclusions and further outlook
We introduced a CNN guided Bayesian optimisation framework by which the main parameters of DIW such as applied pressure, nozzle velocity, and standoff distance were optimised to print thin and uniform lines using PEDOT:PSS and GO composite inks with minimum human intervention. In the proposed framework, scoring of the printed filament's line uniformity was fed back to each search points recommended by the Bayesian optimiser. The optimisation loop cycled until no significant improvements on line uniformities were made. The self-guided optimiser’s ability to achieve narrower and more uniform lines than the conventional method has been proven throughout the two demonstrations. Its application on supercapacitors has resulted in 151.0% increase in specific capacitance.
There still exists much room for improvement in our optimisation method. Firstly, as mentioned earlier in , some lines had larger average line widths but lower standard deviation than others. This is because the waviness of the printed lines was not considered in the optimisation. Although the occurrence rate was negligible in our experiments, considering the waviness in the scoring method in the future study will result in more accurate scorings. Secondly, as we had no accessibility to the printer software from our personal computers, the optimisation process remained semi-automatic. Each iteration required a human experimenter to print and capture at the new sampling point. Gaining access to the printer software will allow fully automised, fast-track optimisation. Lastly, although our CNN model tested high accuracy in our experimental environment, it cannot be guaranteed in different environments. We aim to train larger datasets printed and captured in different angles and sizes in the future.
Disclosure statement
No potential conflict of interest was reported by the author(s).
Correction Statement
This article has been corrected with minor changes. These changes do not impact the academic content of the article.
Additional information
Funding
Notes on contributors
JongHyun Kim
JongHyun Kim received his B.S. in Mechanical Engineering from Yonsei University in 2022. Currently, he is an M.S. student in Mechanical Engineering at Yonsei University under the supervision of Prof. WonHyoung Ryu. He is engaged in the research of AI-assisted 3d printing optimisation.
JaeHyoung Yun
JaeHyoung Yun received his B.S in Mechanical Engineering from Yonsei University in 2017. Now he is a Ph.D. student in Mechanical Engineering at Yonsei University under the supervision of Prof. WonHyoung Ryu. His research areas include energy harvesting and electrochemical sensing based on photosynthesis, microfabrication, and energy devices.
Seon Il Kim
Seon Il Kim received his B.S. in Mechanical Engineering from Kyung Hee University in 2017. Currently, he is a Ph.D. candidate in Mechanical Engineering at Yonsei University under the supervision of Prof. WonHyoung Ryu. His research consists of energy harvesting and electrochemical sensing based on photosynthesis, microfabrication, and energy devices.
WonHyoung Ryu
WonHyoung Ryu is a Professor at the Department of Mechanical Engineering, Associate Dean of the Office of Research Affairs, and Director of Yonsei Center for Research Facilities at Yonsei University, South Korea. He received his B.S. at Seoul National University and Ph.D. at Stanford University, USA. His research interests include nanofabrication and 3D printing technologies for medical devices, sensors, and energy harvesting.
References
- Bonatti, Amedeo Franco, Giovanni Vozzi, Chee Kai Chua, and Carmelo De Maria. 2022. “A Deep Learning Quality Control Loop of the Extrusion-Based Bioprinting Process.” International Journal of Bioprinting 8 (4): 307–320.
- Bone, Jennifer M, Christopher M Childs, Aditya Menon, Barnabas Poczos, Adam W Feinberg, Philip R LeDuc, and Newell R Washburn. 2020. “Hierarchical Machine Learning for High-Fidelity 3D Printed Biopolymers.” ACS Biomaterials Science & Engineering 6 (12): 7021–7031.
- Brochu, Eric, Vlad M Cora, and Nando De Freitas. 2010. “A Tutorial on Bayesian Optimization of Expensive Cost Functions, with Application to Active User Modeling and Hierarchical Reinforcement Learning.” arXiv preprint arXiv:1012.2599.
- Cao, Yu, Liangwen Zhou, Xiaoye Wang, Xiangyou Li, and Xiaoyan Zeng. 2009. “MicroPen Direct-Write Deposition of Polyimide.” Microelectronic Engineering 86 (10): 1989–1993.
- Deneault, James R, Jorge Chang, Jay Myung, Daylond Hooper, Andrew Armstrong, Mark Pitt, and Benji Maruyama. 2021. “Toward Autonomous Additive Manufacturing: Bayesian Optimization on a 3D Printer.” MRS Bulletin 46 (7): 566–575.
- Egorov, Vladimir, Umair Gulzar, Yan Zhang, Siobhán Breen, and Colm O'Dwyer. 2020. “Evolution of 3D Printing Methods and Materials for Electrochemical Energy Storage.” Advanced Materials 32 (29): 2000556.
- Erps, Timothy, Michael Foshey, Mina Konaković Luković, Wan Shou, Hanns Hagen Goetzke, Herve Dietsch, Klaus Stoll, Bernhard von Vacano, and Wojciech Matusik. 2021. “Accelerated Discovery of 3D Printing Materials Using Data-Driven Multiobjective Optimization.” Science Advances 7 (42): eabf7435.
- Gao, Xing, Lei Zu, Xiaomin Cai, Ce Li, Huiqin Lian, Yang Liu, Xiaodong Wang, and Xiuguo Cui. 2018. “High Performance of Supercapacitor from Pedot: Pss Electrode and Redox Iodide ion Electrolyte.” Nanomaterials 8 (5): 335.
- Goh, Guo Liang, Haining Zhang, Guo Dong Goh, Wai Yee Yeong, and Tzyy Haur Chong. 2022. “Multi-objective Optimization of Intense Pulsed Light Sintering Process for Aerosol jet Printed Thin Film.” Materials Science in Additive Manufacturing 1 (2): 10.
- Jiang, Yanqiu, Zhen Xu, Tieqi Huang, Yingjun Liu, Fan Guo, Jiabin Xi, Weiwei Gao, and Chao Gao. 2018. “Direct 3D Printing of Ultralight Graphene Oxide Aerogel Microlattices.” Advanced Functional Materials 28 (16): 1707024.
- Jin, Yifei, Danyang Zhao, and Yong Huang. 2018. “Study of Extrudability and Standoff Distance Effect During Nanoclay-Enabled Direct Printing.” Bio-Design and Manufacturing 1 (2): 123–134.
- Kandasamy, Kirthevasan, Willie Neiswanger, Jeff Schneider, Barnabas Poczos, and Eric P Xing. 2018. “Neural Architecture Search with Bayesian Optimisation and Optimal Transport.” Advances in Neural Information Processing Systems 31: 2020–2029.
- Li, Bo, Patrick A Clark, and K. H. Church. 2007. “Robust Direct-Write Dispensing Tool and Solutions for Micro/Meso-Scale Manufacturing and Packaging.” Paper presented at the International Manufacturing Science and Engineering Conference.
- Li, Xiran, Hongpeng Li, Xiangqian Fan, Xinlei Shi, and Jiajie Liang. 2020. “Micro-Supercapacitors: 3d-Printed Stretchable Micro-Supercapacitor with Remarkable Areal Performance (Adv. Energy Mater. 14/2020).” Advanced Energy Materials 10 (14): 2070064.
- Li, Hongpeng, and Jiajie Liang. 2020. “Recent Development of Printed Micro-Supercapacitors: Printable Materials,: Printing Technologies, and Perspectives.” Advanced Materials 32 (3): 1805864.
- Li, Minggan, Xiaoyu Tian, David J Schreyer, and Xiongbiao Chen. 2011. “Effect of Needle Geometry on Flow Rate and Cell Damage in the Dispensing-Based Biofabrication Process.” Biotechnology Progress 27 (6): 1777–1784.
- Li, Mengrui, Shiqiang Zhou, Lukuan Cheng, Funian Mo, Lina Chen, Suzhu Yu, and Jun Wei. 2022. “3D Printed Supercapacitor: Techniques, Materials, Designs, and Applications.” Advanced Functional Materials, 2208034.
- Lu, Baoyang, Hyunwoo Yuk, Shaoting Lin, Nannan Jian, Kai Qu, Jingkun Xu, and Xuanhe Zhao. 2019. “Pure PEDOT:Pss hydrogels.” Nature Communications 10 (1): 1043. doi:10.1038/s41467-019-09003-5.
- Menon, Aditya, Barnabás Póczos, Adam W Feinberg, and Newell R Washburn. 2019. “Optimization of Silicone 3D Printing with Hierarchical Machine Learning.” 3D Printing and Additive Manufacturing 6 (4): 181–189.
- Middleman, Stanley. 1995. Modeling Axisymmetric Flows: Dynamics of Films, Jets, and Drops. San Diego: Academic Press.
- Monisha, Monisha, and Shweta Agarwala. 2022. “Biodegradable Materials: Foundation of Transient and Sustainable Electronics.” Materials Science in Additive Manufacturing 1 (3): 15.
- Ng, Wei Long, Alvin Chan, Yew Soon Ong, and Chee Kai Chua. 2020. “Deep Learning for Fabrication and Maturation of 3D Bioprinted Tissues and Organs.” Virtual and Physical Prototyping 15 (3): 340–358.
- Park, Young-Geun, Insik Yun, Won Gi Chung, Wonjung Park, Dong Ha Lee, and Jang-Ung Park. 2022. “High-Resolution 3D Printing for Electronics.” Advanced Science 9 (8): 2270046.
- Rao, C Hanumanth, Kothuru Avinash, B. K. S. V. L. Varaprasad, and Sanket Goel. 2022. “A Review on Printed Electronics with Digital 3D Printing: Fabrication Techniques, Materials, Challenges and Future Opportunities.” Journal of Electronic Materials 51: 2747–2765.
- Rasmussen, Carl Edward, and Christopher KI Williams. 2006. Gaussian Processes for Machine Learning. Cambridge, MA: MIT Press.
- Ruberu, Kalani, Manisha Senadeera, Santu Rana, Sunil Gupta, Johnson Chung, Zhilian Yue, Svetha Venkatesh, and Gordon Wallace. 2021. “Coupling Machine Learning with 3D Bioprinting to Fast Track Optimisation of Extrusion Printing.” Applied Materials Today 22: 100914.
- Song, Dandan, Meicheng Li, Yingfeng Li, Xing Zhao, Bing Jiang, and Yongjian Jiang. 2014. “Highly Transparent and Efficient Counter Electrode Using SiO2/PEDOT–PSS Composite for Bifacial dye-Sensitized Solar Cells.” ACS Applied Materials & Interfaces 6 (10): 7126–7132.
- Suntornnond, Ratima, Edgar Yong Sheng Tan, Jia An, and Chee Kai Chua. 2016. “A Mathematical Model on the Resolution of Extrusion Bioprinting for the Development of new Bioinks.” Materials 9 (9): 756.
- Tan, Hong Wei, Yu Ying, Clarrisa Choong, Che Nan Kuo, Hong Yee Low, and Chee Kai Chua. 2022. “3D Printed Electronics: Processes, Materials and Future Trends.” Progress in Materials Science 127: 100945.
- Udofia, Edidiong Nseowo, and Wenchao Zhou. 2018. “Microextrusion Based 3D Printing–a Review.” Paper presented at the 2018 International Solid Freeform Fabrication Symposium.
- Wang, Jiwen, and Leon L Shaw. 2005. “Rheological and Extrusion Behavior of Dental Porcelain Slurries for Rapid Prototyping Applications.” Materials Science and Engineering: A 397 (1-2): 314–321.
- Wang, Chengcheng, X. P. Tan, S. B. Tor, and C. S. Lim. 2020. “Machine Learning in Additive Manufacturing: State-of-the-art and Perspectives.” Additive Manufacturing 36: 101538.
- Wang, Zhi, Guangming Zhang, Hui Huang, Lei Qian, Xiaoling Liu, and Hongbo Lan. 2021. “The Self-Induced Electric-Field-Driven jet Printing for Fabricating Ultrafine Silver Grid Transparent Electrode.” Virtual and Physical Prototyping 16 (1): 113–123.
- Yao, Bin, Huarong Peng, Haozhe Zhang, Junzhe Kang, Cheng Zhu, Gerardo Delgado, Dana Byrne, Soren Faulkner, Megan Freyman, and Xihong Lu. 2021. “Printing Porous Carbon Aerogels for low Temperature Supercapacitors.” Nano Letters 21 (9): 3731–3737.
- Yu, Chunling, and Jingchao Jiang. 2020. “A Perspective on Using Machine Learning in 3D Bioprinting.” International Journal of Bioprinting 6: 1.
- Yuk, Hyunwoo, Baoyang Lu, Shen Lin, Kai Qu, Jingkun Xu, Jianhong Luo, and Xuanhe Zhao. 2020. “3D Printing of Conducting Polymers.” Nature Communications 11 (1): 1–8.
- Yuk, Hyunwoo, and Xuanhe Zhao. 2018. “A new 3D Printing Strategy by Harnessing Deformation,: Instability, and Fracture of Viscoelastic Inks.” Advanced Materials 30 (6): 1704028.
- Zong, Wei, Yue Ouyang, Yue-E Miao, Tianxi Liu, and Feili Lai. 2022. “Recent Advance and Perspective of 3D Printed Micro-Supercapacitor: From Design to Smart Integrated Devices.” Chemical Communications 58 (13): 2075–2095.