
 ?Mathematical formulae have been encoded as MathML and are displayed in this HTML version using MathJax in order to improve their display. Uncheck the box to turn MathJax off. This feature requires Javascript. Click on a formula to zoom.
ABSTRACT
Although additive manufacturing (AM) is a net/near-net forming process, significant deviations may occur between the finally manufactured product and the designed object. This study is inspired by the deposition errors in a typical closed-contour structure manufactured via laser-directed energy deposition (DED). A series of experiments were carried out and a multi-physics mechanistic model was developed to reveal the origins and the spatiotemporal variations of the errors in representative processes. The results demonstrate that the irregularity of the deposition can be initiated by the liquid metal flow in the molten pool driven by forces including the recoil pressure and surface tension. The deviations are subsequently aggravated due to the inheritance between layers. Supported by the revealed underlying mechanisms, solution strategies including layer-wise dynamic compensations are thus proposed. The novel scientific findings can be insightful to researches for other metal AM processes and structures considering the universality of the uncovered mechanisms.
1. Introduction
Although additive manufacturing (AM) is a net/near-net forming process, significant deviations may occur between the finally manufactured product and the designed object (DebRoy et al. Citation2018). The deviation may deteriorate the formation accuracies of the product or even lead to the failure of the complete manufacturing process. The deviation is closely related to the nature of AM, that is, the heating, melting, solidification, and cooling processes. The raw powder feedstock materials need to undergo the above process via the molten pool to be transformed into the deposited metal (DebRoy et al. Citation2021). However, the challenge is that the molten pool is not a regular geometric unit like LEGO brick, but a complex structure with various irregular geometries (Cunningham et al. Citation2019; Wolff et al. Citation2021; Chen, Clark, Collins, et al. Citation2021). Thus, the varying features of the molten pool largely determine the geometrical accuracies of the final AM components (Svetlizky et al. Citation2021).
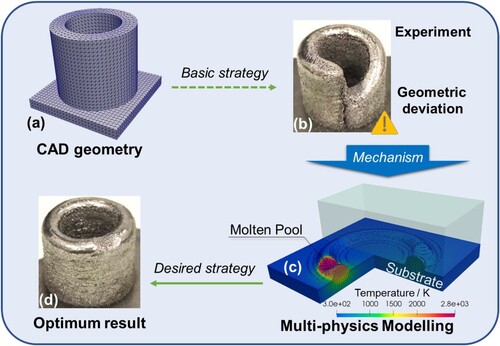
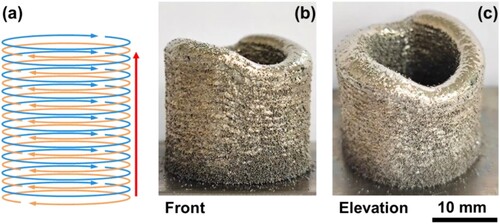
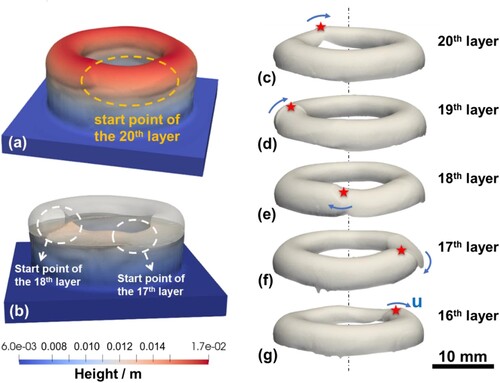
This study is inspired by the significant printing deviations of the typical closed-contour hollow cylinders with unexpected outcomes against the designed object, as shown in (a,b). The significant deviation in the final part geometry implies complex physical processes may involve in the layer-wise printing procedures and thus in-depth researches are needed. It is known that the evolution of the geometrical deviations correlates with the progressive AM process from the moving molten pool to the deposited layers and eventually the build (Wei et al. Citation2021; Liu et al. Citation2020). The features and variations of the molten pool largely affect the characteristics of its immediate product, i.e. the geometrical inaccuracies of the deposited layer (Gu et al. Citation2021; Spranger et al. Citation2018). Furthermore, the interactions of the layer features may lead to the accumulation or compensation of geometrical irregularities in the final part during the layer-wise AM processes (Wei, Liu, et al. Citation2021; Liu et al. Citation2020). The interdependencies between the varying molten pools and progressive layers have been confirmed in several studies. For example, an extra laser beam was introduced in the process of wire arc AM to stabilise the molten pool in order to alleviate the fluctuation of the component surface (Näsström, Brückner, and Kaplan Citation2018). The adjusted laser power and mass rate can maintain the energy in the molten pool, and a uniform multi-layer width was obtained when depositing thin walls (Li et al. Citation2021). Moreover, triadic correlations have been found among the molten pool shape, hatch spacing and the layer number (Jeon et al. Citation2021). However, until now there are few researches explaining essentially the spatiotemporal variations of the molten pool during the entire printing process, and the resultant influences on the geometrical accuracies of closed-contour components.
Figure 1. Schematics of the geometrical deviation between the designed and the additively manufactured components.
In order to uncover the formation mechanisms and propose effective controlling strategies for the printing inaccuracies, it would be necessary to adopt both critical experiments (McCann et al. Citation2021; Zhang, Liu, and Shin Citation2019) and phenomenological models (Wei et al. Citation2021; Gunasegaram et al. Citation2021). The transient process can be observed to understand the varying features of the intermediate process via experiments and in situ monitoring. For example, by recording the in-situ surface temperature with an infrared pyrometer and conducting post-mortem analysis, a realistic thermal gradient of the molten pool was attained to explain the formation of radial columnar grains in the transverse section of the sample (Bermingham et al. Citation2019). The changing temperature fields can be obtained in real time with an infrared thermal camera and processed with machine learning algorithms during laser DED (Fan et al. Citation2020; Zhang, Liu, and Wu Citation2021). The molten pool region during the laser DED process was monitored via a high-speed camera and the correlations were built among molten pool area, laser power and scanning speed (Mi et al. Citation2021). Moreover, the saddle-like molten pool shape was captured during laser DED via Synchrotron X-ray Imaging (Chen, Clark, Collins, et al. Citation2021; Chen, Clark, Sinclair, et al. Citation2021). However, it is rather challenging to capture the characteristics such as the temperature and liquid metal flow fields as well as the driving force fields in the moving molten pool during the multi-layer printing processes.
Alternatively, mechanistic models can help to overcome the above difficulties and to reveal the evolution mechanisms of the molten pool and the resultant printed layers via solving computational fluid dynamic (CFD) equations (Wei, Mukherjee, et al. Citation2021; Wei, Liu, et al. Citation2021). For instance, Shin et al. proposed comprehensive laser DED models including the powder delivery and molten pool model for multi-layer deposition (Shin et al. Citation2018). Bayat et al. developed a multi-physics model based on Flow-3D and revealed the correlations between the height and width of the molten pool (Bayat, Nadimpalli, et al. Citation2021; Bayat, Dong, et al. Citation2021). Wolff et al. developed a computational thermo-fluid dynamics model to study the dilution of different materials considering the temperature and velocity fields of the molten pool (Wolff et al. Citation2019). Li et al. proposed a CFD model to study the molten pool behaviours in extreme conditions with various gravity values and mass feed rates (Gu and Li Citation2019; Sun, Guo, and Li Citation2020). Mukherjee et al. computed the multi-layer deposition process during laser DED of a steel part and the resultant variations of the hardness with the progressive thermal cycles (Mukherjee et al. Citation2021). Wei et al. demonstrated that the printed geometries are largely affected by the backward flow of the molten metal and the resultant uneven straight layers during printing using linear scanning strategies (Wei et al. Citation2021; Liu et al. Citation2020). Ogino et al. showed that the scanning direction was important for obtaining height-wise uniform deposition in the case of cylindrical shape build (Ogino, Asai, and Hirata Citation2018). However, considering the specific feature of the closed-contour structure, the interdependencies of the molten pool and the depositing layer would be intricated for various printing strategies, as indicated in (c,d), leaving a major gap between the unknown critical factors and the current progresses in the metal AM field.
Targeting at the unexpected manufacturing deviations against the original digital model, a series of exemplary cases are explored to demonstrate the issues for laser DED using closed-contour hollow cylinders as exemplary cases in this work. Particularly, a phenomenological model matching with the experiments is developed to help uncover the underlying mechanisms considering multi-scale factors including: (1) the transient temperature field, the flow pattern and the driving forces of the liquid metal in the molten pool; (2) the spatiotemporal variation of the deposited layers via specific decoupling approaches; (3) the variations of the macroscopic build geometries printed using specific strategies. Supported by the uncovered mechanism, feasible solutions are proposed to control the printing accuracies such as designated layer-wise offset of the laser starting positions. Considering the universality of underlying mechanisms, the findings and philosophies of this research may also be inspiring to other AM processes using various structures and materials.
2. Methodology
2.1. Experiment
In the DED experiment, cylindric objects were deposited on a 10-mm-thick and 100 × 100 mm2 Ti–6Al–4V substrate, which was polished and cleaned with ethanol to remove the oxide, grease and other impurities. Ti–6Al–4V powders were used for the feedstock material which were provided by Avimetal, with chemical compositions listed in . The particle sizes are between 45 and 105 μm and the average particle size of the Gauss distribution is approximately 70 μm. Additionally, the powders were heated for an hour in a drying oven for dehumidification to improve the delivery fluidity.
Table 1. Chemical compositions of Ti–6Al–4V powders (wt.%).
A series of experimental cases were designed to explore the origins of striking deviations between the manufacturing results and the desired object. Inspired by the influences of layer-wise error accumulation and compensation, variable layer scanning strategies were examined on closed-contour hollow cylinders with different layers. As listed in , the scanning direction and the initial position of each layer were modified, with a single track in each layer. In addition, to inspect the geometry of the historical layer, transitional experiments were conducted for critical cases. Specifically, the extra copies of the unidirectional pinned-start hollow cylinder were fabricated with 5, 10, 20, 30 layers. The 20-layer duplicates were fabricated for 67° and 180° hollow cylinders as well. The inner and outer diameters of the cylinder are expected to be 17 and 21 mm, respectively. Moreover, the ideal height is 20 mm for the 40-layer deposit, with a vertical step of 0.5 mm for each layer.
Table 2. Scanning strategies and process parameters of all experimental samples.
The experiments were operated on the LMD-8060 platform (a hermetic Siemens CNC machine for laser DED developed by Nanjing Zhongke Raycham Laser Technology) using a 4400 W diode laser system, with a range of wavelength between 800 and 1070 nm (supplied by Laserline GmbH, Germany). The nominal diameter of the laser beam was 4.0 mm. The inert gas of Argon was used to prevent the oxidation of Ti–6Al–4V powders, by limiting the oxygen level below 100 ppm inside the hermetic forming chamber. In addition, Argon served as the shielding gas to deliver the powders into the molten pool, with a volume of 5 L/min. To avoid the interference introduced by different initial temperatures (Abe, Kaneko, and Sasahara Citation2020), new hollow cylinders would not be deposited at once after the previous deposition, until the substrate was cooled down to ambient temperature.
2.2. Mechanistic model
A multi-physics mechanistic model has been developed to reveal the unknown complex processes involved in various experimental cases. The model numerically solves conservation equations of mass, momentum and energy in a three-dimensional domain. Meantime, the Volume of Fluid (VOF) equation is solved to compute the freeform interface of the molten pool between the gas and the metal phases. The delivery of powder particles is incorporated in an implicit form in this model and is generated at the molten pool surface within the radius of the powder beam, which can be expressed in the following equations:
(1)
(1)
(2)
(2)
(3)
(3) where
is the effective mass input of the unit area, η is the catchment efficiency of powder,
is the feed rate of the feedstock material.
in Equation (2) is the effective area of mass absorption. H(r) is explained in Equation (3) as a Heaviside function to model the boundary of the powder beam, r is the distance to the mass/heat source axis, and Ω is the melt region. The heat input is divided into two parts: one part is absorbed by the molten pool and substrate directly, with energy density distributed as a Gaussian heat source, which is presented in the following equation:
(4)
(4) where
is the surface heat flux distribution, f is the power distribution factor, P is the total power, ε is the energy absorptivity, and
is the radius of laser spot. The rest part of heat input is involved in the molten pool indirectly by absorbing the energy of the powder particles. The equation is given below:
(5)
(5) where T,
,
,
are actual temperature, ambient temperature, solidus temperature and liquidus temperature, respectively;
and
are the specific heat capacity of solid and liquid;
and
are specific latent heat of fusion and vaporisation. Besides, for the purpose of tracking the free surface of the molten pool, the VOF method is utilised in Equation (6) to track and distinguish the phase boundaries by the volume ratio of phases α (Wei, Liu, et al. Citation2020):
(6)
(6)
Moreover, fields such as the velocity and temperature are acquired by solving the following governing equations (Wei, Mukherjee, et al. Citation2021):
(7)
(7)
Equation (7) is the continuity equation, where ρ, t, U and SmV denote respectively mass density, time, velocity and volumetric mass increment in a unit. SmV derives from the mass addition into the molten pool.
(8)
(8)
Equation (8) is the momentum conservation equation, where p signifies pressure, μ signifies dynamic viscosity, Frecoil, Fma, Ftension, Fbuoyancy are recoil force, Marangoni force, surface tension and buoyancy force, respectively.
(9)
(9)
Equation (9) is the energy conservation equation. Herein, κ is the thermal conductivity. The variable ST denotes the thermal source item, where a coupled power absorption from the molten pool and powders is taken into account. The variable Qloss includes the heat dissipation by means of conductivity, convection and radiation. More details of the mechanistic model are available in our previous articles (Wei, Liu, et al. Citation2020; Liu et al. Citation2020; Wei et al. Citation2015; Wei, Liu, et al. Citation2021; Wei, Cao, et al. Citation2020).
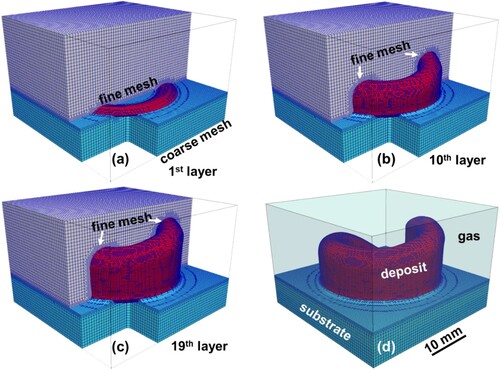
The model is established in OpenFOAM with a computational domain of 30 mm × 20 mm × 30 mm, the initial temperature of which was set as 25°C, and with mesh precision of 0.25 mm. The temperature gradient and the velocity are 0 at the boundary of the computational domain. The specific process parameters are set as follows: the power of laser is 1200 W, the scanning speed is 10 mm/s, the absorption rate of laser is 0.8, the radius of the laser spot is 1.8 mm, the powder feed rate is 0.16 g/s and the catchment efficiency of powders is 0.65. In terms of time, the model is launched with a minimum timestep of 10−6 s. The values of the laser absorption rate and powder catchment efficiency were determined via testing a range of different cases until the expected track width, layer thickness and final shape agreed well with the experimental results. The effective diameter of the laser was smaller than its nominal value due to the possible shielding effect of the powder stream. To speed up the computational process, this work exploits the adaptive mesh refinement method to enhance the computational efficiency by refining the meshes of the molten pool and the metal phase interface, as presented in . The computational time was cut from nearly a week to around 60 h on a 64-core AMD workstation for the modelling of a 20-layer hollow cylinder case.
Figure 2. Schematics of adaptive refinement mesh. (a–c) Mesh refinement from the 1st layer to the 19th layer. (d) Transparent view of the overall 20-layer hollow cylinder.
3. Results and discussion
3.1. Significant geometrical deviations
Guided by the philosophy of layer-wise printing for AM, the basic scanning strategy would be first explored, i.e. unidirectional printing with a fixed starting point for each layer, expecting a good consistency between the designed model and the experimental results. Nevertheless, it turned out with severe deviations against the designed object. The specific issues demonstrated in the 3D build, the underlying mechanisms correlating with the molten pool and progressive layers will be described subsequently.
3.1.1. Height variations in the laser DED components
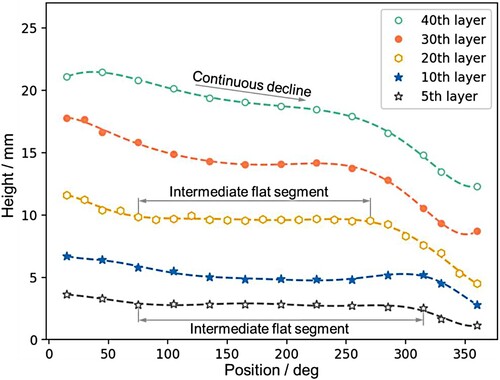
and exhibit the experimental results printed layer-by-layer using a unidirectional clockwise scanning strategy. As shown in (a,f) for the 5th layer, the error accumulation was not obvious except for a faint deficiency of height at the layer rear. For the following layers in (b–e,g–j), the deviation emerges and develops gradually at the front, which is supported in as the leading curves of height grew progressively over the rear curves. On the other side, the growth of the rear part descended and formed a slope. Finally, at the 40th layer, the greatest gap in height amounted to 9.38 mm, which was strikingly larger than 2.46 mm at the 5th layer. As for the middle part, it can be known from that the flat surface has been completely replaced by a spirally decreasing slope at the 40th layer, which indicates an extension of deviation from the joint to the middle. Meanwhile, since the peak and the lowest point appear at the same joint point, an abrupt gap has arisen in height and got severer as the hollow cylinder built up to form a cliff-liked structure.
Figure 3. Geometrical variations of the unidirectional hollow cylinders. (a–e) Front view. (f–j) Side view. (k) The virtual paths of the CNC machine.
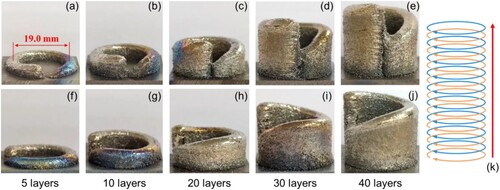
Figure 4. Circular height measured from the 5th, 10th, 20th, 30th and 40th layer of hollow cylinder.
In brief, the attempt of depositing pinned-start unidirectional hollow cylinders has been proven not feasible due to the issues of humping front, descending rear, varying gradient and the discontinuity at the joint. Since the emergence of deviation originates from the point-curve-slice-body AM process, the following part inspects the abnormal shape layer by layer, for a better understanding of the deviation mechanism of the build.
3.1.2. Error analysis via decoupled layers
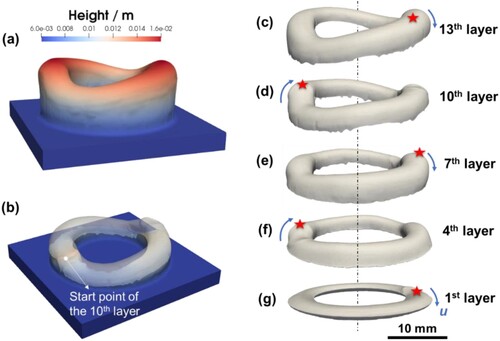
To reveal the developing processes of the deviations, the printing processes of a 20-layer sample are simulated via the numerical model (see Animation 1 in the Supplementary Material), with the decoupled layer geometries shown in (a). The 1st layer displayed good height uniformity because half of the layer was embedded in the substrate to support the molten pool and the error was not amplified by accumulation. As the hollow cylinder grew, the 4th layer turned out with a hump and a slope due to error accumulation. The inclination of layer bottom at the front was probably inherited from the humping front. As the component built up, the vertical deviation was aggravated and the rear slope was developing gradually from the tip of track to nearly a third of the circular path. The assemblage of the total 20 layers as well as the in-situ shape and position of the 20th layer are displayed in (b–c), respectively, which illustrates the surface and interior features of a layer.
Figure 5. (a) Decoupled layer profiles of the 20-layer hollow cylinder printed using unidirectional clockwise scanning strategy. (b) Overall view of the 20-layer hollow cylinder. (c) Transparent presentation of the bottom characteristics of the 20th layer.
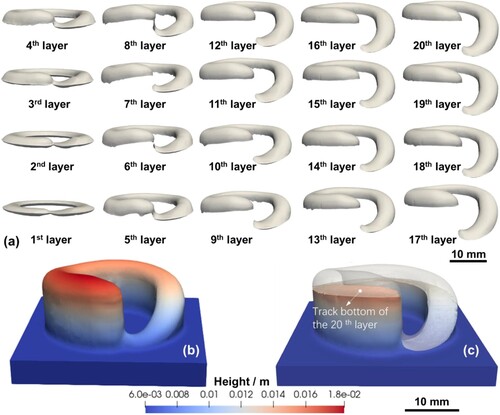
According to the model, the maximum height increases from 3.62 mm (measurement: 3.75 mm, accuracy: 96.4%) for the 5th layer to 11.60 mm (measurement: 11.41 mm, accuracy: 98.3%) for the 20th layer. With regard to the width, the predicted values at the 5th and 20th layers are 4.01 and 4.92 mm, respectively (measurements: 4.07 and 5.06 mm), with an accuracy of 98.5% and 97.2%, respectively. Based on the deviation viewed from slice/curve, the following discussion then focuses on the origin of error in the scope of the molten pool.
3.1.3. Investigation into the origin of deviation
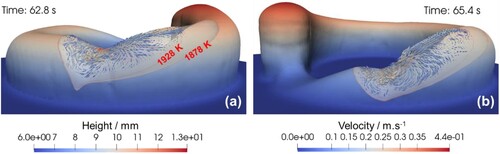
The transient profiles, the temperature and velocity fields, and the driving forces of the liquid metal in the molten pool are further explored using the multi-physics model. For example, (a) displays the state of a typical molten pool in the middle of the layer. In shape, the molten pool appears in a saddle-like structure which is typically found at multi-layer deposition due to the lack of side support (Chen, Clark, Sinclair, et al. Citation2021; Liu et al. Citation2020). As for the velocity, the surface flow rushes drastically backward with a velocity range of 0–0.44 m.s−1, which is close to that of the moving pore, i.e. 0.11–1.51 m.s−1, observed from the synchrotron X-ray imaging (Wolff et al. Citation2021). Since the experimental facts manifest that the middle part of each layer is relatively uniform, and the shape of molten pool observed in the model displays a good consistency, the molten pool in the middle part is treated as a quasi-steady state.
Figure 6. The presentation of molten pool and surface flow from different perspectives and stages. (a) 62.8 s, (b) 65.4 s.
The geometrical characteristics of the molten pool vary with the AM printing strategies and boundary conditions (Spranger et al. Citation2018). The molten pool of laser DED is a localised high-temperature object approaching the boiling temperature of the feedstock material, accompanied by drastic flows of the liquid metal. The fluid flow is driven by forces including the recoil pressure, surface tension, Marangoni force and gravity, which vary with the temperature distributions and particular geometries of the molten pool (DebRoy et al. Citation2018). The uneven distribution of the liquid metal in the molten pool and the coupled fast solidification may cause uneven geometries of the resultant solid deposit. It is worth noting that deformation or fracture induced by residual stresses during the layer-wise printing processes affects the geometrical accuracies as well (Liang et al. Citation2020; Machirori et al. Citation2021; Cao et al. Citation2021). However, the origin is different since residual stresses occur in the solid region of the printed component, while the geometrical deviations focused on in this study originate from the specific distribution patterns of the liquid metal in the molten pool.
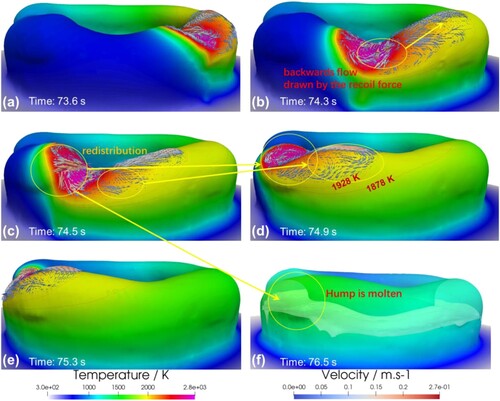
Compared with the quasi-steady shape of typical molten pool, evident deviation emerges from the molten pool at the front of layer. As shown in , the layer front has evidently bulked up compared with the molten pool in the middle of the layer and the extreme height difference of pool surface exceeds 2 mm. In this case, the redundant fluid cannot be transferred anywhere but stocked at the front, while the front pool is solidifying quickly with a maximum cooling rate of almost 20,000 K/s (predicted by the model). Besides, under the action of surface tension, the molten pool is reshaped into a large semi-ellipsoid.
Figure 7. Critical variables of the molten pool during the printing of the 10th layer. (a) Transparent view of the molten pool and the correlated humping phenomenon occurring at the beginning region of the current layer. (b) Temperature and liquid metal flow fields. (c) Recoil force normal to the surface of the molten pool. (d) Surface tension normal to the surface of the molten pool. (e) Marangoni Force tangential to the surface of the molten pool.
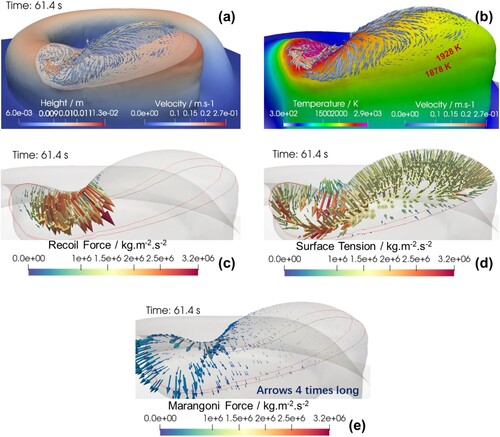
Although the movement and dynamics inside the molten pool is complicated, it is highly possible that effects such as recoil forces and surface tension have played a significant role in affecting the behaviour of the molten pool. For example, in (c), the recoil force points downwards in the normal direction at the front of molten pool. In (a), correspondingly, the fluid on the surface of the high-temperature core moves downwards, and the backward-flowing fluid is guessed most likely to be driven by the hydraulic pressure caused by recoil force, which results in a molten pool with a depressed front and a piling-up rear. In (d), since the effect of surface tension is to reduce the overall area of the pool, the peripheral area is pushed down while the concave region is pulled up. The compromise of recoil force and surface tension contributes to a dynamic balance of the sinking-core and humping-rear pool geometry. As the recoil force advances following the laser beam, the region which was affected by recoil force, is soon dominated by surface tension and rebounds to a semi-ellipsoid in an elongated melt area.
(e) shows the distribution of the Marangoni force. In the molten pool of Ti–6Al–4V, the Marangoni force is oriented to the peripheral region as the surface tension coefficient is negative and the magnitude is closely related to the temperature gradient (Wei, Mukherjee, et al. Citation2021; DebRoy and David Citation1995; Wu et al. Citation2021). As shown in (e), the magnitude of the Marangoni force is far smaller than others, with a greatest value of 7 × 10⁵ N·m−3, that is 700 Pa, as the gradient of liquid phase in the model is about 1 × 10³ m−1. In contrast, the magnitude of the recoil pressure is on the order of 3 × 10³ Pa for the condition presented in (c). It is also supported by the study of laser powder bed fusion that the magnitude of maximum thermocapillary force (Marangoni force) is 1 × 10³ Pa, which is a hundred times smaller than the magnitude of recoil force in a keyhole mode (Kouraytem et al. Citation2019; Zhao, Shi, et al. Citation2022). Besides, it can be inferred from (b) that the Marangoni flow is more intense at the front rather than at the rear because the temperature gradient is greater at the front. Apart from the layer front, the slope of the rear is also susceptible to the abnormal pool shape. In (b), the height of downstream surface in the molten pool is 3 mm lower than the upstream surface, which is ascribed to the recoil force and the inclined bottom. Besides, once the molten pool arrives at the slope part, the local height gap is enlarged and makes the gradient of the pool surface closer to the slope. As the hollow cylinder builds up, the transition from flat to slope develops gradually, which explains the extension of the slope.
In brief, it is found in this subsection that the major driving forces of the recoil pressure, the surface tension and the Marangoni force largely determine the non-uniform distribution of the liquid metal in the molten pool. Meantime, the fast solidification of the liquid metal stacked at the beginning parts of the layers yields the prominent head, which is further accumulated during the layer-wise printing processes.
3.1.4. Bidirectional scanning
The results of the unidirectional printing show that the seemingly easy formation of hollow cylinder ended in a poor accuracy because of the molten pool distortion at the front and the rear of layer. Considering the hump and gouge characteristics of deviation, a bidirectional strategy was utilised, in the hope that the complementarity of humping and gouging can compensate for the height differences (Wei, Liu, et al. Citation2021; Ortega et al. Citation2019).
It can be observed from the experimental results in that the hollow cylinder using a bidirectional strategy does not show significant deviation and has good symmetry in height. Besides, the error did not accumulate as the hollow cylinder built up from 20 to 40 layers, with the error span of height limited to 1.78 mm. Although the bidirectional strategy has narrowed the gap in height, another problem of discontinuity arises at the joint, between the altering starting points. The occurrence of the ‘scar’, as presented in (b,c), is unfavourable to the uniformity of cylinder width, which requires more allowance and increases the workload for post-processing such as milling and grinding (Feldhausen et al. Citation2022; Malakizadi et al. Citation2022); worse still, it reduces the strength of parts, because the tip of surface ‘scar’ is a potential cracking source under dynamic load. Besides, the ‘scar’ covered by unmelt powders implies the existence of defects such as pores (Zhao et al. Citation2021), and lack of fusion with sintered powder particles (Sinclair et al. Citation2022).
Figure 8. Build features of the hollow cylinder using bidirectional scanning strategy. (a) Virtual paths of the CNC machine. (b) Printed results of the 20-layer build. (c) Printed results of the 40-layer build.
3.2. Mechanisms and optimum strategy
The results above indicate that the geometrical accuracy suffers from the starting points of the depositing layers. When these points are fixed at a specific position, the severe deviation is incurred such as vertical unevenness and width discontinuity. Thus, it is rational to introduce various patterns of starting points and to examine the influences on the geometrical accuracies of the multi-layer builds.
3.2.1. Selection of the layer-wise offset angles
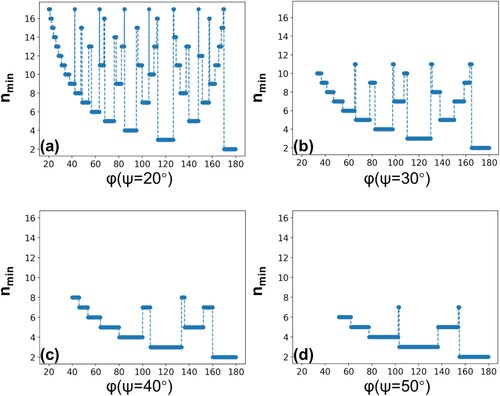
Since the error usually originates from the starting point, a multi-start strategy is proposed to divide the deviation into several parts so as to alleviate the local error accumulation. A linear programming method is employed here to find a strategy which rotates the maximum times of angle φ before repeating a previous position within ±ψ. It is assumed that the offset angle ranges from 20° to 180° because it takes many times for an angle below 20° to add up to 360°, which may aggravate the unilateral deviation and influence the regulation of negative defocus. Besides, 180–340° minus 360° is equal to −180° to −20°, which is equivalent to 20–180° in the opposite direction. Then, the starting angle after the ith offset is noted as φi, and it is not until the (i + n)th offset that appears another point within the neighbourhood of φi ± ψ. The position after the (i + n)th offset is noted as φi+n = φi + nφ. Consequently, the inequalities of integer linear programming can be expressed as follows:
(10)
(10)
The complete expressions are:
(11)
(11)
(12)
(12)
displays the necessary times of offset nmin for repeating the previous starting point within ±ψ. When ψ equals 20°, the 17-time-non-repeat intervals are frequently distributed for φ from 20° to 180°. Note that 360° is divisible by angles such as 180°, 120°, 90° and the corresponding function values of these factors are locally lowest and take a long width. Especially, the greater factor owns a wider unilateral neighbourhood and turns out with smaller times of non-repetition rotation. Except for the offset angle, the depositing accuracy is related to other factors, such as the length of gouge and the perimeter of the circular path, which determine the scope of interference ψ. Take this work as an example, since the radius of circle is 9.5 mm, the perimeter equals 59.7 mm. The length of the gouge is measured from the component to be 5 mm. Therefore, errors accumulate easily within ψ = ±30°. According to (b), the 11-time-non-repeat ranges emerge around 65.6°, 98.0°, 130.6° and 164.2°, which help avoid severe error accumulation. However, the non-repeat numbers corresponding with factors of 360° (120°, 90° and 72°) turn out to be lower than those of other offset angles in the range, which implies a higher possibility of interference and poorer forming accuracy.
Figure 9. The minimum times of offset φ to repeat a starting point within ±ψ.
3.2.2. Validation of typical offset angles
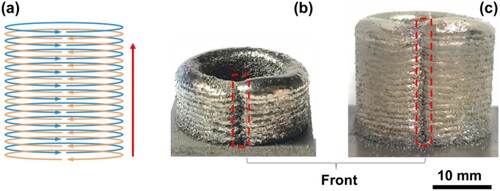
According to the above theory, the offset of 180° will incur the severest error accumulation among multi-start strategies. Thus, a dual-start strategy experiment was firstly conducted and evaluated in .
Figure 10. Build features of the hollow cylinder using dual-start unidirectional clockwise scanning strategy. (a) Virtual paths of the CNC machine. (b) and (c) Printed results of the 40-layer build.
By the 40th layer, the height deviation of the dual-start strategy (180°) is 3.34 mm, which is a third of the accumulated errors of the hollow cylinder printed using a unidirectional scanning strategy (9.38 mm, as shown in ) but double that of the hollow cylinder printed using bidirectional scanning strategy (1.78 mm, as shown in ). Besides, as the laser spot passes by the joint point, the laser has remelted the non-continuous upper surface to wipe out the ‘scar’. In the model, exhibits that the unevenness of the surface and the layer bottom appears at two starting points (see Animation 2 in the Supplementary Material), which is similar to the pinned-start strategy, and the vertical deviation undergoes a sequent accumulation from uniformity to fluctuation, as presented in (c–g). Anyway, as illustrated in (b), the joint of the layer is not separated but connected to improve the interior and the surface continuity, which offers an inspiration to further decrease the deviation by augmenting the number of starting points.
Figure 11. Computed results of the hollow cylinder using dual-start unidirectional clockwise scanning strategy. (a) Overall view of the 20th layer build. (b) The features of the bottom of the 10th layer over the build. (c–f) Decoupled profiles of selected layers. The red stars mark the starting point of each layer.
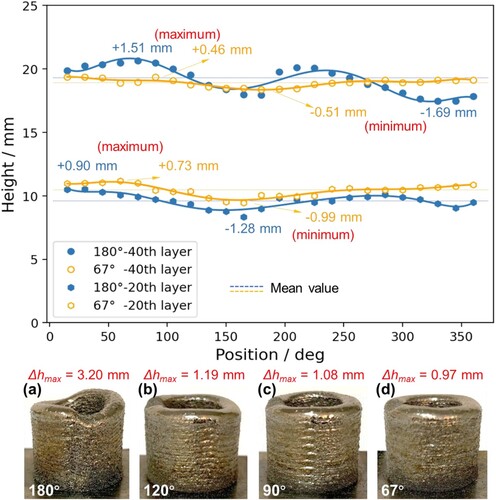
To further validate the theory, the following experiments are conducted with the offset angles set as 120°, 90° and 67° (67° is close to 65.6°, and is away from 60°), as presented in . After the 40-layer deposition, the maximum differences in height are 1.19, 1.08 and 0.97 mm for 120°, 90° and 67°, respectively. The error span of 67° is reduced to only ±2.4% of the desired dimension around the mean value. The craters at the end of last layers for each sample can be observed, which are evidences of the liquid gouging regions formed due to the recoil pressure extorted normal to the surfaces of the molten pools.
Figure 12. (a) The height variation of hollow cylinders with the offsets of 180° and 67°. (b–e) 40-layer components deposited with layer-wise offsets of 180°, 120°, 90° and 67°.
Besides, it is also supported by data in that offset angles near the factors of 360° have a higher probability of repetition and error accumulation, hence they are not advisable for application. In addition, (a) illustrates that the error amplification around the average of the 180° strategy is three times that of the 67° strategy at the 40th layer and four-thirds of the 67° strategy at the 20th layer. However, it will be kind of counterintuitive to find that, for the 67° strategy, the deviation at the 20th layer is greater than that of the 40th layer. A possible hypothesis is that, as the layers augment, the volume of the molten pool increases due to heat accumulation. According to the model, the length of the molten pool grows from 6 mm at the 1st layer to nearly 20 mm at the 20th layer. The height of molten pool increases from 1.7 mm at the 1st layer to 3.4 mm at the 20th layer. The elongated and deepened molten pool enhances self-regulation by supplying more material to fill the gouge. In contrary, the first 20 layers are deviated because the penetration depth of molten pool is small and the volume is not enough for mass redistribution.
Table 3. Maximum height error for builds printed with various strategies.
3.2.3. Self-regulation mechanism investigated via molten pool dynamics
It can be observed from the model in that the laser-wise 67° offset strategy contributes to a nearly perfect geometry, except for a gouge arising where the laser starts and eliminates (see Animation 3 in the Supplementary Material). However, (b) shows that two uneven regions exist on the bottom, at the starting points of the 17th and the 18th layers. Wherein, the non-uniformity of the 17th layer is inherited from the last layer, but with a reduced height difference after the effect of remelting distribution. So, it can be deduced that the multi-start scanning strategy can reduce the existing error by self-regulation, which helps alleviate deviation and achieve a uniform shape.
Figure 13. Computed results of the hollow cylinder using laser-wise 67° offset strategy. (a) Overall view of the 20th layer build. (b) The features of the bottom of the 18th layer over the build. (c–g) Decoupled profiles of selected layers. The red stars mark the starting point of each layer.
It is known that the solidification conditions at the boundary of the molten pool largely determine the orientations and morphologies of the grains during AM (Wei, Elmer, and DebRoy Citation2016; Kuo et al. Citation2019). Thus, another interesting phenomenon is the near-flat bottom of the solidifying layer as shown in (b), which would cause near-vertical columnar grains considering the epitaxial growth mechanism (Wei et al. Citation2019; Wei, Elmer, and DebRoy Citation2017) of the prior beta grains for the α+β titanium alloys (Wang et al. Citation2015; Carroll, Palmer, and Beese Citation2015).
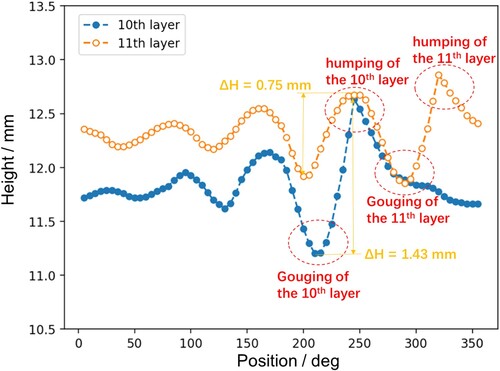
Compared with (a), (e) has, to a great extent, improved the height uniformity around the gouge after the redistribution of molten pool. As mentioned above, effects such as recoil force and Marangoni force determine the formation of backward flow. Once the laser beam arrives at the gouge area, the bottom of the pool is deepened and the height gap of the pool surface is enlarged, which hampers the transportation of the backwards flow, as shown in (b,c). However, since the moment of 74.5 s, the laser beam moves from the lowest point to the peak point, and the transportation inside the pool is reinforced, leaving the mass of the molten pool trapped in the gouge. As shown in (d), the redistribution of mass is effective to reduce the height deviation as the gouge has been filled to nearly the same level as the hump.
Figure 14. The compensation mechanism of molten pool dynamics at the 11th layer. (a) The status of the gouge before the compensation. (b) The backward mass transfer near the molten pool surface. (c) Laser arrives at the lowest point of the upper surface. (d) The remelt of the humping and the fill of the gouge compared with (c). (e) Rebounding hump after compensation. (f) Transparent view of the molten layer.
Although the flattened hump re-piles up in (e–f), resulting from the shallow molten pool, the maximum gap between 200° and 250° in has ultimately been narrowed to a half of the previous value. Meanwhile, new hump and gouge of the 11th layer appear as well, which will be alleviated in the next layer by the rule of self-regulation. Besides in , the vibration amplitude of curves increases from left to right, with uniform intervals of approximately 70°, which indicates the deviation is not solved thoroughly by one regulation, otherwise, residual errors will not accumulate to form two humps in the dual-start case.
Figure 15. The effect of compensation mechanism: comparison between the height curves before and after the 11th layer.
Although the 67° strategy ameliorates remarkably the accuracy of deposition, the error still exists in the case of few layers, due to the starting/pausing of laser at each layer. Consequently, it is worth attempting continuous deposition to further improve the height uniformity. The predicted effect of continuous scanning strategy is remarkable (see Animation 4 in the Supplementary Material). In (a–c), the state is captured when depositing the 4th layer. The molten pool is steady throughout the process and the unevenness induced by changing points has been removed from the upper surface. Only a slight height difference is discovered around the starting point, but it soon disappears as is shown in (d–f). Due to the lack of idle time, the temperature is higher than in non-continuous scanning and the width of wall expands from 4–5 to 4.5–5.5 mm in (g).
Figure 16. Simulated results of the continuous printing strategy with molten pool from different perspectives. (a–c) The 4th layer and (d–f) the 16th layer. (g) The cross-section of component. (h) The width of component. (i) The virtual paths of continuous printing.
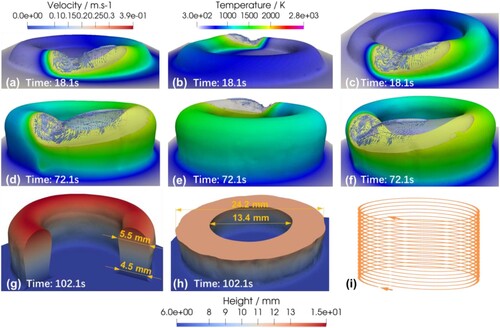
In brief, the hollow cylinders deposited in this method have a good consistency of width and height ((h–i)), which improves the accuracy merely by means of the natural condition of laser DED. However, continuous printing also has limitations such as deviation caused by changing curvature and path topology problems, and the strict requirements of the precise configurations for ideal focal conditions (Weng et al. Citation2019). Especially, the continuous strategy may not be applicable when dealing with complicated shapes involving sharp intersections and open contours. Therefore, the development of self-adaptive-based real-time monitoring and adjustment system of molten pool state is needed to improve the shape control accuracy and structural universality of AM (Liao et al. Citation2022). Hybrid models integrating numerical modelling and deep learning for fast and accurate predictions of the molten pool characteristics (Zhao, Wei, et al. Citation2022) and infill scanning strategies (Ren et al. Citation2021) for complex parts are highly desired as well. Thus, future investigations should emphasise the dynamic control of the molten pool for effective approaches suppressing the errors and improving the deposition accuracies of complex structures.
4. Conclusions
In this work, the critical roles of the molten pool in determining the printing accuracies of laser DED components were explored using exemplary cases with unexpected deposition errors. A series of experiments were carried out using various strategies to show the significant deviations in the typical closed-contour structures. A mechanistic model was developed to reveal the complex physical processes and enlighten philosophies addressing the issues. The main findings are summarised below:
The geometrical accuracies of the final build may significantly deviate from the designed object, depending on the specific printing strategies. The seemingly simple and feasible case of the unidirectional pinned-start strategy resulted in an error span of 23.4%, while the error spans of the bidirectional strategy and the 67° layer-wise offset strategy are 4.5% and 2.4%, respectively.
The geometrical deviation originates from the drastic flow of the liquid metal in the molten pool, which is mainly driven by the recoil pressure, surface tension and Marangoni stress with magnitudes on the orders of 0.7–3 × 10³ Pa. The recoil force is dominant in determining the non-uniform distribution of the molten metal.
The geometrical deviations can be aggravated or compensated via the layer-wise inheritance mechanisms of laser DED. The frequent repetitions of starting points led to concentrations of residual errors. It is advisable to select offset angles like 67° instead of 180° and 90° which are factors of 360° for efficient compensations.
The deposition precision can be effective controlled under the natural condition of DED by taking advantage of the dynamic behaviour of molten pool. The effect of layer-wise self-regulation demonstrated in this work can be effectively used to alleviate the macroscopic printing errors in the 3D build.
Additional information
Funding
References
- Abe, Takeyuki, Jun’ichi Kaneko, and Hiroyuki Sasahara. 2020. “Thermal Sensing and Heat Input Control for Thin-Walled Structure Building Based on Numerical Simulation for Wire and Arc Additive Manufacturing.” Additive Manufacturing 35: 101357. doi:10.1016/j.addma.2020.101357.
- Bayat, Mohamad, Wen Dong, Jesper Thorborg, Albert C. To, and Jesper H. Hattel. 2021. “A Review of Multi-Scale and Multi-Physics Simulations of Metal Additive Manufacturing Processes with Focus on Modeling Strategies.” Additive Manufacturing 47: 102278. doi:10.1016/j.addma.2021.102278.
- Bayat, Mohamad, Venkata K. Nadimpalli, Francesco G. Biondani, Sina Jafarzadeh, Jesper Thorborg, Niels S. Tiedje, Giuliano Bissacco, David B. Pedersen, and Jesper H. Hattel. 2021. “On the Role of the Powder Stream on the Heat and Fluid Flow Conditions During Directed Energy Deposition of Maraging Steel—Multiphysics Modeling and Experimental Validation.” Additive Manufacturing 43: 102021. doi:10.1016/j.addma.2021.102021.
- Bermingham, M. J., D. H. StJohn, J. Krynen, S. Tedman-Jones, and M. S. Dargusch. 2019. “Promoting the Columnar to Equiaxed Transition and Grain Refinement of Titanium Alloys During Additive Manufacturing.” Acta Materialia 168: 261–274. doi:10.1016/j.actamat.2019.02.020.
- Cao, Y., H. L. Wei, T. Yang, T. T. Liu, and W. H. Liao. 2021. “Printability Assessment with Porosity and Solidification Cracking Susceptibilities for a High Strength Aluminum Alloy During Laser Powder Bed Fusion.” Additive Manufacturing 46: 102103. doi:10.1016/j.addma.2021.102103.
- Carroll, Beth E., Todd A. Palmer, and Allison M. Beese. 2015. “Anisotropic Tensile Behavior of Ti–6Al–4V Components Fabricated with Directed Energy Deposition Additive Manufacturing.” Acta Materialia 87: 309–320. doi:10.1016/j.actamat.2014.12.054.
- Chen, Yunhui, Samuel J. Clark, David M. Collins, Sebastian Marussi, Simon A. Hunt, Danielle M. Fenech, Thomas Connolley, et al. 2021. “Correlative Synchrotron X-ray Imaging and Diffraction of Directed Energy Deposition Additive Manufacturing.” Acta Materialia 209: 116777. doi:10.1016/j.actamat.2021.116777.
- Chen, Yunhui, Samuel J. Clark, Lorna Sinclair, Chu Lun Alex Leung, Sebastian Marussi, Thomas Connolley, Robert C. Atwood, et al. 2021. “Synchrotron X-ray Imaging of Directed Energy Deposition Additive Manufacturing of Titanium Alloy Ti-6242.” Additive Manufacturing 41: 101969. doi:10.1016/j.addma.2021.101969.
- Cunningham, Ross, Cang Zhao, Niranjan Parab, Christopher Kantzos, Joseph Pauza, Kamel Fezzaa, Tao Sun, and Anthony D Rollett. 2019. “Keyhole Threshold and Morphology in Laser Melting Revealed by Ultrahigh-Speed X-ray Imaging.” Science 363 (6429): 849–852. doi:10.1126/science.aav4687.
- DebRoy, T., and S. A. David. 1995. “Physical Processes in Fusion Welding.” Reviews Of Modern Physics 67 (1): 85–112. doi:10.1103/RevModPhys.67.85.
- DebRoy, T., T. Mukherjee, H. L. Wei, J. W. Elmer, and J. O. Milewski. 2021. “Metallurgy, Mechanistic Models and Machine Learning in Metal Printing.” Nature Reviews Materials 6 (1): 48–68. doi:10.1038/s41578-020-00236-1.
- DebRoy, T., H. L. Wei, J. S. Zuback, T. Mukherjee, J. W. Elmer, J. O. Milewski, A. M. Beese, A. Wilson-Heid, A. De, and W. Zhang. 2018. “Additive Manufacturing of Metallic Components – Process, Structure and Properties.” Progress in Materials Science 92: 112–224. doi:10.1016/j.pmatsci.2017.10.001.
- Fan, Wei, Hua Tan, Xin Lin, and Weidong Huang. 2020. “Thermal Analysis of Synchronous Induction-Assisted Laser Deposition of Ti-6Al-4V Using Different Laser-Induction Interaction Modes.” Additive Manufacturing 35: 101267. doi:10.1016/j.addma.2020.101267.
- Feldhausen, Thomas, Lauren Heinrich, Kyle Saleeby, Alan Burl, Brian Post, Eric MacDonald, Chris Saldana, and Lonnie Love. 2022. “Review of Computer-Aided Manufacturing (CAM) Strategies for Hybrid Directed Energy Deposition.” Additive Manufacturing 56: 102900. doi:10.1016/j.addma.2022.102900.
- Gu, Heng, and Lin Li. 2019. “Computational Fluid Dynamic Simulation of Gravity and Pressure Effects in Laser Metal Deposition for Potential Additive Manufacturing in Space.” International Journal of Heat and Mass Transfer 140: 51–65. doi:10.1016/j.ijheatmasstransfer.2019.05.081.
- Gu, D., X. Shi, R. Poprawe, D. L. Bourell, R. Setchi, and J. Zhu. 2021. “Material-Structure-Performance Integrated Laser-Metal Additive Manufacturing.” Science 372 (6545): 1–15. doi:10.1126/science.abg1487.
- Gunasegaram, D. R., A. B. Murphy, A. Barnard, T. DebRoy, M. J. Matthews, L. Ladani, and D. Gu. 2021. “Towards Developing Multiscale-Multiphysics Models and Their Surrogates for Digital Twins of Metal Additive Manufacturing.” Additive Manufacturing 46: 102089. doi:10.1016/j.addma.2021.102089.
- Jeon, Ikgeun, Liu Yang, Kwangnam Ryu, and Hoon Sohn. 2021. “Online Melt Pool Depth Estimation During Directed Energy Deposition Using Coaxial Infrared Camera, Laser Line Scanner, and Artificial Neural Network.” Additive Manufacturing 47: 102295. doi:10.1016/j.addma.2021.102295
- Kouraytem, Nadia, Xuxiao Li, Ross Cunningham, Cang Zhao, Niranjan Parab, Tao Sun, Anthony D. Rollett, Ashley D. Spear, and Wenda Tan. 2019. “Effect of Laser-Matter Interaction on Molten Pool Flow and Keyhole Dynamics.” Physical Review Applied 11: 6. doi:10.1103/PhysRevApplied.11.064054.
- Kuo, C. N., C. K. Chua, P. C. Peng, Y. W. Chen, S. L. Sing, S. Huang, and Y. L. Su. 2019. “Microstructure Evolution and Mechanical Property Response via 3D Printing Parameter Development of Al–Sc Alloy.” Virtual and Physical Prototyping 15 (1): 120–129. doi:10.1080/17452759.2019.1698967.
- Li, Geng, Kyle Odum, Curtis Yau, Masakazu Soshi, and Kazuo Yamazaki. 2021. “High Productivity Fluence Based Control of Directed Energy Deposition (DED) Part Geometry.” Journal of Manufacturing Processes 65: 407–417. doi:10.1016/j.jmapro.2021.03.028
- Liang, Xuan, Wen Dong, Shawn Hinnebusch, Qian Chen, Hai T. Tran, John Lemon, Lin Cheng, Zekai Zhou, Devlin Hayduke, and Albert C. To. 2020. “Inherent Strain Homogenization for Fast Residual Deformation Simulation of Thin-Walled Lattice Support Structures Built by Laser Powder bed Fusion Additive Manufacturing.” Additive Manufacturing 32: 101091. doi:10.1016/j.addma.2020.101091.
- Liao, Shuheng, Samantha Webster, Dean Huang, Raymonde Council, Kornel Ehmann, and Jian Cao. 2022. “Simulation-Guided Variable Laser Power Design for Melt Pool Depth Control in Directed Energy Deposition.” Additive Manufacturing 56: 102912. doi:10.1016/j.addma.2022.102912.
- Liu, F. Q., L. Wei, S. Q. Shi, and H. L. Wei. 2020. “On the Varieties of Build Features During Multi-Layer Laser Directed Energy Deposition.” Additive Manufacturing 36: 101491. doi:10.1016/j.addma.2020.101491.
- Machirori, T., F. Q. Liu, Q. Y. Yin, and H. L. Wei. 2021. “Spatiotemporal Variations of Residual Stresses During Multi-Track and Multi-Layer Deposition for Laser Powder bed Fusion of Ti-6Al-4V.” Computational Materials Science 195: 110462. doi:10.1016/j.commatsci.2021.110462.
- Malakizadi, Amir, Dinesh Mallipeddi, Sasan Dadbakhsh, Rachid M'Saoubi, and Peter Krajnik. 2022. “Post-Processing of Additively Manufactured Metallic Alloys – A Review.” International Journal of Machine Tools and Manufacture 179, 103908. doi:10.1016/j.ijmachtools.2022.103908.
- McCann, Ronan, Muhannad A. Obeidi, Cian Hughes, Éanna McCarthy, Darragh S. Egan, Rajani K. Vijayaraghavan, Ajey M. Joshi, et al. 2021. “In-situ Sensing, Process Monitoring and Machine Control in Laser Powder Bed Fusion: A Review.” Additive Manufacturing 45: 102058. doi:10.1016/j.addma.2021.102058.
- Mi, Jiqian, Yikai Zhang, Hui Li, Shengnan Shen, Yongqiang Yang, Changhui Song, Xin Zhou, Yucong Duan, Junwen Lu, and Haibo Mai. 2021. “In-situ Monitoring Laser Based Directed Energy Deposition Process with Deep Convolutional Neural Network.” Journal of Intelligent Manufacturing, 34: 683–693. doi:10.1007/s10845-021-01820-0.
- Mukherjee, T., T. DebRoy, T. J. Lienert, S. A. Maloy, and P. Hosemann. 2021. “Spatial and Temporal Variation of Hardness of a Printed Steel Part.” Acta Materialia 209: 116775. doi:10.1016/j.actamat.2021.116775.
- Näsström, Jonas, Frank Brückner, and Alexander FH Kaplan. 2018. “Measuring the Effects of a Laser Beam on Melt Pool Fluctuation in arc Additive Manufacturing.” Rapid Prototyping Journal 25(3): 488–495. doi:10.1108/RPJ-01-2018-0033.
- Ogino, Y., S. Asai, and Y. Hirata. 2018. “Numerical Simulation of WAAM Process by a GMAW Weld Pool Model.” Welding in the World 62 (2): 393–401. doi:10.1007/s40194-018-0556-z.
- Ortega, Arturo Gomez, Luis Corona Galvan, Mehdi Salem, Kamel Moussaoui, Stephane Segonds, Sébastien Rouquette, and Frédéric Deschaux-Beaume. 2019. “Characterisation of 4043 Aluminium Alloy Deposits Obtained by Wire and Arc Additive Manufacturing Using a Cold Metal Transfer Process.” Science and Technology Of Welding and Joining 24 (6): 538–547. doi:10.1080/13621718.2018.1564986.
- Ren, K., Y. Chew, N. Liu, Y. F. Zhang, J. Y. H. Fuh, and G. J. Bi. 2021. “Integrated Numerical Modelling and Deep Learning for Multi-Layer Cube Deposition Planning in Laser Aided Additive Manufacturing.” Virtual and Physical Prototyping 16 (3): 318–332. doi:10.1080/17452759.2021.1922714.
- Shin, Yung C., Neil Bailey, Christopher Katinas, and Wenda Tan. 2018. “Predictive Modeling Capabilities from Incident Powder and Laser to Mechanical Properties for Laser Directed Energy Deposition.” Computational Mechanics 61 (5): 617–636. doi:10.1007/s00466-018-1545-1.
- Sinclair, Lorna, Samuel J. Clark, Yunhui Chen, Sebastian Marussi, Saurabh Shah, Oxana V. Magdysyuk, Robert C. Atwood, et al. 2022. “Sinter Formation During Directed Energy Deposition of Titanium Alloy Powders.” International Journal of Machine Tools and Manufacture 176: 103887. doi:10.1016/j.ijmachtools.2022.103887.
- Spranger, Felix, Benjamin Graf, Michael Schuch, Kai Hilgenberg, and Michael Rethmeier. 2018. “Build-up Strategies for Additive Manufacturing of Three Dimensional Ti-6Al-4V-Parts Produced by Laser Metal Deposition.” Journal of Laser Applications 30 (2): 022001. doi:10.2351/1.4997852.
- Sun, Zhe, Wei Guo, and Lin Li. 2020. “Numerical Modelling of Heat Transfer, Mass Transport and Microstructure Formation in a High Deposition Rate Laser Directed Energy Deposition Process.” Additive Manufacturing 33: 101175. doi:10.1016/j.addma.2020.101175.
- Svetlizky, D., M. Das, B. L. Zheng, A. L. Vyatskikh, S. Bose, A. Bandyopadhyay, J. M. Schoenung, E. J. Lavernia, and N. Eliaz. 2021. “Directed Energy Deposition (DED) Additive Manufacturing: Physical Characteristics, Defects, Challenges and Applications.” Materials Today 49: 271–295. doi:10.1016/j.mattod.2021.03.020.
- Wang, T., Y. Y. Zhu, S. Q. Zhang, H. B. Tang, and H. M. Wang. 2015. “Grain Morphology Evolution Behavior of Titanium Alloy Components During Laser Melting Deposition Additive Manufacturing.” Journal Of Alloys and Compounds 632: 505–513. doi:10.1016/j.jallcom.2015.01.256.
- Wei, H. L., Y. Cao, W. H. Liao, and T. T. Liu. 2020. “Mechanisms on Inter-Track Void Formation and Phase Transformation During Laser Powder Bed Fusion of Ti-6Al-4V.” Additive Manufacturing 34: 101221. doi:10.1016/j.addma.2020.101221.
- Wei, H. L., J. W. Elmer, and T. DebRoy. 2016. “Origin of Grain Orientation During Solidification of an Aluminum Alloy.” Acta Materialia 115: 123–131. doi:10.1016/j.actamat.2016.05.057.
- Wei, H. L., J. W. Elmer, and T. DebRoy. 2017. “Three-dimensional Modeling of Grain Structure Evolution During Welding of an Aluminum Alloy.” Acta Materialia 126: 413–425. doi:10.1016/j.actamat.2016.12.073.
- Wei, H. L., G. L. Knapp, T. Mukherjee, and T. DebRoy. 2019. “Three-dimensional Grain Growth During Multi-Layer Printing of a Nickel-Based Alloy Inconel 718.” Additive Manufacturing 25: 448–459. doi:10.1016/j.addma.2018.11.028.
- Wei, H. L., F. Q. Liu, W. H. Liao, and T. T. Liu. 2020. “Prediction of Spatiotemporal Variations of Deposit Profiles and Inter-Track Voids During Laser Directed Energy Deposition.” Additive Manufacturing 34: 101219. doi:10.1016/j.addma.2020.101219.
- Wei, H. L., F. Q. Liu, L. Wei, T. T. Liu, and W. H. Liao. 2021. “Multiscale and Multiphysics Explorations of the Transient Deposition Processes and Additive Characteristics During Laser 3D Printing.” Journal of Materials Science & Technology 77: 196–208. doi:10.1016/j.jmst.2020.11.032.
- Wei, H. L., T. Mukherjee, W. Zhang, J. S. Zuback, G. L. Knapp, A. De, and T. DebRoy. 2021. “Mechanistic Models for Additive Manufacturing of Metallic Components.” Progress in Materials Science 116: 100703. doi:10.1016/j.pmatsci.2020.100703.
- Wei, H. L., S. Pal, V. Manvatkar, T. J. Lienert, and T. DebRoy. 2015. “Asymmetry in Steel Welds with Dissimilar Amounts of Sulfur.” Scripta Materialia 108: 88–91. doi:10.1016/j.scriptamat.2015.06.024.
- Weng, Fei, Shiming Gao, Jingchao Jiang, JianJian Wang, and Ping Guo. 2019. “A Novel Strategy to Fabricate Thin 316L Stainless Steel Rods by Continuous Directed Energy Deposition in Z Direction.” Additive Manufacturing 27: 474–481. doi:10.1016/j.addma.2019.03.024.
- Wolff, Sarah J., Zhengtao Gan, Stephen Lin, Jennifer L. Bennett, Wentao Yan, Gregory Hyatt, Kornel F. Ehmann, Gregory J. Wagner, Wing Kam Liu, and Jian Cao. 2019. “Experimentally Validated Predictions of Thermal History and Microhardness in Laser-Deposited Inconel 718 on Carbon Steel.” Additive Manufacturing 27: 540–551. doi:10.1016/j.addma.2019.03.019.
- Wolff, Sarah J., Hui Wang, Benjamin Gould, Niranjan Parab, Ziheng Wu, Cang Zhao, Aaron Greco, and Tao Sun. 2021. “In Situ X-ray Imaging of Pore Formation Mechanisms and Dynamics in Laser Powder-Blown Directed Energy Deposition Additive Manufacturing.” International Journal of Machine Tools and Manufacture 166: 103743. doi:10.1016/j.ijmachtools.2021.103743.
- Wu, Jiazhu, Song Ren, Yi Zhang, Yang Cao, Dabin Zhang, and Cunhong Yin. 2021. “Influence of Spatial Laser Beam Profiles on Thermal-Fluid Transport During Laser-Based Directed Energy Deposition.” Virtual and Physical Prototyping 16 (4): 444–459. doi:10.1080/17452759.2021.1960734.
- Zhang, Bin, Shunyu Liu, and Yung C. Shin. 2019. “In-Process Monitoring of Porosity During Laser Additive Manufacturing Process.” Additive Manufacturing 28: 497–505. doi:10.1016/j.addma.2019.05.030.
- Zhang, Ziyang, Zhichao Liu, and Dazhong Wu. 2021. “Prediction of Melt Pool Temperature in Directed Energy Deposition Using Machine Learning.” Additive Manufacturing 37: 101692. doi:10.1016/j.addma.2020.101692.
- Zhao, Cang, Bo Shi, Shuailei Chen, Dong Du, Tao Sun, Brian J. Simonds, Kamel Fezzaa, and Anthony D. Rollett. 2022. “Laser Melting Modes in Metal Powder Bed Fusion Additive Manufacturing.” Reviews Of Modern Physics 94 (4). doi:10.1103/RevModPhys.94.045002.
- Zhao, Tong, Yuhan Wang, Tianshan Xu, Maha Bakir, Wangcan Cai, Mengjie Wang, Marius Dahmen, et al. 2021. “Some Factors Affecting Porosity in Directed Energy Deposition of AlMgScZr-Alloys.” Optics & Laser Technology 143: 107337. doi:10.1016/j.optlastec.2021.107337.
- Zhao, M. Z., H. L. Wei, Y. M. Mao, C. D. Zhang, T. T. Liu, and W. H. Liao. 2022. “Predictions of Additive Manufacturing Process Parameters and Molten Pool Dimensions with Physics-Informed Deep Learning Model.” Engineering. In press.