
 ?Mathematical formulae have been encoded as MathML and are displayed in this HTML version using MathJax in order to improve their display. Uncheck the box to turn MathJax off. This feature requires Javascript. Click on a formula to zoom.
ABSTRACT
Metallic lattice structures based on triply periodic minimum surfaces (TPMS) have attracted extensive attention for their potential application in lightweight and energy absorption. The underlying phenomena, mechanisms and modelling under the crushing responses from quasi-static to shock conditions still remain to be revealed. This work systematically investigates the mechanical behaviour of graded additively Schoen-F-RD (FRD) lattice structures under various loading rates. Under dynamic compression, FRD lattices exhibit the ability to withstand larger densification strains at higher plateau strengths, thus, holding enhanced energy absorption capabilities. At medium strain rates, it is the rate-dependence of lattice base material dominates in the strength enhancement, while, at higher strain rates, the role of inertia effect becomes notable. Furthermore, an empirical formula is introduced to predict the shock stress responses. Finally, constitutive models with strain-rates are proposed for the uniform and graded lattices. These findings can provide excellent guidance on the design of energy-absorbing structures.
1. Introduction
Cellular materials have found widespread use in various engineering fields due to their excellent mechanical characteristics, such as lightweight, high specific stiffness/strength, good energy absorption capacity, and multifunctional properties [Citation1–5]. Typically, cellular materials consist of an interconnected network of solid struts and/or plates forming the edges and faces of pores and cells [Citation6]. Depending to their cell configuration, cellular materials can be categorised as either stochastic or periodic structures [Citation7,Citation8]. Stochastic structures, like bones and foams, exhibit random distributions of cell characteristics (size, shape, orientation, strut or wall thickness, etc.) [Citation9]. Periodic structures, on the other hand, are defined based on unit cell design parameters, and their mechanical properties can be regulated by controlling the unit cell parameter [Citation10,Citation11], offering much higher designability than stochastic ones.
The advancement of additive manufacturing (AM) technology has facilitated the accurate production of various periodic structures, including body-centred cubic (BCC) lattices [Citation12], Octet truss lattices [Citation13], Kelvin lattices [Citation14], rhombic dodecahedron (RD) structures [Citation15,Citation16], and triply periodic minimal surface (TPMS) structures [Citation17–19]. TPMS structures consist of non-intersecting surfaces with zero mean curvature at any point on the surface [Citation20], effectively avoiding stress concentration and exhibiting superior mechanical properties compared to some traditional lattice structures [Citation21–24]. Generally, TPMS structures can be classified into skeletal-, strut- and sheet-based structures. Research [Citation25–27] has shown that the sheet-based TPMS structures can offer better mechanical performance compared to the skeletal- and strut-based structures. Therefore, this study concentrates on metallic sheet-based TPMS structures, leveraging the strength of metals and the mechanical advantages of sheet-based structures.
Various sheet-based TPMS structures have been developed using level-set equations, including Primitive, Diamond, Gyroid, Schoen-I-WP (IWP) and Schoen-F-RD (FRD). Previous studies have explored the mechanical properties of these sheet-based uniform TPMS structures [Citation8,Citation28–31]. For instance, Zhang et al. [Citation31] investigated the quasi-static compressive mechanical properties of three uniform TPMS sheet structures (Primitive, Diamond, and Gyroid); and highlighted the superior energy absorption capacity of TPMS sheet structures compared to BCC lattices. Guo et al. [Citation28] noted the influence of opening diameter on the mechanical performance of P-lattice structures. Li et al. [Citation30] and San Ha et al. [Citation29] analysed the dynamic compressive characteristics (deformation modes, stress–strain responses and energy absorption) of Gyroid and Primitive structures, respectively. These studies emphasised that the mechanical properties of uniform TPMS structures are mainly dominated by cell morphology and relative density.
To further enhance the mechanical performance of TPMS structures, the graded structure strategy has been recently introduced to sheet-based TPMS structures. By continuously or stepwise varying sheet thickness or cell size, functionally graded TPMS structures (FG-TPMS) can be tailored to specific application needs [Citation32–34]. The mechanical performances of FG-TPMS structures under quasi-static loading have been explored by several researchers [Citation35–38]. Al-Ketan et al. [Citation35] investigated the deformation mechanisms and elastic properties of FG Schoen Gyroid and Schwarz Diamond structures. Zhang et al. [Citation38] showed that a continuous gradient design helps eliminate small cracks in the Gyroid structures, thereby enhancing their mechanical performance. Zhao et al. [Citation36] found that the energy absorption of FG Primitive and Gyroid structures under quasi-static compression can be approximately 60% higher than that of uniform counterparts. Up to date, only limited works about the dynamic behaviours of FG-TPMS structures have been reported [Citation39,Citation40]. Santiago et al. [Citation40] demonstrated 18% higher impact energy absorption in FG Diamond structures compared to uniform ones. Feng et al. [Citation39] revealed improved blast resistance in the sandwich panel with an FG Gyroid core. While FG-TPMS structures have shown advantages in terms of compressive strength and energy absorption, the development of a constitutive model accounting for strain-rate effects remains a need.
It is well known that loading velocity significantly impacts the deformation modes of metallic cellular materials (MCMs), subsequently affecting their dynamic constitutive behaviours [Citation41–43]. Under high crushing velocity, the compressive strength and energy absorption enhancement phenomenon were observed in the TPMS structures with the metal base material, such as 316L stainless steel [Citation30,Citation44]. The debate continues regarding whether the dynamic stress enhancement in MCMs is primarily due to the base material's rate-dependence or inertial effects [Citation45–48]. Thus, revealing the mechanisms underlying the dynamic crushing responses of metallic TPMS lattice structures is of utmost necessity.
Inspired by the above, this study aims at gaining a more comprehensive understanding on the phenomena, mechanisms and modelling under the crushing responses of uniform and FG-TPMS structures at a wider strain-rates ranging from quasi-static to shock states. Specifically, sheet-based FG FRD structures are designed using a sheet thickness grading method. The numerical models developed are verified against the quasi-static and dynamic experimental results. Afterwards, detailed discussions on quasi-static and dynamic crushing characteristics in terms of stress–strain responses, deformation modes and energy absorption are presented. By decoupling the base material's inertial effect and rate-dependence, this study unveils the dynamic enhancement mechanisms for FG FRD structures. Finally, strain-rate dependent constitutive models are proposed and validated.
2. Materials and methods
2.1. Design of TPMS lattices
Based on Yin et al. [Citation8], the FRD sheet structure was found to have the best crashworthiness among the four investigated types of TPMS structures (Primitive, FRD, IWP, and Gyroid), making it the focus of this study. The geometrical function of the FRD sheet structure in three-dimensional space can be defined as follows [Citation8]:
(1)
(1) where
,
, and
are three Cartesian coordinates and
is the cubic unit cell length.
Significantly, the size and volume fraction of the pores of FRD structures can be directly affected by the constant [Citation8]. In this study, the level constant
is set as a constant value (zero here). For the uniform FRD lattice structures, the geometry model can be easily obtained by replication in three perpendicular directions. In general, there are mainly two modelling techniques to design the graded lattices [Citation34]: (1) cell size grading (CSG), where the cell size is varied with a constant sheet thickness, and (2) sheet thickness grading (STG), where the sheet thickness is varied with a constant cell size. Previous study [Citation49] has demonstrated that the gradation approaches (CSG and STG) have little effect on the crushing responses of graded metallic foams. Here, the focus is on the graded lattice structures generated using the STG method.
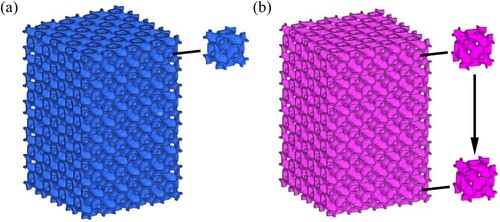
Compared to lattice structure with a smooth gradient, the layer-wise gradient configuration with material properties varying in a layer-by-layer fashion exhibits great simplicity and efficiency in terms of manufacturing and modelling [Citation49]. As a result, the graded lattice is in discrete form with the layer-wise gradient in this study. shows two examples of uniform and stepwise graded FRD lattice structures. The designed lattices were generated in shell form, and the thicknesses were assigned in the model based on the relative density. Relative density is a crucial criterion for evaluating the mechanical performance of cellular structures, defined as the ratio between the densities of the cellular structure and the base material [Citation1,Citation50].
Figure 1. Examples of FRD lattice structures: (a) uniform lattice; and (b) graded lattice.
2.2. Set-up of the FE model
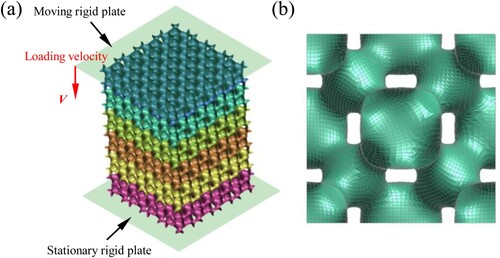
The crushing responses of the uniform and graded FRD lattice structure are numerically investigated using the LS-DYNA/Explicit package, as shown in . The FE model of the FRD lattice is sandwiched between two rigid plates, namely the ‘moving plate’ and ‘stationary plate’ (see in (a)). The faces of the FRD lattice structure are discretized using Belytschko-Tsay thin shell elements with an element size of 0.3 mm according to a mesh sensitivity analysis ( (b)). Contacts between the two plates and the lattice are simulated using the automatic surface-to-surface algorithm, with static and dynamic friction coefficients set at 0.3 and 0.2, respectively [Citation8]. In addition, the automatic single surface algorithm is applied to the faces to prevent self-contact penetration. To improve the computational efficiency, the increase in quasi-static testing velocity was used to speed up the simulations and was confirmed as acceptable where the reaction forces at the impact end and support end are balanced during the whole loading process [Citation51,Citation52]. Following this method, the ‘moving plate’ moves downward at a constant velocity of 2 m/s, while the nodal degree of freedoms (DOFs) of the ‘stationary plate’ are constrained, as recommended in Refs. [Citation51,Citation53]. It needs to be pointed out that the strain-rate dependent behaviour of the lattice base material is not considered in the condition of quasi-static crushing simulation [Citation47]. In addition, the effect of air on the compressive responses can be ignored due to that the investigated FRD lattices are open-cell with the large cell size [Citation6].
Figure 2. Numerical set-up of the FRD lattice under crushing loadings: (a) the established FE model and (b) mesh size.
To simulate dynamic crushing conditions, different loading velocities are applied for the ‘moving plate’. The strain-rate dependence of the lattice base material is described using the Cowper–Symonds equation [Citation30,Citation54]:
(2)
(2) in which
is the flow stress that depends on strain-rate,
denotes the static yield stress,
is the strain-rate, and
and
are the strain-rate sensitivity parameters.
Different relative densities () of FRD lattice structures can be obtained by changing the shell thickness [Citation42] as follows:
(3)
(3) in which
and
are the densities of the lattice structure and the base material, respectively;
and
are the area and volume of the cell-wall, respectively.
is the number of the cell-wall and
is the shell thickness.
Using the STG modelling method, a constant shell thickness is assigned to each layer of the FE model, allowing for the generation of functionally stepwise graded FRD lattice structures. Note that one cell size is regarded as one layer here. The gradient configuration can be adjusted by changing the shell thickness of each layer. The thickness changes between two interconnected layers of the functionally stepwise graded lattice structures are tackled by setting up different shell thicknesses at nodes.
2.3. FE model validations
Uniform FRD lattice structures, consisted of 64 () unit cells with a cell size of 15 mm and the shell thickness of 1 mm, were utilised to validate the numerical accuracy of FE models under quasi-static loading. The lattice structure was made of EOS CX stainless steel and its material properties were determined through standard tensile experiments using SLM fabricated tensile samples, as listed in . More details about the SLM processing parameters to manufacture lattice structures can be referred to in Ref [Citation8]. Generally, the mechanical properties of additively-manufactured lattice structures are also influenced by the manufacturing process [Citation3,Citation9] and printing direction [Citation54–56], et al., which will be a focus of our future study. In this work, the main focus is on exploring the strain-rate factor in affecting the crushing characteristics of FRD lattices along the printing direction.
Table 1. The mechanical properties of EOS CX stainless steel [Citation8].
A corresponding FE model featuring a 64-cell () model is also established, with the detailed set-up available in the above section. Note that unit size analysis has proved that the 64-cell model (
) is sufficient to capture the overall mechanical properties of cellular structures [Citation8,Citation14,Citation57].
Comparisons of the crushing mechanical responses (deformation mode and force-displacement curve) of the FRD structure between FE simulations and the experimental results are displayed in . It can be seen that the evolution of deformation modes in the FE models during three loading processes (the displacement ) matches well with those of the experimental results ( (a)). Specifically, X-shaped shear band is observed both in experimental and numerical lattice specimen when compressive displacement is 30 mm. The force-displacement curves derived from the simulation results generally exhibit good agreement with the experimental results ( (b)). The mean crushing force (MCF), defined as a ratio of total energy absorption to the maximum crushing distance, is an essential metric to evaluate the global compressive mechanical response of lattice structures [Citation4,Citation5]. The numerical MCF (460.91 kN) is 14.62% smaller than the experimental results (539.81 kN), which is mainly caused by the mass error between as-designed and manufactured lattice samples [Citation16,Citation31].
Figure 3. Comparisons between the numerical simulation and experimental results [Citation8]: (a) deformation mode evolution; and (b) force-displacement curve.
![Figure 3. Comparisons between the numerical simulation and experimental results [Citation8]: (a) deformation mode evolution; and (b) force-displacement curve.](/cms/asset/70bb9d23-1930-4f26-bebc-3ceca62fcaaf/nvpp_a_2283027_f0003_oc.jpg)
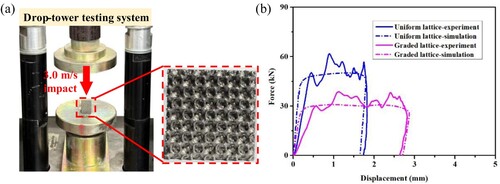
To validate the numerical accuracy of FE models under dynamic loading, 64-cell () uniform lattice with shell thickness of 0.25 mm and 96-cell (
) graded specimen with six graded layers and shell thicknesses of 0.15, 0.1625, 0.175, 0.1875, 0.20 and 0.2125 mm were manufactured by SLM process and then used to conduct dynamic compression tests by a drop-tower testing system (Instron 9250 HV) (see (a)). Each cell size of the lattice specimens is 3.75 mm for dynamic tests. Note that the SLM processing parameters adopted are kept the same in fabricating different lattice specimens. In FE models, the total drop weight mass (18.58 Kg) and initial impact velocity (3.0 m/s) were assigned on the ‘moving plate’ in line with the experimental conditions. The value of
and
are set as 1704.5/s and 5.2 in C–S model (see Equation (2)) to describe the dynamic mechanical properties of stainless steel lattice base materials, as recommended in Refs. [Citation30,Citation58,Citation59]. From (b), it is shown that the numerical force-displacement curves show an acceptable agreement with the experimental results. Overall, and indicate that the results predicted by FE models correlate well with those obtained by experiment and thus is considered to be valid for subsequent studies.
Figure 4. (a) Drop-tower testing system; and (b) Compassions of force-displacement curve between the simulation and experiment.
3. Results and discussion
3.1. Quasi-static compressive mechanical characteristics
3.1.1. Stress-strain responses
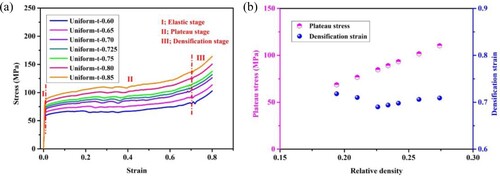
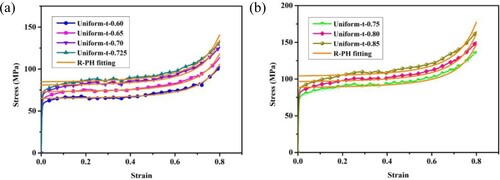
Previous studies [Citation30,Citation60] have demonstrated that TPMS lattice structures with the relative density of 20% and 30% possess more excellent mechanical properties, such as higher compressive strength and specific energy absorption (SEA). In general, cellular materials signify one of the porous structures typically with a porosity over 70%, and the relative density is less than 30% [Citation11]. To take the lightweight characteristics of lattice structures, seven shell thicknesses of 0.60, 0.65, 0.70, 0.725, 0.75, 0.80 and 0.85 mm, corresponding to the relative densities of 0.194, 0.210, 0.226, 0.234, 0.242, 0.258 and 0.274, are considered to explore the FRD lattice density effect on the compressive characteristics. Note that FRD structures for the quasi-static and dynamic numerical analysis consist of 96-unit cells (), and each cell size is 15 mm.
For the uniform FRD lattice structures with varying densities (shell thicknesses), the numerical nominal stress-nominal strain curves are plotted in (a). Significantly, the stress–strain curve profiles for different densities all exhibit the characteristic three-stage behaviour of cellular materials, a linear elastic stage (Stage I), followed by an extended plateau stage (Stage II) and finally a densification stage (Stage III). Notably, a continuous hardening effect is observed during Stage II. At Stage III, stress increases sharply due to more lattice sheets coming into contact with each other, resembling the behaviour of solid materials.
Figure 5. (a) the numerical stress-strain curves and (b) the plateau stress and densification strain varying with the relative density.
Generally speaking, the plateau stress and densification strain are the two key metrics to evaluate the compressive mechanical performance of cellular materials [Citation1,Citation5,Citation61]. Here, an energy efficiency-based approach is utilised to quantitatively investigate how the relative density affects these two evaluating indicators. Energy absorption efficiency is defined as the energy absorbed up to a given nominal strain
normalised by the corresponding stress value
[Citation62–64], as:
(4)
(4)
The densification strain is defined to be the strain when the energy absorption efficiency
reaches the maximum, mathematically as:
(5)
(5)
The plateau stress is determined by
(6)
(6)
Based on Equations (4)-(6), the calculated plateau stress and densification strain varying with relative density are plotted in (b). Significantly, the plateau stress is gradually increased with increasing relative density. However, there is no evident variation in densification strain in spite of the different relative densities. Specifically, the densification strain variation is less than 2.1% compared with the average value (0.703). In other words, it may be considered that the densification strain is insensitive within the investigated relative density.
Herein, linear gradient configuration involving increasing or decreasing shell thickness are investigated. FRD lattice structures consisting of two, three and six layers, with an average shell thickness of 0.725 mm (relative density of 0.234) are considered. The effect of lattice gradient configuration on compressive stress–strain responses is analysed, as shown in . The specimens investigated were labelled characteristically; for example, ‘Graded-three-t-0.60-0.725-0.85’ indicates a graded specimen with three graded layers and shell thicknesses of 0.60, 0.725 and 0.85 mm along the compressive direction. Note that each layer’s height remains constant, equal to the ratio of the total height to the layer number. To facilitate comparison, the stress–strain curve of the uniform specimen with an equivalent density (specimen ‘Uniform-t-0.725’) is also plotted in . Unlike the uniform lattice, lattice specimens with linear density gradient do not exhibit a distinct plateau region. Instead, a phenomenon of multiple plateau stress phases is observed in the stress–strain curves, with the number of phases equal to the pre-designed number of layers, as in [Citation65]. For lattice specimens like ‘Graded-two-t-0.60-0.85’ and ‘Graded-two-t-0.85-0.60’, the obtained stress–strain curves almost overlap ( (a)). Similar observations can be found for the specimens ‘Graded-three-t-0.60-0.725-0.85’ and ‘Graded-three-t-0.85-0.725-0.60’ ( (b)). Irrespective of the gradation configuration, the plateau stress level generally increases. This implies that graded lattices progressively crush from the weakest layer (lowest density) to the strongest layer (highest density) during quasi-static compression. The following section will discuss the deformation propagation mechanisms to support this viewpoint.
Figure 6. The effect of lattice gradation on the stress-strain responses: (a) two-layer graded configurations and (b) three-layer graded configurations.
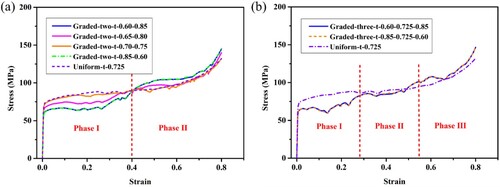
In comparison, the uniform lattice specimen exhibits a stable plateau stress stage. The relative density of the uniform lattice exceeds that of the weakest layers in the graded lattice. Hence, the stress level of graded lattices is relatively lower than that of the uniform specimen in the initial crushing phase. However, as the compressive strain becomes substantial, a higher stress will be generated in the graded lattices relative to the uniform specimen. Moreover, it is evident that the stress levels for uniform and graded specimens become quite close after the densification strain. This is because the lattice behaves like solid materials, as a large number of lattice sheets come into contact with each other during this stage. In this situation, the stress level may be determined by the overall density of the lattice structure.
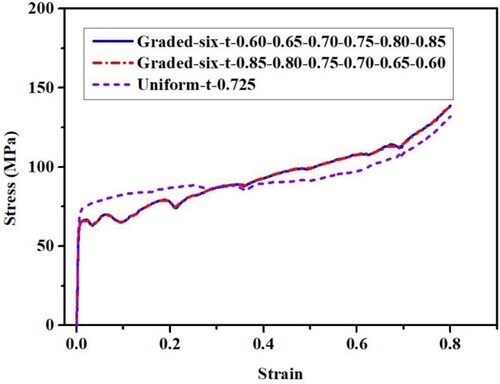
To generate lattice specimens with approximate continuous gradients, a six-layer graded lattice featuring a linear gradient is designed, and the corresponding numerical stress–strain responses are plotted in . It is evident that as the number of layers increases from two or three to six, the stress–strain becomes progressively smoother. A significant continuously linear hardening behaviour is observed in the plateau stage, which may be explained by the successive deformation mode of graded lattices. The stress–strain profile of the six-layer graded lattice is rather close to that of the lattice with continuous gradients [Citation36,Citation39].
Figure 7. Stress-strain responses of six-layer graded lattice structures.
3.1.2. Deformation modes
The deformation evolution mechanisms of uniform and graded lattices are detailed and analysed to understand the stress–strain responses better. Without loss of generality, the deformation procedure of three graded lattices and the uniform specimen is presented in . In the case of the uniform FRD lattice, relatively uniform deformation is seen at a low compressive strain (0.20); and then V-shaped shear bands can be observed at a compressive strain of 0.40. Subsequently, these shear bands extend along the lattice shells, ultimately becoming fully compressed at higher strains (see in (a)). For the lattice specimen ‘Graded-two-t-0.60-0.85’, initially, X-shaped shear bands emerge in the weakest layer (lower density). Densification then appears at the weakest layer, while the strongest layer (higher density) experiences minimal deformation ( (b)). As the compression procedure continues, the strongest layer replicates the deformation pattern observed in the weakest layer. Such deformation evolutions elucidate the presence of two plateau stress phases in the stress–strain curves ( (a)). Similar deformation patterns are also observed in the lattice specimen ‘Graded-three-t-0.85-0.725-0.60’. Moreover, it can be concluded that collapse bands consistently initiate in the weakest layer and progressively propagate towards the strongest layer, regardless of the gradation configuration ( (c)). Further, V-shaped shear bands are observed on the long lattice specimen ( (a)) while X-shaped shear bands on the short specimen (see in ). Thus, it can be concluded that the overall deformation characteristics of the lattice structure is related to the length of the specimen.
Figure 8. Deformation evolutions of uniform and graded lattice structures under quasi-static compression: (a) ‘Uniform-t-0.725’; (b) ‘Graded-two-t-0.60-0.85’; (c) ‘Graded-three-t-0.85-0.725-0.60’; and (d) ‘Graded-six-t-0.60-0.65-0.70-0.75-0.80-0.85’.
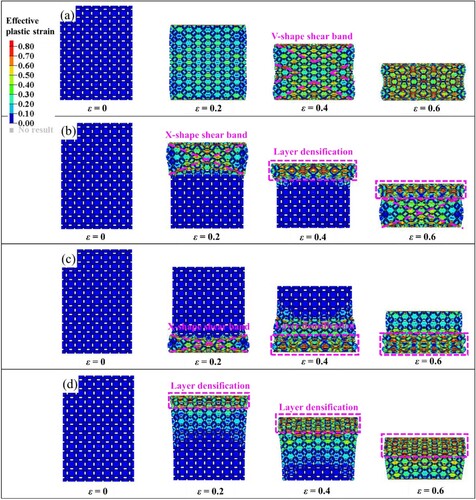
In contrast to uniform and low layer-number graded lattices with significant V-shaped and X-shaped shear bands, the six-layer graded lattice exhibits relatively different deformation modes, as shown in (d). Beginning with collapse bands in the top layer possessing the lowest density, lattice specimens progressively collapse in an approximate layer-by-layer manner. Such successive deformation behaviours may explain the gradual enhancement of plateau stress with increasing nominal strain (see in ). A Similar phenomenon has been widely reported in Refs. [Citation34,Citation36,Citation39] for the TPMS lattice structures featuring continuous gradients.
3.1.3. Energy absorption
Energy absorption refers to the ability of a material or structure to withstand external loads without catastrophic failure [Citation1]. FRD lattice structure possesses a prolonged, flat plateau stress stage under quasi-static compression ( (a)), which emulating an ideal energy absorber. The energy absorption capability, defined as the energy absorbed per unit volume up to densification point (), has become a critical metric for gauging the energy-absorbing applications of lattice structures, and it can be calculated as follows [Citation36]:
(7)
(7) where
is the nominal stress (
) related to nominal strain (
) and
is the densification strain.
In addition to , specific energy absorption (
), defined as the amount of energy absorbed per unit mass (typical units: J/g), is usually utilised to enable comparison across different energy absorber materials, which is given as follows [Citation1]:
(8)
(8) where
is the density of the lattice structure.
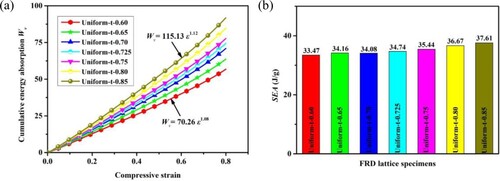
According to above-defined metrics, the calculated cumulative energy absorption per unit volume versus strain () curves and the
of uniform lattice structures are illustrated in . The
curves are also fitted using the power law equation, as presented in (a). The fitted exponent value is increased with increasing shell thickness (lattice density). Specifically, the fitted exponent values of specimens ‘Uniform-t-0.60’ and ‘Uniform-t-0.85’ are 1.08 and 1.12, respectively. Note that the correlation coefficients (
) for the fitted equations are both over 0.99. In general, a higher fitted exponent value corresponds to a more favourable energy absorption capability [Citation36]. Specific energy absorption (
) of uniform lattice specimens is also plotted in (b). Evidently,
tends to increase as the lattice density rises, exemplified by values of 33.47 and 37.61 J/g for shell thickness of 0.60 and 0.85 mm, respectively.
demonstrates a 12.37% increase for a shell thickness of 0.85 mm compared to 0.60 mm. As discussed, it can be concluded that the energy absorption capability of the FRD lattice can be improved by increasing the lattice density.
Figure 9. Energy absorption characteristics of uniform FRD lattices under quasi-static compression: (a) curves; and (b)
.
In addition, the of the investigated uniform lattices is beyond 33 J/g, which is larger than that of certain TPMS structures, including 12.78 J/g of the Primitive lattice [Citation8], 21.64 J/g for the Diamond lattice [Citation40], 21.41 J/g for the IWP lattice [Citation8], and 27.54 J/g for the Gyroid structure [Citation30]. At quasi-static strain rates, key factors affecting lattice structures’ energy absorption capacity encompass lattice base material properties, cell geometry, and the overall relative density [Citation1]. More advanced multiscale optimisation methods [Citation66–68] hold promise for enhancing the energy absorption capacity of lattice structures, which can be left as a topic for future investigations.
The stress–strain curves of various graded lattice specimens have been achieved in the previous Section 3.1.1; then the densification strain can be obtained based on Equations (4) and (5). Note that the densification strain values for lattice specimens ‘Graded-two-0.60-0.85’ and ‘Graded-two-0.65-0.80’ are 0.758 and 0.742, which are larger than the values for the uniform specimen with the same density (0.694). The cumulative energy absorption per unit volume versus strain () curves and the energy absorption capability (
) of uniform and graded lattice specimens are illustrated in . From
curves, it becomes apparent that the energy absorption performance of the uniform lattice slightly outperforms that of graded specimens up to a compressive strain of 0.70 ( (a)). Notice that the relative density of graded lattices is the same as that of uniform specimens.
Figure 10. Comparisons of uniform and graded FRD lattices under quasi-static compression: (a) curves; and (b) energy absorption capacity (
).
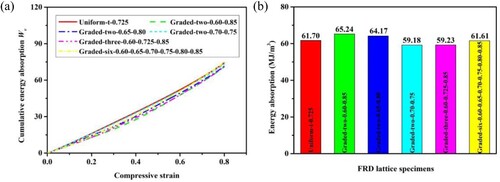
As for the total energy absorption capacity up to the densification point (), the difference between the uniform lattice and graded specimens is small ( (b)). Specifically, the maximum difference is only 5.74%. In other words, it is hard to effectively enhance the energy absorption performance of FRD lattices through changing the gradation configuration under quasi-static compression.
3.1.4. Constitutive model
From the nominal stress–strain curves of FRD lattices (see in (a)), it becomes apparent that the elastic deformation is quite small (elastic strain less than 1%), which can be ignored when focusing on energy absorption behaviours at large plastic deformation [Citation52]. Through carefully examining the variation trends of stress–strain curves, the rate-independent, rigid-plastic hardening (R-PH) idealisation model, as proposed by Zheng et al. [Citation43], is used to characterise the quasi-static stress–strain relationships, written as:
(9)
(9) where subscript
denotes nominal,
is the nominal initial crushing stress and
the strain hardening parameter.
For each lattice specimen at a particular relative density, the two material parameters, and
, can be obtained through the least squares fitting technique. The theoretical R-PH model is utilised to fit the nominal stress–strain data of the uniform lattice specimens, as shown in . It is evident that the R-PH idealisation model effectively captures the stress–strain relationships.
Figure 11. The nominal stress-strain data of the uniform lattice specimens fitted by the R-PH idealisation model.
The two material parameters of the R-PH model, and
, varying with the relative density of lattice structures are plotted in . Based upon Yang et al. [Citation69],
and
in the R-PH model can be usually expressed as the power-law function of relative density (
), given as follows:
(10)
(10) where
is the yield strength of base material (600.69 MPa here),
,
,
and
are material parameters.
Figure 12. and
varying with the relative density of lattice structures. Note that the fitted power-law equations are also plotted here.
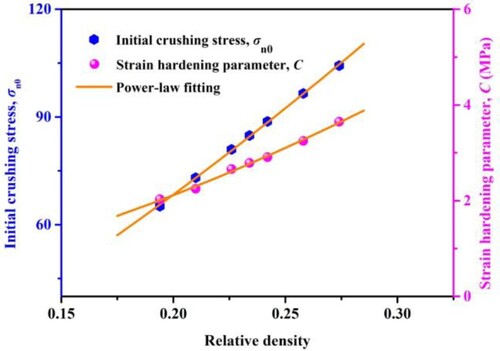
Similarly, the material parameters can be determined by applying the least squares fitting technique, specifically ,
,
and
. The correlation coefficients (
) for the fitted equations are over 0.99, meaning that the power-law equations have relatively high fitting precision (see in ).
Substituting Equation (10) into Equation (9), a unified constitutive model considering different relative densities is thus obtained to characterise the quasi-static stress–strain responses, mathematically written as:
(11)
(11)
3.2. Dynamic compressive mechanical characteristics
3.2.1. Deformation modes
It is well-known that loading velocity has a significant influence on the deformation modes of cellular materials, thereby affecting their dynamic constitutive behaviour [Citation29,Citation42,Citation43]. To investigate the dynamic compressive mechanical characteristics of FRD lattice structures, simulations were conducted with different constant loading velocities ranging from 1.8 to 270 m/s, corresponding to nominal strain-rates ranging from 20 to 3000 s−1, respectively. Note that the nominal strain-rate is defined as the ratio of the impact velocity to the original lattice height [Citation70].
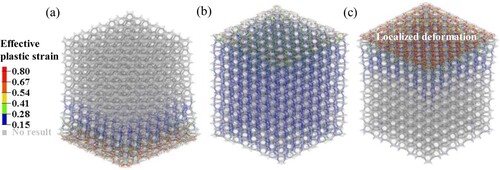
Taking lattice specimens ‘Uniform-t-0.75’ and ‘Graded-six-t-0.85-0.80-0.75-0.70-0.65-0.60’ for illustrations, 3D spatial deformation distributions at three different loading velocities (1.8, 135 and 225 m/s) are compared in and . Note that the effective plastic strain greater than 0.15 is shown here. It is apparent that at a loading velocity of 1.8 m/s, relatively uniform deformation is observed at a compressive strain of 0.20 ( (a)), resembling the quasi-static results. This deformation mode is usually termed the Homogenous Mode. At the high impact velocity of 225 m/s, the lattice specimens collapse layer-by-layer, forming a localised deformation band near the impact end ( (c)), which is termed the Shock Mode. When the impact velocity is applied among the above two scenarios, the deformation band tends to concentrate relatively towards the impact end, known as the Transition Mode. Significantly, the deformation modes of FRD lattice structures are crushing velocity dependent.
Figure 13. 3D spatial deformation distributions for lattice specimen ‘Uniform-t-0.75’ at three different loading velocities: (a) 1.8 m/s; (b) 135 m/s; and (c) 225 m/s. Note that the compressive strain is 0.20 here.
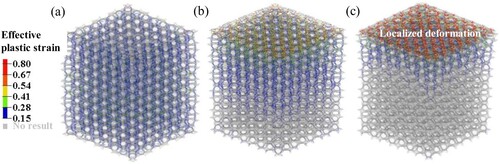
Figure 14. 3D spatial deformation distributions for lattice specimen ‘Graded-six-t-0.85-0.80-0.75-0.70-0.65-0.60’ at three different loading velocities: (a) 1.8 m/s; (b) 135 m/s; and (c) 225 m/s. Note the compressive nominal strain is 0.20 here.
From (a), it is evident that at a crushing velocity of 1.8 m/s, layer densification initiates first in the layer with the lowest density, consistent with the quasi-static results. When the crushing velocity is increased to 135 m/s, large plastic deformation occurs nearby the impact and support end ( (b)), which behaviours like ‘I’ shaped deformation bands. At a crushing velocity of 225 m/s, a significant localised deformation band forms in the layer with the highest density (the layer nearby the impact end) (see (c)), indicating the occurrence of Shock Mode. Evidently, the shock deformation band concentrates at the impact end, regardless of the density gradient configurations.
3.2.2. Stress-strain responses
The extracted stress–strain curves of lattice specimens ‘Uniform-t-0.75’ and ‘Graded-six-t-0.60-0.65-0.70-0.75-0.80-0.85’ at different strain-rates are plotted in and , respectively. For comparison, the quasi-static stress–strain curves are also presented here. It is clear that the compressive strength is gradually enhanced with the increase in strain-rate. At a nominal strain-rate of 2000 s−1, the stress at the impact end is much higher than that at the support end. This is usually considered as the shock enhancement phenomenon, which could be influenced by macro inertia effects [Citation47,Citation70].
Figure 15. Stress-strain curves of lattice specimen ‘Uniform-t-0.75’ at different strain-rates for two cases: (a) extracted at impact end and (b) extracted at support end.
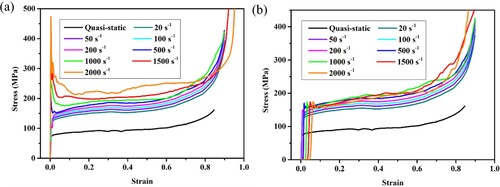
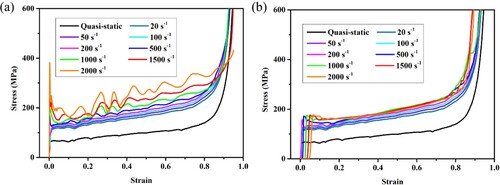
Figure 16. Stress-strain curves of lattice specimen ‘Graded-six-t-0.60-0.65-0.70-0.75-0.80-0.85’ at different strain-rates for two cases: (a) extracted at impact end and (b) extracted at support end.
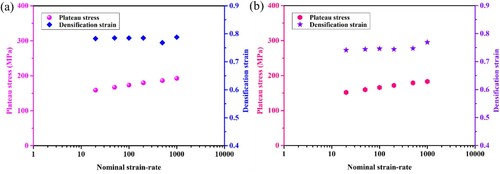
Based on the above energy-absorption efficiency method, the plateau stress and densification strain of the lattice specimens ‘Uniform-t-0.75’ and ‘Graded-six-t-0.60-0.65-0.70-0.75-0.80-0.85’ varying with the nominal strain-rates can be obtained, as shown in . Obviously, the plateau stress is increased with increasing nominal strain-rate. For the lattice specimen ‘Uniform-t-0.75’, the plateau stress at the strain-rates of 20 and 1000 s−1 is 158.83 and 192.53 MPa, which are approximately 70% and 106% higher than the quasi-static results (93.25 MPa). It is seen that the variation of the dynamic densification strain is slight at the strain-rate varying from 20 to 1000 s−1. The average dynamic densification strain of specimen ‘Uniform-t-0.75’ is 0.782 within the investigated strain-rates, which is larger than the quasi-static results (0.70), similar to Ref. [Citation30] for the Gyroid structures. Similar results can be obtained for the lattice ‘Graded-six-t-0.60-0.65-0.70-0.75-0.80-0.85’ and other specimens. In summary, FRD lattice under dynamic compression can hold larger densification strain at higher plateau strength, resulting in improved energy absorption capability. Consequently, the FRD lattice structure can be adopted as the effective energy-absorbing elements especially under high-speed impact applications. The dynamic enhancement mechanisms of FRD lattice structures will be detailed and discussed in the following section.
Figure 17. The plateau stress and densification strain varying with the nominal strain-rates: (a) ‘Uniform-t-0.75’; and (b) ‘Graded-six-t-0.60-0.65-0.70-0.75-0.80-0.85’.
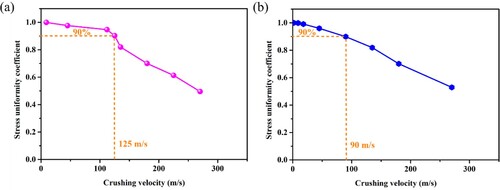
As discussed above, the deformation modes of lattice structures are loading velocity-dependency. If the loading velocity is high enough, the stress extracted at the impact will be larger than that at the support end. In this scenario, the deformation, stress and strain states become inhomogeneous [Citation30,Citation47]. To characterise the uniformity of cellular materials under dynamic loadings, Liu et al. [Citation71] proposed a uniformity coefficient to determine the critical velocity for mode transition from the Homogeneous Mode to the Transition Mode. The uniformity coefficient
is defined as
(12)
(12) where
and
are the plateau stress on the support end and impact end, respectively.
Based on Liu et al. [Citation71], the critical velocity is determined when the uniformity coefficient is reduced to 90%. Taking the uniform and graded lattice specimens ‘Uniform-t-0.75’ and ‘Graded-six-t-0.60-0.65-0.70-0.75-0.80-0.85’ for illustrations, the uniformity coefficient
varying with the impact velocity are plotted in . Taking the uniformity coefficient of 90% as a benchmark, the critical velocities for the uniform and graded lattices can be numerically obtained by using the dichotomy 125 and 90 m/s, respectively. Following this method, the critical velocities for the uniform lattice ‘Uniform-t-0.65’ and ‘Uniform-t-0.85’ can be also determined 120 and 132 m/s, respectively. It is thus concluded that the critical velocity is gradually increased with increasing relative density.
Figure 18. Stress uniformity coefficient varying with the crushing velocity: (a) ‘Uniform-t-0.75’; and (b) ‘Graded-six-t-0.60-0.65-0.70-0.75-0.80-0.85’.
3.2.3. Energy absorption
Based on the above critical velocity analysis, the uniformity coefficient is over 0.96 under the crushing velocity of 45 m/s (strain-rate of 500 s−1). In this case, the extracted forces are approximately balanced at the impact and support end. Taking this crush velocity as an example, the dynamic stress-stain curves and energy absorption of uniform and graded lattice specimens are presented in . It is seen that the average compressive strength of graded lattices is smaller than that of uniform specimen at the early plateau stage and then this trend of change will reverse at large compressive strain ( (a)). This is because the collapse deformation is initially starting from the weakest layer (the layer with the lowest density) for the graded lattice specimen, as similar to the quasi-static results. With the compressive plastic deformation proceeding, the role of the stronger layer (higher density) will become significant. Thus, the main reason for the stress-stain curve difference between uniform and graded lattices is the deformation modes.
Figure 19. The dynamic stress-stain responses (a) and energy absorption (b) of uniform and graded lattice specimens under the crushing velocity of 45 m/s.
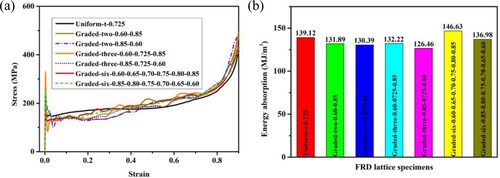
According to the above-mentioned energy efficiency-based approach, the densification strain of uniform and graded lattice specimens can be determined. And then, the energy absorption () for different lattice specimens is calculated, as plotted in (b). It is found that the energy absorption capability of the investigated graded lattices is close to that of uniform specimen. Specifically, the energy absorption of the graded lattice specimen ‘Graded-six-t-0.60-0.65-0.70-0.75-0.80-0.85’ is 146.63 MJ/m3, which is 5.40% higher than that of uniform specimen ‘Uniform-t-0.725’ (139.12 MJ/m3). However, the energy absorption of the investigated other graded lattices is smaller than that of the uniform specimen. Hence, it can be concluded that the energy absorption performance cannot be effectively enhanced through changing the gradation configuration under medium strain-rates.
Another typical application scenario for the metallic lattice structures is adopted as the efficient energy-absorbing elements in the explosion-proof field [Citation34,Citation39]. Generally, the loading rate induced by blast loading could be more than 200 m/s [Citation49]. The loading rate is adopted as 270 m/s here. The dynamic stress-stain responses of uniform and graded lattice specimens extracted at the impact end and support end are plotted in . It is seen that the initial compressive stress is mainly determined by the first lattice layer at the early compressive stage, as shown in (a). As is well known, the lattice with a thinner sheet thickness would possess a lower compressive strength. Thus, the graded specimens with the same layer thickness near the impact end yield almost the same compressive strength up to the strain of 0.20. Moreover, the oscillation of compression stress is remarkable for the graded specimens with the positive gradient configurations (the sheet thickness increased gradually from the impact end to the support end).
Figure 20. The dynamic stress-stain responses of uniform and graded lattice specimens under the crushing velocity of 270 m/s: (a) impact end; and (b) support end.
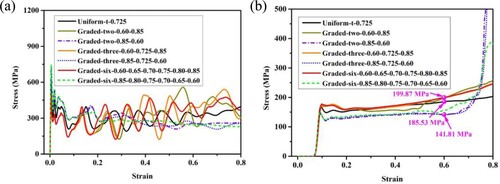
From the stress–strain curves extracted at the support end ( (b)), it is found that the graded lattices with the last layer adopting the thinnest sheet thickness produce the lowest compressive stress at the support end. Specifically, the compress strength is about 141.81 MPa at the relative high strain of 0.60 for the graded specimens ‘Graded-two-0.85-0.60’ and ‘Graded-three-0.85-0.725-0.60’, which is 22.73% lower than the uniform specimen ‘Uniform-t-0.725’ (185.53 MPa). Thus, it is indicated that at a relatively large plastic deformation, the graded lattices with negative gradients yield a smaller compressive strength at the support end relative to the uniform and graded specimens with positive gradients. In this case, the graded lattices with negative gradient exhibit some advantage in the explosion-proof fields, such as being the core in sandwich structures [Citation34,Citation39]. However, once the plastic deformation reaches the densification stage, the negative gradation could not minimise the compressive strength at the support end.
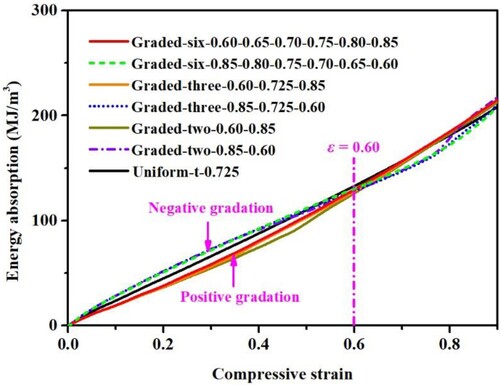
The cumulative energy absorption versus compressive strain for the investigated lattice specimens at the crushing velocity of 270 m/s are shown in . It can be seen that the graded lattices with negative gradient could absorb more shock energy than the uniform and graded specimens with positive gradient before the compressive strain of 0.60. And then, the benefit of the graded lattices with negative gradation is gradually diminished with increasing compressive strain. The energy absorption performance of graded lattices with positive gradation exhibits a certain advantage over the lattices with negative gradation at the larger stain, such as . As discussed above, plastic deformation and energy absorption capacity are two critical factors in choosing the proper gradient of graded lattice structures to be applied in the impact/blast protection fields.
Figure 21. The energy absorption capacity versus compressive strain for the uniform and graded lattice specimens.
3.2.4. Dynamic enhancement mechanisms
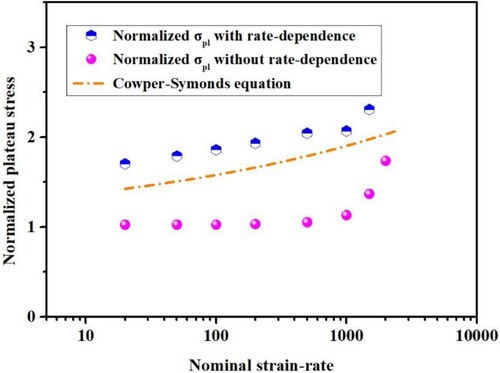
As discussed above, FRD lattice structures exhibit significant stress enhancement phenomenon at dynamic compressive loadings with respect to the quasi-static results. Previous studies have pointed out that the strain-rate sensitivity of base materials and inertia effect are the dominated factors to cause stress enhancement of metallic cellular materials [Citation47,Citation70]. The numerical simulation approach has proven a convenient way to decouple these two effects [Citation42].
Taking the uniform lattice specimen ‘Uniform-t-0.75’ as an example, the dynamic plateau strength normalised by the quasi-static data as well as the lattice base rate-dependence itself varying with nominal strain-rate are presented in . For the lattice base material without strain-rate dependence, the value of the normalised is almost kept 1 at the medium strain-rates varies from 20 to 500 s−1, indicating negligible inertia effect within this strain-rate range. However, the normalised
of the lattice base with strain-rate dependence is gradually improved with increasing nominal strain-rate. This reveals that the strain-rate dependence of lattice base material dominates in the plateau strength enhancement under medium strain-rate conditions (20 to 500 s−1). Moreover, the lattice with the base material rate-dependence exhibits a more significant strain-rate sensitivity when compared with the lattice base material itself (Cowper–Symonds equation).
Figure 22. Strain-rate sensitivity of the plateau stress for the lattice ‘Uniform-t-0.75’ with/without base rate-dependence in comparison with the lattice base rate-dependence itself.
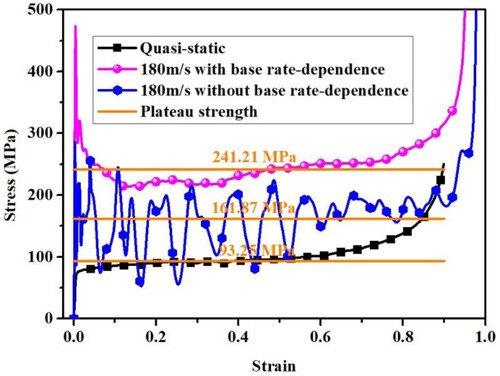
Under high strain-rate conditions, the deformation mode is transformed from Transition Mode to Shock Mode, and the stress is greatly improved compared to the quasi-static result. The compressive nominal stress–strain curves of the uniform lattice specimen ‘Uniform-t-0.75’ under the loading velocity of 180 m/s are plotted in . Note that the plateau stresses are also calculated based on the energy-absorption efficiency method and then plotted here. When the strain-rate is enhanced to 2000 s−1 (180 m/s), the plateau strength is 241.21 and 161.87 MPa with and without considering the lattice base rate-dependence, which is 2.59 and 1.74 times higher than the quasi-static data (93.25 MPa) respectively. Consequently, the inertia effect becomes significant and can not be ignored under high-velocity loadings (see in ). Generally, the difference in the stress–strain relations for cellular materials results from the different deformation modes [Citation43]. The main cause is the layer-by-layer collapse deformation and strain localisation under high strain-rates, which is fairly different from the results under medium loading rates [Citation30]. In this course, and the stress enhancement is a joint effect of the lattice base strain-rate dependence and macro inertia.
Figure 23. Compressive stress-strain curves of lattice specimen ‘Uniform-t-0.75’ under the loading velocity of 180 m/s.
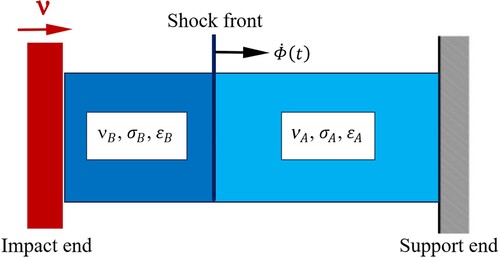
The shock wave will be generated and propagated from the impact end to the support end when the lattice structures are subjected to a high impact velocity [Citation30]. A typical one-dimensional shock wave model with the basic material parameters is illustrated in . Based on the continuum-based stress wave theory [Citation43,Citation72], the conservation relations of mass and momentum across the shock front are obtained as follows
(13)
(13) and
(14)
(14) where
is the shock-front speed,
and
are the physical quantities (velocity, strain and stress) ahead of the shock front and those behind the shock front.
Figure 24. Shock wave model with the basic material parameters.
Combining Equations (13) and (14), the stress behind the shock front can be obtained:
(15)
(15) Based on a rigid-perfectly plastic-locking (R-PP-L) idealisation shock model proposed by Reid and Peng [Citation73], the material ahead of the shock wavefront was assumed to be at rest, with the deformation
, particle velocity
and a constant plateau stress
; while the material behind the shock wavefront was assumed to be thoroughly compacted, with the densification strain (locking strain
)
, particle velocity
and the plateau stress level
. Note that the particle velocity behind the shock wavefront region is approximated as the impact velocity
. Thus, the dynamic plateau stress at the loading end can be expressed in the following form [Citation73]:
(16)
(16)
Taking the uniform lattice specimen ‘Uniform-t-0.75’ as an instance, the plateau stress and densification strain are 93.25 MPa and 0.70 at quasi-static states. Based on Equation (16), the determined theoretical dynamic plateau stresses at the impact end are 178.28 MPa, 226.10 MPa and 284.56 MPa for the three crushing velocities of 180, 225 and 270 m/s, respectively.
The extracted stress-stain curves of lattice specimen ‘Uniform-t-0.75’ under three different crushing velocities of 180, 225 and 270 m/s are illustrated in . Utilising the energy-absorption efficiency method described above, this study successfully determined the dynamic plateau stresses at the impact end to be 241.21, 272.76, and 333.63 MPa ( (a)). Obviously, the numerical data are higher than the theoretical results. The relative errors between the theoretical predictions and actual numerical results are 26.09%, 17.11% and 14.71%, respectively. This indicates that the quasi-static properties only provide a rough prediction of the dynamic shock stress. The essential reason is that the strain-rate dependence of the lattice base material is not considered in quasi-static results. In fact, the dynamic stress and strain states (plateau tress and densification strain) of the FRD lattice are pretty different from those in the quasi-static states ( and ).
Figure 25. Stress-strain curves of lattice specimen ‘Uniform-t-0.75’ under three different crushing velocities of 180, 225 and 270 m/s for two cases: (a) extracted at impact end and (b) extracted at support end.
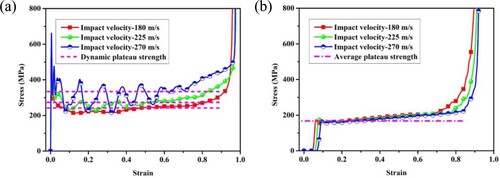
From (b), it can be seen that the plateau stress at the support end is almost the same for the three considered crushing velocities, indicating that the plateau stress at the support end is almost independent of the crushing velocity. The average the dynamic plateau strength and densification strain at the support end is 167.5 MPa and 0.77. Note that the dynamic material parameters are achieved by considering the strain-rate dependence of the lattice base material. If the shock plateau strength is calculated based on the dynamic properties, the theoretical Equation (16) can be thus re-written in the following form:
(17)
(17) where
and
are the dynamic plateau strength and densification strain at the support end, respectively.
According to Equation (17), the theoretical dynamic plateau stresses at the impact end have been calculated for the three investigated crushing velocities (180, 225, and 270 m/s) as follows: 244.80, 288.28, and 341.42 MPa. The relative errors between the theoretical predictions and numerical results are 1.49%, 5.69% and 2.33%, respectively. This means the proposed empirical model based on the shock wave theory yields close predictions to the numerical results. Thus, the dynamic stress–strain states need to be applied to predict the stress–strain responses at the shock velocities accurately.
3.2.5. Constitutive model with strain-rates
From and , it can be seen that the profile of the dynamic stress–strain curves under high strain-rates is quite different from that of results under medium strain-rates. The extracted stresses at the impact and support end are not equal when Shock Mode occurs under high strain-rates. While under medium strain-rates (20 to 500 s−1), these extracted stresses are almost equal, indicating that the deformation modes are the Homogenous Mode within the investigated strain-rate range. This section aims at proposing the dynamic constitutive models so as to provide guidance on the energy-absorbing applications of lattice structures under medium strain-rate conditions, such as crash absorbers in the automotive industry [Citation74].
To accurately characterise the dynamic stress–strain relationships of metallic foams, Zheng et al. [Citation43] proposed a dynamic rigid-plastic hardening idealisation model to describe the plastic hardening behaviour given by.
(18)
(18) where
is the dynamic initial crush stress and
is a fitting material parameter. For convenience, this model is donated as the D-R-PH idealisation here.
Taking the uniform lattice specimen ‘Uniform-t-0.75’ as an example, the R-PH and D-R-PH idealisation models are utilised to fit the numerical nominal stress–strain relationships at medium strain-rates, as plotted in (a). The correlation coefficients for the fitted R-PH and D-R-PH idealisation model are both over 0.93, which means that the dynamic stress–strain responses can be well depicted by using the D-R-PH model. Suppose the dynamic material parameters ( and
) can be well expressed as functions of the quasi-static parameters (
and
) and nominal strain-rate (
). In that case, the theoretical constitutive model with strain-rates will be obtained. In this regard, the constitutive model can be given:
(19)
(19)
Figure 26. Constitutive model characterization of the lattice specimen ‘Uniform-t-0.75’: (a) stress-strain curves fitted by the R-PH and D-R-PH model; and (b) the normalised material parameters varying with the investigated strain-rate.
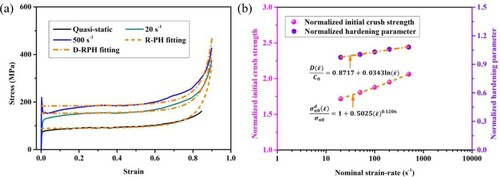
Further, the normalised initial crush strength (the ratio between the dynamic and static stresses) can be well described by [Citation75]:
(20)
(20) where
and
are the fitting material parameters, respectively.
Based on Wang et al. [Citation63], the normalised hardening parameter can be properly described in the following equation:
(21)
(21) where
and
are the fitting material parameters. Note that
and
are the fitting material parameters at quasi-static.
The normalised dynamic material parameters versus the investigated strain-rate are plotted in (b). The correlation coefficients for the fitted equations (Equations (20) and (21)) are both over 0.99. This indicates that the above two defined equations can well characterise the relationships between the normalised material parameters (,
) and the strain-rate (
). Specifically, the fitting parameters of
,
,
and
are 0.5025, 0.1206, 0.8717 and 0.0343 for the investigated uniform FRD lattice specimen here.
Substituting Equations (20) and (21) into Equation (19), the dynamic constitutive model under medium strain-rates can be thus obtained:
(22)
(22)
As for the graded lattice specimen ‘Graded-six-t-0.60-0.65-0.70-0.75-0.80-0.85’, linear hardening and continuous hardening phenomenon are observed in the stress plateau and densification stage, respectively, which is quite different from the hardening behaviour for the uniform specimens. To take this into account, we propose a dynamic rigid-linear-plastic hardening model to characterise the stress–strain responses of graded lattices under medium strain-rates, viz.
(23)
(23) where
and
are the hardening modulus at the plateau stage and strain hardening parameter, respectively;
and
are the dynamic stresses at the initial crush and densification point; and their relationship is
. Note that the elastic deformation is also ignored here. For convenience, this model will be referred to as the D-R-LPH idealisation here.
The D-R-LPH idealisation models are utilised to fit the numerical nominal stress–strain relationships at medium strain-rates, as plotted in (a). Significantly, the proposed D-R-LPH idealisation model can well reproduce the dynamic stress–strain response at different strain-rates. Following the above method, the dynamic material parameters ,
and
are also normalised using the quasi-static results. The normalised dynamic material parameters versus with the investigated strain-rate are plotted in (b). Through trial and comparison, the relationships of the normalised parameters and strain-rate (
) can be properly described by:
(24)
(24)
(25)
(25)
(26)
(26) where
,
and
are the quasi-static fitting material parameters using Equation (23);
,
,
,
,
and
are the fitting parameters.
Figure 27. Constitutive model characterization of the lattice specimen ‘Graded-six-t-0.60-0.65-0.70-0.75-0.80-0.85’: (a) stress-strain curves fitted by the D-R-LPH model; and (b) the normalised material parameters varying with the investigated strain-rate.
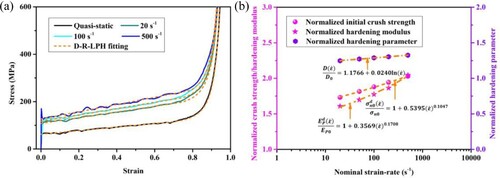
From (b), it can be found that the above three defined equations can well characterise the relationships between the normalised material parameters and the strain-rate. Specifically, the fitting parameters of,
,
,
,
and
are 0.5395, 0.1047, 0.3569, 0.1708, 1.1766 and 0.0240 for the investigated graded FRD lattice here.
Substituting Equations (24)-(26) into Equation (23), a unified expression is thus obtained to describe the dynamic stress–strain responses for the graded lattices, viz.
(27)
(27) where
; and
can be selected as the average densification strain at medium strain-rates.
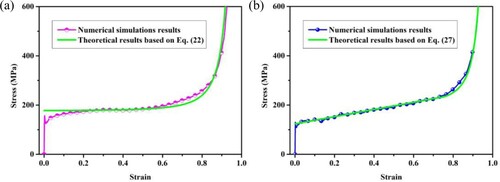
Further, the numerical simulations for the crushing velocity of 27 m/s () are also performed to validate the accuracy of the proposed theoretical constitutive models with strain-rates (see Equations (22) and (27)). The numerical and theoretical results are compared in . Obviously, the numerical results could be well captured by the theoretical results, indicating that the proposed theoretical constitutive models are of high accuracy in predicting the dynamic stress–strain responses of uniform and graded lattices.
Figure 28. Comparisons of the theoretical and numerical results under the crushing velocity of 27 m/s: (a) ‘Uniform-t-0.75’; and (b) ‘Graded-six-t-0.60-0.65-0.70-0.75-0.80-0.85’.
4. Conclusions
In this study, the crushing characteristics of uniform and graded TPMS lattice structures at a broader range of strain-rates (quasi-static to 3000 s−1) are investigated by using finite element methodology. Stress–strain responses, deformation modes, energy absorption and constitutive model of uniform and graded lattices are discussed and analysed in detail. The main conclusions can be drawn as follows:
Under quasi-static compression, multiple plateau stress phase phenomenon is observed on the stress–strain curves of graded lattices and these curves become smoother with increasing graded layer number. The collapse bands of graded lattices are formed from the weakest layer to the strongest layer regardless of the gradation configurations. It is found that the energy absorption capacity cannot be effectively enhanced through changing the gradation configurations. A constitutive model is built for predicting the quasi-static stress–strain responses.
With regard to dynamic compression, the shock deformation band is found concentrated at the impact end regardless of gradient types. The critical velocity for the mode transition from Homogeneous Mode to Transition Mode gradually increases with increasing lattice density. Larger densification strain at higher plateau strength is observed on the dynamic stress–strain curves relative to the quasi-static results. The design of graded lattices is suggested to consider plastic deformation and energy absorption. Numerical results reveal that the strain-rate dependence of lattice base material is the main cause of the strength enhancement under medium strain-rate, while the role of the inertia effect is notable at higher strain-rates. An empirical model is introduced based on the dynamic stress–strain states that can accurately predict the shock stress responses. And finally, the constitutive models involving strain rate-dependence are proposed for the uniform and graded lattices. It needs be mentioned that the constitutive modelling approach is not limited to the FRD lattice and can be potentially applied to other cellular materials.
Disclosure statement
No potential conflict of interest was reported by the author(s).
Data availability statement
Data available on request from the authors.
Additional information
Funding
References
- du Plessis A, Razavi N, Benedetti M, et al. Properties and applications of additively manufactured metallic cellular materials: a review. Prog Mater Sci. 2022;125:100918. doi:10.1016/j.pmatsci.2021.100918
- Jadhav PH, Gnanasekaran N. Optimum design of heat exchanging device for efficient heat absorption using high porosity metal foams. Int Commun Heat Mass Transfer. 2021;126:105475. doi:10.1016/j.icheatmasstransfer.2021.105475
- Wu Y, Fang J, Wu C, et al. Additively manufactured materials and structures: a state-of-the-art review on their mechanical characteristics and energy absorption. Int J Mech Sci. 2023;246:108102. doi:10.1016/j.ijmecsci.2023.108102
- Yao R, Pang T, Zhang B, et al. On the crashworthiness of thin-walled multi-cell structures and materials: State of the art and prospects. Thin-Walled Struct. 2023;189:110734. doi:10.1016/j.tws.2023.110734
- Yin H, Zhang W, Zhu L, et al. Review on lattice structures for energy absorption properties. Compos Struct. 2023;304:116397. doi:10.1016/j.compstruct.2022.116397
- Gibson LJ, Ashby MF. Cellular solids: structure and properties. Cambridge: Cambridge University Press; 1997.
- Evans AG, Hutchinson JW, Fleck NA, et al. The topological design of multifunctional cellular metals. Prog Mater Sci. 2001;46:309–327. doi:10.1016/S0079-6425(00)00016-5
- Yin H, Liu Z, Dai J, et al. Crushing behavior and optimization of sheet-based 3D periodic cellular structures. Compos Part B: Eng. 2020;182:107565. doi:10.1016/j.compositesb.2019.107565
- Wang E, Yao R, Li Q, et al. Lightweight metallic cellular materials: a systematic review on mechanical characteristics and engineering applications. Int J Mech Sci. 2023:108795. doi:10.1016/j.ijmecsci.2023.108795
- Benedetti M, du Plessis A, Ritchie RO, et al. Architected cellular materials: a review on their mechanical properties towards fatigue-tolerant design and fabrication. Mater Sci Eng: R: Rep. 2021;144:100606. doi:10.1016/j.mser.2021.100606
- Sun Y, Li QM. Dynamic compressive behaviour of cellular materials: a review of phenomenon, mechanism and modelling. Int J Impact Eng. 2018;112:74–115. doi:10.1016/j.ijimpeng.2017.10.006
- Li X, Tan YH, Wang P, et al. Metallic microlattice and epoxy interpenetrating phase composites: Experimental and simulation studies on superior mechanical properties and their mechanisms. Compos Part A: Appl Sci Manuf. 2020;135:105934. doi:10.1016/j.compositesa.2020.105934
- Tancogne-Dejean T, Spierings AB, Mohr D. Additively-manufactured metallic micro-lattice materials for high specific energy absorption under static and dynamic loading. Acta Mater. 2016;116:14–28. doi:10.1016/j.actamat.2016.05.054
- Wang E, Chen C, Zhang G, et al. Multiaxial mechanical characterization of additively manufactured open-cell Kelvin foams. Compos Struct. 2023;305:116505. doi:10.1016/j.compstruct.2022.116505
- Cao X, Duan S, Liang J, et al. Mechanical properties of an improved 3D-printed rhombic dodecahedron stainless steel lattice structure of variable cross section. Int J Mech Sci. 2018;145:53–63. doi:10.1016/j.ijmecsci.2018.07.006
- Cao X, Xiao D, Li Y, et al. Dynamic compressive behavior of a modified additively manufactured rhombic dodecahedron 316L stainless steel lattice structure. Thin-Walled Struct. 2020b;148:106586. doi:10.1016/j.tws.2019.106586
- Guo X, Ding J, Li X, et al. Interpenetrating phase composites with 3D printed triply periodic minimal surface (TPMS) lattice structures. Compos Part B: Eng. 2023a;248:110351.
- Guo X, Li X, Wang E, et al. Bioinspired hierarchical diamond triply periodic minimal surface lattices with high energy absorption and damage tolerance. Addit Manuf. 2023b;76:103792. doi:10.1016/j.addma.2023.103792
- Wang H, Tan D, Liu Z, et al. On crashworthiness of novel porous structure based on composite TPMS structures. Eng Struct. 2022;252:113640. doi:10.1016/j.engstruct.2021.113640
- Han L, Che S. An overview of materials with triply periodic minimal surfaces and related geometry: from biological structures to self-assembled systems. Adv Mater. 2018;30:1705708. doi:10.1002/adma.201705708
- Bonatti C, Mohr D. Mechanical performance of additively-manufactured anisotropic and isotropic smooth shell-lattice materials: Simulations & experiments. J Mech Phys Solids. 2019;122:1–26. doi:10.1016/j.jmps.2018.08.022
- Feng G, Li S, Xiao L, et al. Mechanical properties and deformation behavior of functionally graded TPMS structures under static and dynamic loading. Int J Impact Eng. 2023;176:104554. doi:10.1016/j.ijimpeng.2023.104554
- Yin H, Guo D, Wen G, et al. On bending crashworthiness of smooth-shell lattice-filled structures. Thin-Walled Struct. 2022;171:108800. doi:10.1016/j.tws.2021.108800
- Zhao M, Liu F, Fu G, et al. Improved Mechanical Properties and Energy Absorption of BCC Lattice Structures with Triply Periodic Minimal Surfaces Fabricated by SLM. Materials. 2018;11:2411. doi:10.3390/ma11122411
- Al-Ketan O, Rowshan R, Abu Al-Rub RK. Topology-mechanical property relationship of 3D printed strut, skeletal, and sheet based periodic metallic cellular materials. Addit Manuf. 2018;19:167–183. doi:10.1016/j.addma.2017.12.006
- Al-Ketan O, Rowshan R, Palazotto AN, et al. On mechanical properties of cellular steel solids with shell-like periodic architectures fabricated by selective laser sintering. J Eng Mater Technol. 2019;141:021009. doi:10.1115/1.4041874
- Al-Ketan O, Soliman A, AlQubaisi AM, et al. Nature-inspired lightweight cellular co-continuous composites with architected periodic gyroidal structures. Adv Eng Mater. 2018;20:1700549. doi:10.1002/adem.201700549
- Guo X, Ding J, Li X, et al. Enhancement in the mechanical behaviour of a Schwarz Primitive periodic minimal surface lattice structure design. Int J Mech Sci. 2022;216:106977. doi:10.1016/j.ijmecsci.2021.106977
- Ha NS, Pham TM, Vo NH, et al. Dynamic crushing characteristics of bio-inspired minimal surface primitive structures. Compos Struct. 2023;304:116438. doi:10.1016/j.compstruct.2022.116438
- Li X, Xiao L, Song W. Compressive behavior of selective laser melting printed Gyroid structures under dynamic loading. Addit Manuf. 2021;46:102054. doi:10.1016/j.addma.2021.102054
- Zhang L, Feih S, Daynes S, et al. Energy absorption characteristics of metallic triply periodic minimal surface sheet structures under compressive loading. Addit Manuf. 2018;23:505–515. doi:10.1016/j.addma.2018.08.007
- Zhang J, Chen X, Sun Y, et al. Design of a biomimetic graded TPMS scaffold with quantitatively adjustable pore size. Mater Des. 2022; 218:110665. doi:10.1016/j.matdes.2022.110665
- Nguyen-Xuan H, Tran KQ, Thai CH, et al. Modelling of functionally graded triply periodic minimal surface (FG-TPMS) plates. Compos Struct. 2023;315:116981. doi:10.1016/j.compstruct.2023.116981
- Novak N, Borovinšek M, Al-Ketan O, et al. Impact and blast resistance of uniform and graded sandwich panels with TPMS cellular structures. Compos Struct. 2022;300:116174. doi:10.1016/j.compstruct.2022.116174
- Al-Ketan O, Lee D-W, Rowshan R, et al. Functionally graded and multi-morphology sheet TPMS lattices: Design, manufacturing, and mechanical properties. J Mech Behav Biomed Mater. 2020;102:103520. doi:10.1016/j.jmbbm.2019.103520
- Zhao M, Zhang DZ, Liu F, et al. Mechanical and energy absorption characteristics of additively manufactured functionally graded sheet lattice structures with minimal surfaces. Int J Mech Sci. 2020;167:105262. doi:10.1016/j.ijmecsci.2019.105262
- Qiu N, Zhang J, Li C, et al. Mechanical properties of three-dimensional functionally graded triply periodic minimum surface structures. Int J Mech Sci. 2023;246:108118. doi:10.1016/j.ijmecsci.2023.108118
- Zhang C, Zheng H, Yang L, et al. Mechanical responses of sheet-based gyroid-type triply periodic minimal surface lattice structures fabricated using selective laser melting. Mater Des. 2022;214:110407. doi:10.1016/j.matdes.2022.110407
- Peng C, Tran P. Bioinspired functionally graded gyroid sandwich panel subjected to impulsive loadings. Compos Part B. Eng. 2020;188:107773.
- Santiago R, Ramos H, AlMahri S, et al. Modelling and optimisation of TPMS-based lattices subjected to high strain-rate impact loadings. Int J Impact Eng. 2023;177:104592. doi:10.1016/j.ijimpeng.2023.104592
- Gümrük R, Mines RAW, Karadeniz S. Determination of strain rate sensitivity of micro-struts manufactured using the selective laser melting method. J Mater Eng Perform. 2018;27:1016–1032. doi:10.1007/s11665-018-3208-y
- Li L, Xue P, Luo G. A numerical study on deformation mode and strength enhancement of metal foam under dynamic loading. Mater Des. 2016;110:72–79. doi:10.1016/j.matdes.2016.07.123
- Zheng Z, Wang C, Yu J, et al. Dynamic stress–strain states for metal foams using a 3D cellular model. J Mech Phys Solids. 2014;72:93–114. doi:10.1016/j.jmps.2014.07.013
- AlMahri S, Santiago R, Lee D-W, et al. Evaluation of the dynamic response of triply periodic minimal surfaces subjected to high strain-rate compression. Addit Manuf. 2021;46:102220. doi:10.1016/j.addma.2021.102220
- Lee S, Barthelat F, Moldovan N, et al. Deformation rate effects on failure modes of open-cell Al foams and textile cellular materials. Int J Solids Struct. 2006;43:53–73. doi:10.1016/j.ijsolstr.2005.06.101
- Tancogne-Dejean T, Mohr D. Stiffness and specific energy absorption of additively-manufactured metallic BCC metamaterials composed of tapered beams. Int J Mech Sci. 2018;141:101–116. doi:10.1016/j.ijmecsci.2018.03.027
- Wang E, Sun G, Zheng G, et al. On multiaxial failure behavior of closed-cell aluminum foams under medium strain rates. Thin-Walled Struct. 2021;160:107278. doi:10.1016/j.tws.2020.107278
- Wang P, Xu S, Li Z, et al. Experimental investigation on the strain-rate effect and inertia effect of closed-cell aluminum foam subjected to dynamic loading. Mater Sci Eng A. 2015;620:253–261. doi:10.1016/j.msea.2014.10.026
- Chen J, Zhang P, Cheng Y, et al. On the crushing response of the functionally graded metallic foams based on 3D Voronoi model. Thin-Walled Struct. 2020;157:107085. doi:10.1016/j.tws.2020.107085
- Duan Y, Du B, Shi X, et al. Quasi-static and dynamic compressive properties and deformation mechanisms of 3D printed polymeric cellular structures with Kelvin cells. Int J Impact Eng. 2019;132:103303. doi:10.1016/j.ijimpeng.2019.05.017
- Novak N, Kytyr D, Rada V, et al. Compression behaviour of TPMS-filled stainless steel tubes. Mater Sci Eng A. 2022;852:143680. doi:10.1016/j.msea.2022.143680
- Zhu C, Zheng Z, Wang S, et al. Modification and verification of the Deshpande–Fleck foam model: A variable ellipticity. Int J Mech Sci. 2019;151:331–342. doi:10.1016/j.ijmecsci.2018.11.028
- Santosa SP, Wierzbicki T, Hanssen AG, et al. Experimental and numerical studies of foam-filled sections. Int J Impact Eng. 2000;24:509–534. doi:10.1016/S0734-743X(99)00036-6
- Li Q, Zhi X, Fan F. Dynamic crushing of uniform and functionally graded origami-inspired cellular structure fabricated by SLM. Eng Struct. 2022a;262:114327. doi:10.1016/j.engstruct.2022.114327
- Li Q, Zhi X, Fan F. Quasi-static compressive behaviour of 3D-printed origami-inspired cellular structure: experimental, numerical and theoretical studies. Virtual Phys Prototyp. 2022b;17:69–91. doi:10.1080/17452759.2021.1987051
- Sun ZP, Guo YB, Shim VPW. Influence of printing direction on the dynamic response of additively-manufactured polymeric materials and lattices. Int J Impact Eng. 2022;167:104263. doi:10.1016/j.ijimpeng.2022.104263
- Morrish SJN, Pedersen M, Wong KFW, et al. Size effects in compression in Electron Beam Melted Ti6Al4 V diamond structure lattices. Mater Lett. 2017;190:138–142. doi:10.1016/j.matlet.2016.12.130
- Lu C, Zhang Y, Aziz M, et al. Mechanical behaviors of multidimensional gradient gyroid structures under static and dynamic loading: a numerical and experimental study. Addit Manuf. 2022;59:103187. doi:10.1016/j.addma.2022.103187
- McKown S, Shen Y, Brookes WK, et al. The quasi-static and blast loading response of lattice structures. Int J Impact Eng. 2008;35:795–810. doi:10.1016/j.ijimpeng.2007.10.005
- Montazerian H, Davoodi E, Asadi-Eydivand M, et al. Porous scaffold internal architecture design based on minimal surfaces: a compromise between permeability and elastic properties. Mater Des. 2017;126:98–114. doi:10.1016/j.matdes.2017.04.009
- Rashed MG, Ashraf M, Mines RAW, et al. Metallic microlattice materials: a current state of the art on manufacturing, mechanical properties and applications. Mater Des. 2016;95:518–533. doi:10.1016/j.matdes.2016.01.146
- Sun G, Wang E, Zhao T, et al. Inverse identification of cell-wall material properties of closed-cell aluminum foams based upon Vickers nano-indentation tests. Int J Mech Sci. 2020;176:105524. doi:10.1016/j.ijmecsci.2020.105524
- Wang E, Yao R, Luo Q, et al. High-temperature and dynamic mechanical characterization of closed-cell aluminum foams. Int J Mech Sci. 2022;230:107548. doi:10.1016/j.ijmecsci.2022.107548
- Wang Z, Shen J, Lu G, et al. Compressive behavior of closed-cell aluminum alloy foams at medium strain rates. Mater Sci Eng A. 2011;528:2326–2330. doi:10.1016/j.msea.2010.12.059
- Maskery I, Aboulkhair NT, Aremu AO, et al. A mechanical property evaluation of graded density Al-Si10-Mg lattice structures manufactured by selective laser melting. Mater Sci Eng A. 2016;670:264–274. doi:10.1016/j.msea.2016.06.013
- Liu H, Chen L, Jiang Y, et al. Multiscale optimization of additively manufactured graded non-stochastic and stochastic lattice structures. Compos Struct. 2023;305:116546. doi:10.1016/j.compstruct.2022.116546
- Liu X, Gao L, Xiao M. Multiscale concurrent topology optimization of hierarchal multi-morphology lattice structures. Comput Methods Appl Mech Eng. 2023;415:116209. doi:10.1016/j.cma.2023.116209
- Zhao M, Li X, Zhang DZ, et al. TPMS-based interpenetrating lattice structures: design, mechanical properties and multiscale optimization. Int J Mech Sci. 2023;244:108092. doi:10.1016/j.ijmecsci.2022.108092
- Yang J, Wang S, Ding Y, et al. Crashworthiness of graded cellular materials: a design strategy based on a nonlinear plastic shock model. Mater Sci Eng A. 2017;680:411–420. doi:10.1016/j.msea.2016.11.010
- Sun Y, Li QM, Lowe T, et al. Investigation of strain-rate effect on the compressive behaviour of closed-cell aluminium foam by 3D image-based modelling. Mater Des. 2016;89:215–224. doi:10.1016/j.matdes.2015.09.109
- Liu YD, Yu JL, Zheng ZJ, et al. A numerical study on the rate sensitivity of cellular metals. Int J Solids Struct. 2009;46:3988–3998. doi:10.1016/j.ijsolstr.2009.07.024
- Wang L. Foundations of stress waves. Amsterdam: Elsevier; 2011.
- Reid SR, Peng C. Dynamic uniaxial crushing of wood. Int J Impact Eng. 1997;19:531–570. doi:10.1016/S0734-743X(97)00016-X
- Wang C, Li Y, Zhao W, et al. Structure design and multi-objective optimization of a novel crash box based on biomimetic structure. Int J Mech Sci. 2018;138-139:489–501.
- Shen J, Lu G, Ruan D. Compressive behaviour of closed-cell aluminium foams at high strain rates. Compos Part B: Eng. 2010;41:678–685. doi:10.1016/j.compositesb.2010.07.005
