
 ?Mathematical formulae have been encoded as MathML and are displayed in this HTML version using MathJax in order to improve their display. Uncheck the box to turn MathJax off. This feature requires Javascript. Click on a formula to zoom.
ABSTRACT
Deposition path patterns play an important role in controlling residual stresses and deformation in direct energy deposition-arc (DED-arc) process. In this paper, the effects of various path patterns on the evolution of the temperature history, residual stress distribution, and substrate deformations are investigated through experiments and finite element analysis. The predicted results of temperature fields and substrate deformations are verified experimentally by the infrared thermal imager and the laser profile scanner, respectively. It is found that the path patterns have significant effects on the stress distribution in the first few layers, and the minimum substrate deformation is obtained by the zigzag path along the short edge of the block. The proposed finite element method and measuring method are confirmed to be effective and feasible, providing valuable insight into the residual stresses and deformations control in the DED-arc process.
Highlights
Effects of path patterns on DED-arc process are investigated.
Path pattern has a significant effect on stress distribution in the first few layers.
The alternated paths between layers can cause uneven stress distribution.
Minimum substrate deformation is obtained under Zigzag path along the short edge.
1. Introduction
Directed energy deposition-arc (DED-arc) has its own advantages of low cost, high efficiency, and high flexibility, which makes it particularly suitable for fabricating large-scale metal parts [Citation1]. However, due to the high heat input and the large volume of the molten pool during the DED-arc process, the conditions of heat dissipation deteriorate rapidly as the number of deposition layers increases, resulting in increased solidification time of the molten pool and difficulty in controlling the dimensions of the weld bead shape [Citation2-4]. At the same time, the stacking path is diverse and the temperature gradient is not uniformly distributed making the formed part with large residual stresses inside, micro-cracks, and deformations.
To solve these issues, the post heat treatment is currently used to reduce residual stress and improve the microstructures of the formed parts. However, it is clear that this method is inefficient, especially for the manufacture of large parts, increasing both the manufacturing time and cost [Citation5,Citation6]. During the additive manufacturing process, the deposition path patterns and process parameters have a significant impact on the heat accumulation, residual stress, and deformation [Citation7,Citation8]. Therefore, it is meaningful to optimise the relevant process parameters to improve the forming quality of the workpiece through investigating the evolution of the temperature and stress fields during the DED-arc forming process [Citation9].
DED-arc is a nonlinear conduction process involving multi-physics coupling. It is difficult to monitor the quality of the cladding layer and the internal temperature changes of parts through experiments. For the manufacture of large-scale parts, it is time-consuming and wasting resources to determine the optimum process parameters by means of try-and-error methods. Finite element method (FEM) is widely used to simulate and analyse the physical process of DED-arc, which can help better understand the mutual influence of deposition sequence and process parameters on the residual stress, deformation, microstructure and mechanical properties [Citation10-12] providing an alternative method to optimise the process parameters.
Most finite element analysis are transient models, mainly including thermal models and mechanical models. These models have also been opened up to study the effects of process parameters, such as current, voltage, welding speed, and inter-layer cooling time on parts property [Citation13,Citation14]. In recent years, numerical simulation techniques have been developed from single-layer single-pass to multi-layer multi-pass and multi-physics field 3D models. For the additive manufacturing of complex large-scale components, the computational efficiency of numerical models has been studied by most scholars for a long time. Nevertheless, the parts size and geometric complexity are still limited. Since the complex model can significantly increase the computational cost of the actual production process [Citation15-18]. For example, Khairallah et al. used the ALE3D massively parallel code to complete the simulations of throughput with about 100,000 CPU hours [Citation19]. Yan et al. [Citation20] required 140 h to simulate a typical experimental procedure of only 4 ms.
For the additive manufacturing of large-scale complex metal structures, a lot of experiments and simulation for the optimisation of the deposition paths and process parameters were reported. Meng G et al. [Citation21] studied the influence of pore defects on the temperature and stress distribution in the cladding layer by multi-path method. The distribution model of pore defects and the three-dimensional transient thermo-elastic-plastic model of sequential thermal coupling were established, and the dynamic simulation of temperature field and stress field during laser rapid prototyping of Inconel 718 alloy with different pore defects were realised. Nagaraj M H et al. [Citation22] developed a novel numerical calculation framework using Carrera Unified Formulation (CUF), which realised the accurate prediction of thermal evolution in additive manufacturing process with different structural scales, and paved the way for the effective prediction of residual stress. Zhou J et al. [Citation23] used the three-dimensional finite element model to simulate the directional energy deposition process of Ti-6Al-4V parts, and the influence of different scanning strategies on the temperature history and residual stress was investigated. It was found a beneficial effect on reducing residual stress can be obtained by changing the scanning direction of laser between each layer. Alhakeem M M et al. [Citation24] proposed an algorithm to plan the deposition path through optimising the deposition angle and trajectory order. The surface deformation of 37% and the thin-wall overflow of 21% were successfully reduced. Currently, most of the existing models were developed to simulate single-layer cladding or simple deposition paths [Citation25-27] while only few numerical models focused on the parts with complex geometries [Citation28-31]. Ding J et al. [Citation32] used a 3D thermal elastic-plastic transient model to analyse the temperature evolution, residual stress and deformation of the DED-arc wall structure. Vastola G et al. [Citation33] carried out a systematic finite element modelling for single-pass scanning, and studied the magnitude and distribution of residual stress caused by different process parameters on the Ti6Al4 V specimen. Ren K et al. [Citation34] developed a computationally efficient numerical model for the laser-assisted additive manufacturing (LAAM) process to evaluate deposition strategies and investigate the influences of the dynamic temperature evolution on residual stress and deformation. Recently, in order to improve the computational efficiency of the FE model for the DED-arc of large components, Ding et al. [Citation35] developed a well-distributed volumetric heat source model-based FE model, and the predicted temperature distribution of the DED-arc blocks were experimentally verified. It is indicated that the efficiency of the FE model can be effectively improved through simplifying the heat source model without sacrificing model accuracy. Therefore, the expensive try-and-error experiments can be replaced by the calibrated FE models to optimise the process parameters for the DED-arc of large structures with minimum residual stresses and deformations.
In this paper, the five different path patterns were designed and their effects on the DED-arc blocks were investigated experimentally. The effects of various deposition path patterns on the residual stress distribution and the deformation of the substrates were further discussed. After this introduction section, the experiment setup is described in Section 2, followed by the theory of thermo-mechanical FEM in Section 3. The experimental verification and the simulation results including thermal, residual stress, and deformation are discussed in Section 4. The paper ends with the conclusion in Section 5.
2. Experimental setup
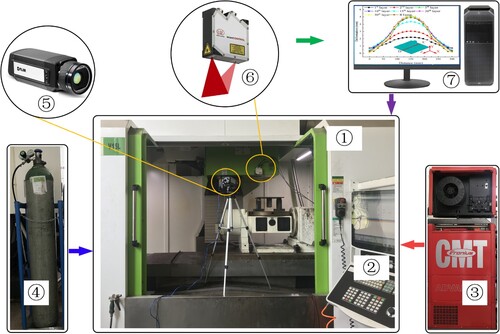
Experiments of multi-layer multi-pass depositions were conducted using a hybrid additive & subtractive manufacturing system (HASM) [Citation35]. The schematic diagram of the experimental setup is shown in . The motions of welding torch and the workbench are implemented by the five-axis controlled CNC machine ①. The control system ② is SIEMENC 840d V15L vertical machining centre, and the welding machine ③ is TPS 4000 CMT Advanced. The mixed shielding gas ④ of 92% argon and 8% CO2 was used and the flow rate was 17 liters/min. A thermal imaging camera (FLIR A655sc) ⑤ was used to collect the temperature data of the building blocks during the deposition process. The emissivity was set to 0.95, which can provide more accurate measurement results in the high-temperature range [Citation35]. A laser profile scanner (Scan Control 2900) ⑥ is used to collect the deformation data at the bottom of substrate. A computer workstation with 12 cores Inrel(R) Xeon(R) Silver 4116 CPU and 32GB RAM ⑦ is used to process the experimental data, and perform simulation work.
Figure 1. Schematic diagram of the experimental setup.
The block models with the dimensions of 35mm × 150mm × 108 mm were selected to be deposited at the centre of the substrates with the dimensions of 300mm × 300mm × 10 mm as shown in . Total of thirty layers were deposited for all block models in this study, and the height of each layer is around 3.6 mm. The middle line segments AB, CD, as shown in , were selected as the reference segments for measuring the deformation of the substrate after the block deposition was completed. The four corners of the substrate were fixed and the surface of the substrate was polished before the DED-arc. The welding wire material is ER50-6 with a wire diameter of 1.2 mm and the substrates are Q235B, the detailed compositions of the feedstock and the substrate are listed in . The properties of the substrate and the welding material are crucial parameters for the FEM on the residual stresses and deformations, and the physical properties of the relevant materials will be listed in detail in Section 3. The other experimental parameters are listed in .
Figure 2. Geometries of the DED-arc model and the substrate with the location of temperature measurements and clamping: (a) Top view; (b) Front view and side view.
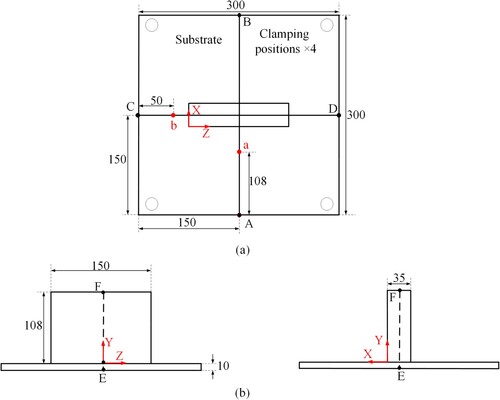
Table 1. Compositions of the feedstock (ER50-6) and the substrate (Q235B), (wt%).
Table 2. Parameters used in the present study.
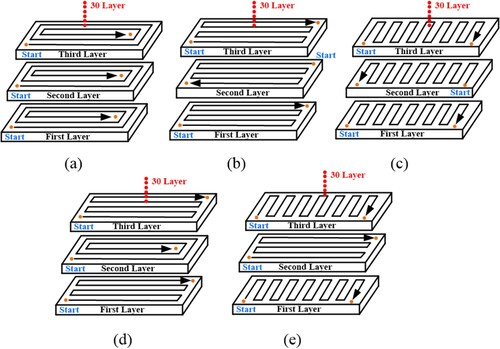
Since the spiral path and zigzag path are commonly used to produce the regular geometries in DED-arc, the effects of path patterns of spiral, zigzag, and combinations on residual stresses and deformations of wire arc additively manufactured blocks were investigated. In this paper, five different path patterns, namely Spiral, ZigzagL (zigzag along the long edge), ZigzagS (zigzag along the short edge), ZigzagL-Spiral alternated, and ZigzagS-ZigzagL alternated were chosen as shown in . The temperature histories and distributions, residual stresses, and deformations corresponding to various path patterns were investigated as follows. Appropriate interlayer cooling time can prevent heat accumulation. According to the previous experimental verification [Citation35], the idle time of 5 min can ensure that the DED-arc built blocks have good forming appearances. To prevent the excessive heat accumulation, the idle time of 5 min was used as the interlayer cooling time between each layer deposition process.
Figure 3. Five different path patterns for the DED-arc of block: (a) Spiral; (b) ZigzagL; (c) ZigzagS; (d) ZigzagL-Spiral alternated; (e) ZigzagS-ZigzagL alternated.
3. Finite element modelling
In this paper, the physical properties of the substrate and feedstock materials used for simulations were collected from the references as shown in and . The mesh of the substrate and the building block model were shown in . In this setup, a total of 30 layers are sequentially activated, with each layer following a predetermined path. This sequence aims to successively activate adjacent volume elements in the grid, thereby delivering a uniformly distributed volumetric heat source. This process is designed to simulate the melting and solidification phases of metal wire. Thermodynamic coupling analysis element types are solid70 and solid45 8-node hexahedral mesh elements, respectively. The rest parameters of the heat source used for the finite element analysis were listed in .
Figure 4. Physical properties of substrate materials (Q235) [Citation36,Citation37].
![Figure 4. Physical properties of substrate materials (Q235) [Citation36,Citation37].](/cms/asset/54bc1209-ca51-4b1f-99c6-124397255716/nvpp_a_2296128_f0004_oc.jpg)
Figure 5. Physical properties of feedstock materials (ER50-6) [Citation38-40].
![Figure 5. Physical properties of feedstock materials (ER50-6) [Citation38-40].](/cms/asset/c2f7789d-8fa3-4090-91cd-069e769c2fc3/nvpp_a_2296128_f0005_oc.jpg)
Figure 6. Mesh of the present finite element model for the block.
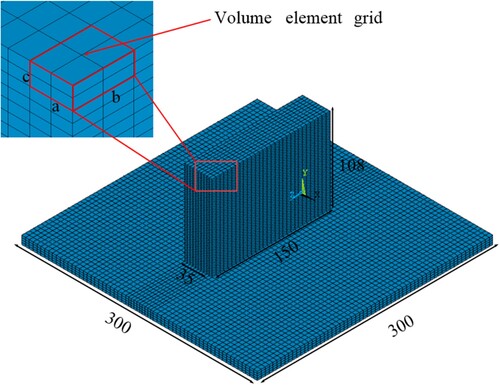
Table 3. Heat source model parameters.
The simulation process consists of two steps: (1) The moving heat source and adaptive boundary conditions were modelled, and the sequential deposition process of the material was described using the unit-generation technique. (2) The time-varying temperature field, acquired during the thermal analysis stage, was used as the initial condition in the subsequent mechanical analysis for each step of the process. To accurately determine the stress field and deformation in the workpiece, constraints were set on the already activated cell, specifically by fixing the positions of the substrate's four corners. This approach prevented the sheet from undergoing undesirable flattening and rotation.
The uniformly distributed volumetric heat source offers computational efficiency [Citation35], with the following equation:
(1)
(1)
In this formulation, represents the welding current,
denotes the welding voltage,
is the measure of thermal efficiency,
indicates the cross-sectional area of the weld,
signifies the welding speed, and
is the duration allocated for each load step. In this context, the time
assigned for printing a step is equivalent to the time required for solving a single step in later calculations.
In the metal deposition process, a heat source is regulated via a pre-established scanning pathway. Over time, this leads to changes in the block's shape. The activation methodology employed in the numerical simulations utilises the born-dead elements technique, as cited in reference [Citation41]. This technique categorises the elements within the finite element mesh into three types: active, activated, and inactive, as illustrated in (a).
Figure 7. (a) Active and inactive elements in each time step of the AM simulation; (b) To activate elements at each time step; (c) Moving of the heat source under Spiral path pattern; (d) Moving of the heat source under ZigzagL path pattern.
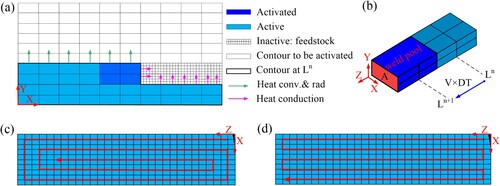
Active elements are those that make up the fully formed solid blocks and have been brought into play through the metal deposition process. Activated elements refer to those currently undergoing energy input in the existing time step and were inactive before this stage. In contrast, inactive elements consist of those yet to be incorporated into the computational analysis.
Based on the predefined scanning path, the heat source moves from position Ln to position Ln + 1, covering a time step of . The distance travelled by the melt pool is
, and the cross-sectional area of the cuboid is
, as shown in (b). Therefore, the volume of the activated elements within one time step is given by
.
In the multi-layer multi-pass deposition process, the scanning paths for each layer are depicted in (c) for the Spiral path deposition. For the ZigzagL path deposition, the scanning paths for each layer are illustrated in (d). To minimise the impact of arc starting and arc extinguishing, it is set that the positions where arc extinguishing occurs in odd-numbered layers are the same as the positions where arc starting occurs in even-numbered layers. For the proposed five blocks, the finite element calculation of temperature and stress fields for each model takes approximately 22 h computational time in total.
4. Results and discussion
4.1. Temperature distribution
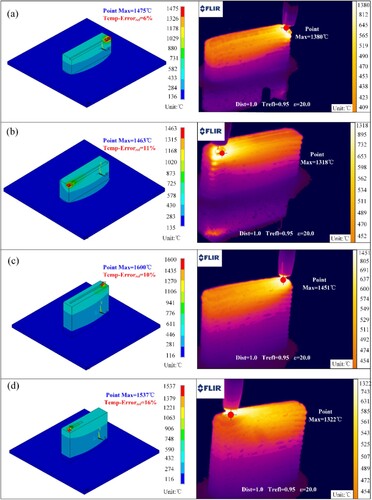
To verify the effectiveness of the developed FE models, the temperature distributions of the DED-arc blocks were investigated. Due to the length of the paper, only the block under the ZigzagL-Spiral alternated path is selected as a reference and the main findings were provided. As shown in , the evolution of the temperature fields was recorded by the infrared thermal imager, and calculated by the FE as well. The results of the 15th and 30th layers were taken, and the predicted temperature fields have good agreement with the experimental measurements at different stages of the DED-arc process. The positions of the maximum temperature points at different deposition layers obtained through FE predictions and experimental measurements are consistent. The relative errors of the prediction maximum point temperature to the measuring maximum point temperature (Temp-Errorrel) were calculated as provided in . The relative errors of the temperature were around 6% to 16% at high temperature measurement.
Figure 8. Temperature field of the ZigzagL-Spiral alternated block at start and end of the 5th pass on15th and 30th layer: (a) 15th layer start; (b) 15th layer end; (c) 30th layer start; (d) 30th layer end.
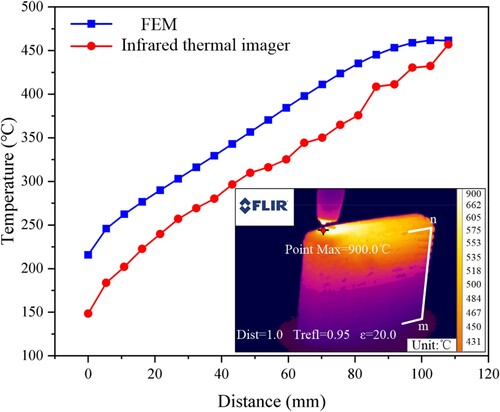
On the other hand, when the total of 30 layers depositions were completed and the welding torch was extinguished, the temperature distribution along the Y axis (from the point m to point n) is selected for comparison, as shown in . The results show that the distribution trend of the experimental temperature is consistent with the simulated temperature, with the maximum temperature difference of around 67°C and the minimum temperature difference of around 4°C.
Figure 9. Temperature distribution of the ZigzagL-Spiral alternated block along Y-axis m to n direction after arc off in the 30th layers.
The big difference between FE calculated temperature and the results obtained by infrared measurement comes from two aspects. On the one hand, since the infrared camera use the infrared radiation energy radiated from the surface of the measured object to calculate its surface temperature. While the true emissivity of the measured object is uncertain and varies with the temperature increases reducing the accuracy of temperature measurement. A single emissivity calibrated around 600°C is used for the equipment leading to errors in large-scale temperature measurement, especially for the very low and high temperature range. On the other hand, there are also significant errors in the finite element simulation of additive manufacturing for large-sized components. Therefore, the temperature errors between the simulations and measurements in and are reasonable indicating the effectiveness of the proposed FE methods.
4.2. Residual stresses
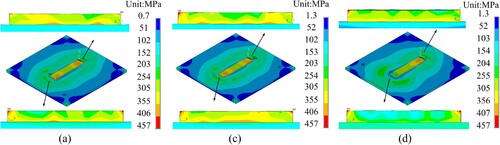
Generally, residual stress would generate with inhomogeneous temperature gradient and phase transition. As deposition patterns have significant impacts on the temperature distributions, it is necessary to determine the optimal path planning strategy for restraining residual stress. The von Mises stress of single-layer multi-pass under different paths is shown in . The maximum value of the residual stress is close under different paths. However, the path pattern has an effect on the residual stress distribution. The residual stress distribution of ZigzagL and Spiral is quite similar, because their heat input laws are mainly along the long side. The heat input under the ZigzagS path pattern is relatively concentrated, and the larger residual stress appears at the end of the deposition path, which is consistent with the result in previous reference [Citation42].
Figure 10. Residual stress (von Mises) distribution under different deposition paths: (a) ZigzagL; (b)Spiral; (c) ZigzagS.
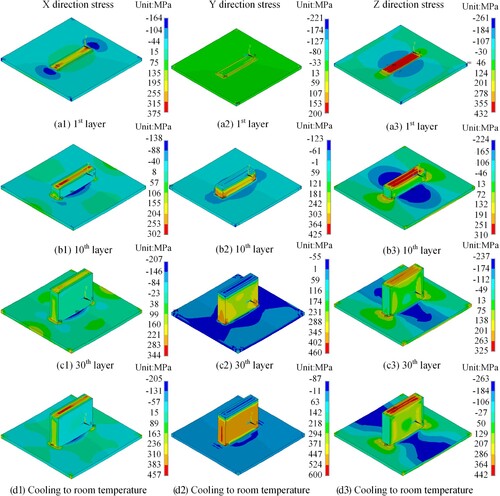
The evolution of the residual stress at different deposition layers is investigated through the FE analysis of the DED-arc block using Spiral path. As shown in , the evolution process of residual stress in X/Y/Z in Spiral path with the increase of layers is provided. In the X direction, the maximum tensile stress of the first layer appears at both ends of the cladding layer. With the increase of the number of layers, the maximum tensile residual stress mainly appears at the corner where the cladding layer contacts the substrate. The maximum compressive stress of the first layer appears at the two ends of the substrate along the long side of the block. With the increase of the number of layers, the maximum compressive stress appears at the position where the cladding layer contacts the centre of the substrate. In the Y direction, the maximum tensile stress mainly appears at the corner where the cladding layer contacts the substrate. After cooling to room temperature, the maximum tensile stress is concentrated at both ends along the building direction (Y direction) of the block. In the Z direction, the maximum tensile stress of the first layer is concentrated on the surface of the cladding layer. With the increase of the number of layers, the maximum tensile stress is also concentrated on the corner where the cladding layer contacts the substrate, just like the stress in the X/Y direction. Unlike the stress in the X/Y direction, there is still a large area of tensile stress on the surface of the top layer of the cladding layer after cooling to room temperature. With the increase of the number of layers, the maximum compressive stress gradually spreads from the centre of the substrate along both sides of the X direction.
Figure 11. Residual stress distribution in Spiral path.
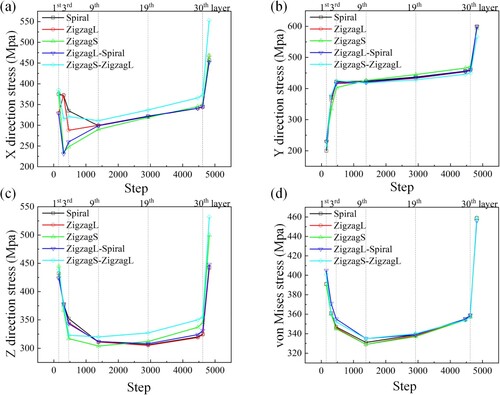
The evolution of the maximum residual stresses in X direction, Y direction, and Z direction, and the maximum von Mises stress during the deposition and cooling process are extracted as shown in . According to the evolution of the von Mises stress shown in (d), it is found that the impact of deposition paths on residual stress during the deposition process of layers 1 to around 15 are relatively significant. However, as the number of deposition layers continues to increase, the deposition paths have almost no effect on the residual stress. It indicates that the deposition path or the heat input sequence has a significant impact on the residual stress in the first few layers due to the influence of the substrate on heat transfer, but as the building height continues to increase, the influence of the heat input sequence gradually disappears. During the cooling stages (calculating steps after the 30th layers), the residual stress in X/Y/Z direction and the von Mises stress all show similar trends of gradually increasing under different path patterns. Therefore, for the DED-arc of brittle materials, the insulation and slow cooling process after completion will help reduce residual stress and prevent cracking. (a) to (c) show that the effects of path patterns on the stress are relatively significant in the first few layers (deposition process of layers 1–9), especially on the residual stress in X direction (short side of the block model) as shown in (a). However, due to the comprehensive effects of small block size (35 mm in X direction and 150 mm in Z direction) and substrate heat transfer, it is difficult to clarify the influence of path on stress at this stage, and the mechanism of path patterns on stress evolution still needs further in-depth investigation.
Figure 12. The effects of path patterns on the evolution of the Maximum residual stress: (a) Stresses in X direction; (b) Stresses in Y direction; (c) Stresses in Z direction; (d) von Mises stress.
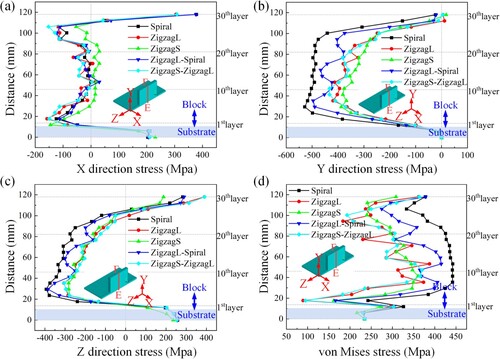
shows the effects of path patterns on the residual stress distribution along the centre line EF (from the bottom of the substrate to the top of the building block). The stress variations along the reference line segment EF under Spiral and ZigzagS path patterns are relatively smooth, while stress experiences significant fluctuations under other path patterns. Because the Spiral path or ZigzagS path of each layer is the same compared to other path patterns, there is a similar thermal evolution process along the centre line EF (the building direction). It indicates that the stress at the local reference points is greatly influenced by thermal evolution or the deposition path. From the bottom of the substrate along the reference centre line EF to the top of the building block, it can be observed that there are three typical areas for stress changes. The stress distributions in X direction ((a)) and Z direction ((c)) are similar, with tensile stress gradually becoming compressive stress from the bottom of the substrate to the first few layers (near substrate area), and reaching its maximum value around 5th layer. In the middle area between 5th layer and around 25th layer, the stress value fluctuates slightly (in X direction) or decreases slowly (in Z direction). In the top area (the last 3–5 layers), both the compressive stresses in X direction and Z direction gradually decrease and become tensile stress, reaching their maximum value on the top surface of the block. The stress values in Y direction ((b)) also have a similar distribution pattern, but the stress values on the substrate ground and block top surface are both zero, which is consistent with physical laws.
Figure 13. The effects of path patterns on the stress distribution along the centre line EF: (a) Stresses in X direction; (b) Stresses in Y direction; (c) Stresses in Z direction; (d) von Mises stress.
4.3. Deformation
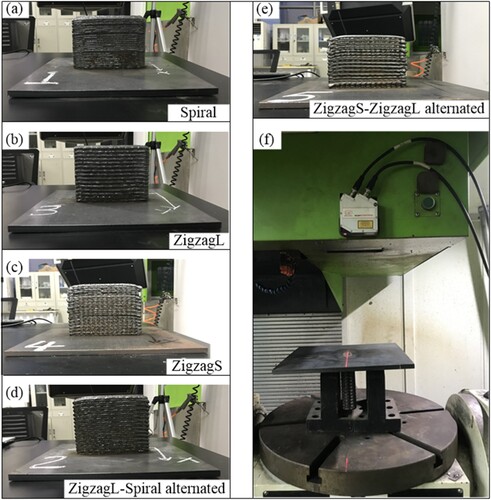
Comparative study on the influence of path patterns on substrate deformation was conducted through experiments and simulations. (a) to (e) show the blocks formed through the DED-arc process under different path patterns. A slight collapse was found at both ends of these built blocks. Due to the relatively stable deposition process, the impact of deposition path on collapse is minimal. After measurement, the smallest collapse occurred in the ZigzagL path with a value of 0.5 mm, while the largest collapse occurred in the ZigzagS-ZigzagL alternated path with a value of 3.5 mm. The average height of the block is round 108 mm, and its maximum collapse is about 3%. Therefore, the external shape of the five build blocks is acceptable during the DED-arc process. The deformations of the substrates after the DED-arc process were obtained by scanning the back of the substrate using a laser profiler as shown in (f).
Figure 14. Blocks formed under different path patterns: (a) Spiral; (b) ZigzagL; (c) ZigzagS; (d) ZigzagL-Spiral; (e) ZigzagS-ZigzagL; (f) Scanning the back of the substrate to obtain substrate deformation.
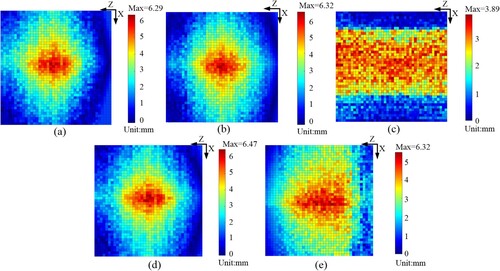
Experimental results of substrate deformation under different DED-arc forming path patterns were measured and described in . The deformation of the substrate under Spiral, ZigzagL, and ZigzagL-Spiral alternated paths manifest as central symmetric warping deformation as shown in (a), (b), and (d), respectively. The deformations in the central areas of the substrates reach their maximum, which are 6.29, 6.32, and 6.47 mm, respectively. The similarity in maximum deformations indicates that there three paths have a relatively small impact on the deformation of the block. The deformation of the substrate under the ZigzagS path exhibits tile like warping, with a maximum deformation of 3.89 mm, as shown in (c). The deformation of the substrate formed under ZigzagS-ZigzagL alternated path exhibits a combination of the tile shaped warping and central warping deformation, with the maximum deformation of 6.32 mm, as shown in (e). The experimental measurement results of substrate deformation indicate that the deformation is minimal under ZigzagS path patterns.
Figure 15. Experimental results of substrate deformation under different DED-arc forming path patterns: (a) Spiral; (b) ZigzagL; (c) ZigzagS; (d) ZigzagL-Spiral; (e) ZigzagS-ZigzagL.
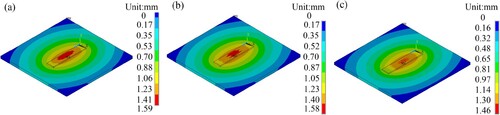
The effects of path patterns on substrate warping deformations were further studied through the proposed FE models. compares the simulation results of warping deformation of the substrate after single-layer DED-arc deposition under ZigzagL, Spiral, and ZigzagS path patterns, respectively. The deformation at all four corners of the substrate is zero, as these are the clamping and fixing points. A central warping deformation mode was found under different paths, with the maximum deformation at the centre position. Compared to the ZigzagS path, the central warping deformation trend of the substrate under the ZigzagL and Spiral path is stronger, and the deformation amount is also relatively large.
Figure 16. Substrate warpage deformation of single-layer deposition under different paths: (a) ZigzagL; (b) Spiral; (c) ZigzagS.
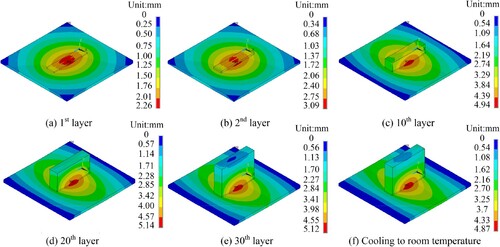
Taking the Spiral path as a reference, shows the evolution process of substrate deformation with the DED-arc building process. As the number of deposition layers increases, the maximum deformation also gradually increases. It is worth noting that before the 10th layer, the deformation increases rapidly, while after the 10th layer, the increase is slower. During the cooling stage, due to the lack of heat input, the deformation decreases, which is an equilibrium process with the increase in stress during the cooling process mentioned earlier.
Figure 17. Evolution process of substrate deformation under Spiral path.
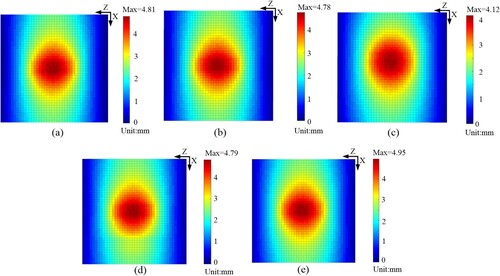
shows the final substrate deformation results under different paths. It should be noted that the a final ‘unbolting’ stress relaxation step representing the release of the corner constraints were loaded to accurately simulate the building and unbolting process. Under different deposition paths, all substrates exhibit a combination of tile shaped warping and central warping, with the maximum deformation of 4.95 mm. There is a certain gap between the simulation results and the maximum deformation measured in the experiment, which is 6.47 mm. The reason may be due to measurement errors during the experimental measurement process on the back of the substrate, errors in later experimental data processing, and calculation errors caused by simplification of boundary conditions during the simulation process. However, it is worth mentioning that the deformation under the ZigzagS path is the smallest and has obvious advantages compared to other paths, which is very consistent with the experimental results.
Figure 18. Final unbolted substrate deformation simulation results under different paths: (a) Spiral; (b) ZigzagL; (c) ZigzagS; (d) ZigzagL-Spiral; (e) ZigzagS-ZigzagL.
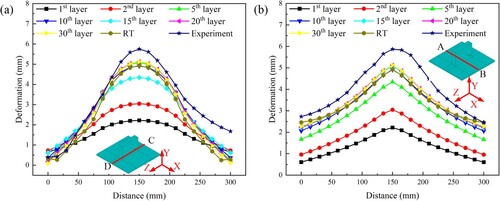
In order to further explore whether the experimental measurement error caused by the overall scanning measurement method on the back of the substrate is significant, the deformation measurement results were extracted and compared with the simulation data using the two centrelines of the substrate as references, as shown in . Spiral path serves as a reference, as the upper and lower paths are the same, which is used for comparing experimental and simulation results with good consistency. As the number of layers in the deposition process increases, the warping deformation of the CD centreline and AB centreline both increases. Both experiments and simulations show that the deformation at both ends of the CD centreline is close 0, while the deformation at both ends of the AB centreline is significantly larger. This indicates that the substrate exhibits a central warping deformation mode along the CD centreline, while the deformation along the AB centreline exhibits a central warping deformation with tile shaped warping. The measurement error between the simulation results (cooling to room temperature) and the experimental measurement results along the CD line is relatively small. The error of point D is minimised, while the error of point C is relatively large, which is due to the processing method of experimental measurement data. The deformation trends of the CD and AB centrelines in the simulation and experiment are very similar, and the error is within a reasonable range, indicating the proposed FE method and measurement method are effective and feasible.
Figure 19. The deformation of lines CD and AB with the increase of layers in Spiral path.
5. Conclusions
This study investigates the effects of forming path patterns on the temperature history, residual stress, and deformation evolution of the DED-arc blocks by establishing a finite element model and innovative experimental measurement methods. The results of this study are summarised below:
i. Based on the well-distributed volumetric heat source, the developed thermodynamic model provides a consistently effective method for evaluating different DED-arc path patterns, which can be applied to calculate the DED-arc process of large parts with complex geometry in an effective way.
ii. The deposition path or heat input sequence has a significant impact on the temperature history, residual stress, and deformation of blocks in DED-arc process, especially during the deposition process of the first few layers. For the DED-arc of the block workpiece in this study, the alternated paths between layers can cause uneven stress distribution, and the minimum deformation of the substrate under the Zigzag path along the short edge can be obtained.
iii. The mechanism of the effects of forming path on residual stress and deformation still needs further in-depth research on the DED-arc process of larger and complex geometric components.
Acknowledgement
The authors would like to thank former graduate student Shimin Zhang for his help in experiment preparation.
Disclosure statement
No potential conflict of interest was reported by the author(s).
Additional information
Funding
References
- Ding D, He F, Yuan L, et al. The first step towards intelligent wire arc additive manufacturing: an automatic bead modelling system using machine learning through industrial information integration. J Ind Inf Integr. 2021;23:100218. doi:10.1016/j.jii.2021.100218
- Wu B, Pan Z, Chen G, et al. Mitigation of thermal distortion in wire arc additively manufactured Ti6Al4V part using active interpass cooling. Sci Technol Weld Join. 2019;24(5):484–494. doi:10.1080/13621718.2019.1580439
- Wang Y, Xu X, Zhao Z, et al. Coordinated monitoring and control method of deposited layer width and reinforcement in WAAM process. J Manuf Process. 2021;71:306–316. doi:10.1016/j.jmapro.2021.09.033
- Xia C, Pan Z, Zhang S, et al. Model-free adaptive iterative learning control of melt pool width in wire arc additive manufacturing. Int J Adv Manuf Technol. 2020;110:2131–2142. doi:10.1007/s00170-020-05998-0
- Seow CE, Coules HE, Wu G, et al. Wire + arc additively manufactured inconel 718: effect of post-deposition heat treatments on microstructure and tensile properties. Mater Des. 2019;183:108157. doi:10.1016/j.matdes.2019.108157
- Cunningham CR, Flynn JM, Shokrani A, et al. (2018). Invited review article: Strategies and processes for high quality wire arc additive.
- Wu B, Ding D, Pan Z, et al. Effects of heat accumulation on the arc characteristics and metal transfer behavior in wire arc additive manufacturing of Ti6Al4V. J Mater Process Technol. 2017;250:304–312. doi:10.1016/j.jmatprotec.2017.07.037
- Walker TR, Bennett CJ, Lee TL, et al. A novel numerical method to predict the transient track geometry and thermomechanical effects through in-situ modification of the process parameters in direct energy deposition. Finite Elem Anal Des. 2020;169:103347. doi:10.1016/j.finel.2019.103347
- Bruna-Rosso C, Demir AG, Previtali B. Selective laser melting finite element modeling: validation with high-speed imaging and lack of fusion defects prediction. Mater Des. 2018;156:143–153. doi:10.1016/j.matdes.2018.06.037
- Seleš K, Perić M, Tonković Z. Numerical simulation of a welding process using a prescribed temperature approach. J Constr Steel Res. 2018;145:49–57. doi:10.1016/j.jcsr.2018.02.012
- Nijhuis B, Geijselaers HJM, van den Boogaard AH. Efficient thermal simulation of large-scale metal additive manufacturing using hot element addition. Comput Struct. 2021;245:106463. doi:10.1016/j.compstruc.2020.106463
- Schilp J, Seidel C, Krauss H, et al. Investigations on temperature fields during laser beam melting by means of process monitoring and multiscale process modelling. Adv Mech Eng. 2014;6:217584. doi:10.1155/2014/217584
- Khoshroyan A, Darvazi AR. Effects of welding parameters and welding sequence on residual stress and distortion in Al6061-T6 aluminum alloy for T-shaped welded joint. Trans Nonferrous Met Soc China. 2020;30(1):76–89. doi:10.1016/S1003-6326(19)65181-2
- Vasinonta A, Beuth JL, Griffith M. (2007). Process maps for predicting residual stress and melt pool size in the laser-based fabrication of thin-walled structures.
- Khairallah SA, Anderson AT, Rubenchik A, et al. Laser powder-bed fusion additive manufacturing: physics of complex melt flow and formation mechanisms of pores, spatter, and denudation zones. Acta Mater. 2016;108:36–45. doi:10.1016/j.actamat.2016.02.014
- Gaikwad A, Yavari R, Montazeri M, et al. Toward the digital twin of additive manufacturing: Integrating thermal simulations, sensing, and analytics to detect process faults. IISE Trans. 2020;52(11):1204–1217. doi:10.1080/24725854.2019.1701753
- Luo Z, Zhao Y. A survey of finite element analysis of temperature and thermal stress fields in powder bed fusion additive manufacturing. Addit Manuf. 2018;21:318–332. doi:10.1016/j.addma.2018.03.022
- Bandyopadhyay A, Traxel KD. Invited review article: metal-additive manufacturing—modeling strategies for application-optimized designs. Addit Manuf. 2018;22:758–774. doi:10.1016/j.addma.2018.06.024
- Khairallah SA, Anderson A. Mesoscopic simulation model of selective laser melting of stainless steel powder. J Mater Process Technol. 2014;214(11):2627–2636. doi:10.1016/j.jmatprotec.2014.06.001
- Yan W, Ge W, Qian Y, et al. Multi-physics modeling of single/multiple-track defect mechanisms in electron beam selective melting. Acta Mater 2017;134:324–333. doi:10.1016/j.actamat.2017.05.061
- Meng G, Zhang J, Li J, et al. Impact of pore defects on laser additive manufacturing of Inconel 718 alloy based on a novel finite element model: thermal and stress evaluation. Opt Laser Technol. 2023;167:109782. doi:10.1016/j.optlastec.2023.109782
- Nagaraj MH, Maiaru M. A novel higher-order finite element framework for the process modeling of material extrusion additive manufacturing. Addit Manuf. 2023;76:103759. doi:10.1016/j.addma.2023.103759
- Zhou J, Barrett RA, Leen SB. Three-dimensional finite element modelling for additive manufacturing of Ti-6Al-4V components: effect of scanning strategies on temperature history and residual stress. J Adv Join Process. 2022;5:100106. doi:10.1016/j.jajp.2022.100106
- Alhakeem MM, Mollamahmutoglu M, Yilmaz O, et al. A deposition strategy for wire arc additive manufacturing based on temperature variance analysis to minimize overflow and distortion. J Manuf Process. 2023;85:1208–1220. doi:10.1016/j.jmapro.2022.11.006
- Zhao H, Zhang G, Yin Z, et al. Three-dimensional finite element analysis of thermal stress in single-pass multi-layer weld-based rapid prototyping. J Mater Process Technol. 2012;212(1):276–285. doi:10.1016/j.jmatprotec.2011.09.012
- Heinze C, Schwenk C, Rethmeier M. The effect of tack welding on numerically calculated welding-induced distortion. J Mater Process Technol. 2012;212(1):308–314. doi:10.1016/j.jmatprotec.2011.09.016
- Wu Q, Mukherjee T, De A, et al. Residual stresses in wire-arc additive manufacturing – hierarchy of influential variables. Addit Manuf. 2020;35:101355. doi:10.1016/j.addma.2020.101355
- Parry L, Ashcroft IA, Wildman RD. Understanding the effect of laser scan strategy on residual stress in selective laser melting through thermo-mechanical simulation. Addit Manuf. 2016;12:1–15. doi:10.1016/j.addma.2016.05.014
- Yan L, Zhang Y, Liou F. A conceptual design of residual stress reduction with multiple shape laser beams in direct laser deposition. Finite Elem Anal Des. 2018;144:30–37. doi:10.1016/j.finel.2018.02.004
- Chiumenti M, Lin X, Cervera M, et al. Numerical simulation and experimental calibration of additive manufacturing by blown powder technology. Part I: thermal analysis. Rapid Prototyp J. 2017;23(2):448–463. doi:10.1108/RPJ-10-2015-0136
- Nie Z, Wang G, McGuffin-Cawley JD, et al. Experimental study and modeling of H13 steel deposition using laser hot-wire additive manufacturing. J Mater Process Technol. 2016;235:171–186. doi:10.1016/j.jmatprotec.2016.04.006
- Ding J, Colegrove P, Mehnen J, et al. Thermo-mechanical analysis of wire and arc additive layer manufacturing process on large multi-layer parts. Comput Mater Sci. 2011;50(12):3315–3322. doi:10.1016/j.commatsci.2011.06.023
- Vastola G, Zhang G, Pei QX, et al. Controlling of residual stress in additive manufacturing of Ti6Al4V by finite element modeling. Addit Manuf. 2016;12:231–239. doi:10.1016/j.addma.2016.05.010
- Ren K, Chew Y, Fuh JYH, et al. Thermo-mechanical analyses for optimized path planning in laser aided additive manufacturing processes. Mater Des. 2019;162:80–93. doi:10.1016/j.matdes.2018.11.014
- Ding D, Zhang S, Lu Q, et al. The well-distributed volumetric heat source model for numerical simulation of wire arc additive manufacturing process. Materi Today Commun. 2021;27:102430. doi:10.1016/j.mtcomm.2021.102430
- Liu WJ (2017). Numerical simulation of temperature field and stress field in arc additive manufacturing and evaluation of forming path strategy [master's thesis]. Huazhong University of Science and Technology; 2017.
- Wei S, Wang Z, Yang Y, et al. Finite element analysis of shot peening to improve residual stress field in Q235B welded joints. Hot Work Technol. 2020;49(9):8.
- Yan C. Research on GMAW additive manufacturing process for low carbon steel ship parts [master's thesis] Zhejiang Ocean University; 2021.
- Hu GY. Research on the rolling process of CO_2 gas shielded welding wire spool ER50-6 [master's thesis]. Xi'an University of Architecture and Technology; 2013.
- Zhang C, Li S, Hu L, et al. Effects of pass arrangement on angular distortion, residual stresses and lamellar tearing tendency in thick-plate T-joints of low alloy steel. J Mater Process Technol. 2019;274:116293. doi:10.1016/j.jmatprotec.2019.116293
- Chiumenti M, Cervera M, Salmi A, et al. Finite element modeling of multi-pass welding and shaped metal deposition processes. Comput Methods Appl Mech Eng. 2010;199(37-40):2343–2359. doi:10.1016/j.cma.2010.02.018
- Nickel AH, Barnett DM, Prinz FB. Thermal stresses and deposition patterns in layered manufacturing. Mater Sci Eng: A. 2001;317(1-2):59–64.