
 ?Mathematical formulae have been encoded as MathML and are displayed in this HTML version using MathJax in order to improve their display. Uncheck the box to turn MathJax off. This feature requires Javascript. Click on a formula to zoom.
ABSTRACT
To address safety and labour-intensive challenges in laser powder bed fusion, a novel Metal Additive Manufacturing using Powder Sheets (MAPS) method is employed. By examining the formation mechanism of the melt pool, we discovered that MAPS printing utilising a negative defocus strategy achieves a favourable conduction mode. This approach results in the fabrication of crack-free SS304 samples with over 99.65% relative density and elongated grains. These phenomena are caused by diverged laser power density distribution and decreased entrainment of byproducts such as vapour into the melt pool, as observed by the laser-powder sheet in-situ interaction. Furthermore, the productivity of MAPS increases when printing using the negative defocus setting compared to the scenario without defocus and productivity also increases with the decrease in scanning speed, attributed to a larger amount of metal particles entrained into the melt pool. This study provides insights into the novel MAPS manufacturing for functional metal components.
GRAPHICAL ABSTRACT
Highlights
Printability of a novel additive manufacturing approach (MAPS) using powder sheet feedstock is explored.
The processing window for MAPS fabrication of SS304 samples is investigated.
Defect-free samples are MAPS manufactured using a negative defocus setting.
In MAPS, the productivity of the process increased with the increasing magnitude of the negative defocus setting, up until a certain point was reached.
The laser beam-powder sheet interaction is imaged using a high-speed camera and a larger area of plume is found at the negative defocus setting.
1. Introduction
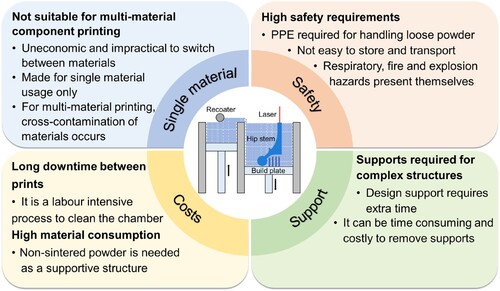
Laser powder bed fusion (LPBF) is one of the dominant manufacturing methods for fabricating bespoke metal components with intricate geometries in a layer-by-layer manner, using a loose power-based feedstock [Citation1–3]. Despite its prominence, several inherent issues are limiting the wide uptake of LPBF: (1) Potential cause of safety issues such as respiratory hazards, fire and explosion; (2) The loose powder cannot be used for accurately printing in an inclined direction, thus supports are necessary. This introduces additional costs and time requirements for supports removal in the post-fabrication step; (3) Long downtime between prints is incurred due to powder handling and cleaning; (4) Although most of the current commercial LPBF printing systems can print different materials individually, switching powder materials is uneconomic and impractical due to the necessity for the entire printing system needing to be cleaned [Citation4,Citation5]; (5) A high material consumption due to a high amount of non-sintered powder that is needed for supportive structures, regardless of the cross-section of the components to be printed. The main drawbacks of LPBF by using loose powder feedstock are summarised in .
Figure 1. Main issues that are limiting the wide uptake of LPBF.
To address the above challenges, novel types of feedstock materials and new advanced manufacturing methods are needed [Citation6,Citation7]. To avoid using loose powder as feedstock and thus to improve the safety during AM, a metal paste deposition method is proposed and it works by extruding a water-based metal paste [Citation8]. However, an additional sintering step is needed to remove the binder residue after the fabrication process is complete. Instead of using loose powder feedstock for printing metal components, Hung et al. [Citation9] printed 304 stainless steel (SS304) parts using metallic foil feedstock. The process is named as laser-foil-printing (LPF). Furthermore, Rittinghaus et al. [Citation10] proposed a novel Laser Fusion of Powder and Foil concept for multi-material printing by combining LPBF and LPF. However, the LPF process requires a second ultraviolet-pulsed laser to remove the extra foil. To prevent cross-contamination of materials during multi-material components manufacturing, Bodner et al. [Citation11] proposed a liquid dispersion LPBF method using metal slurry feedstock. An 8 mm high IN718-SS316 structure was subsequently printed. However, it is time-consuming to pre-dry the powder suspension in a nitrogen flow before the laser sinters the material in each layer [Citation12]. In the previous studies [Citation13–15], the authors proposed a novel Metal Additive Manufacturing using Powder Sheets (MAPS) concept by using powder sheet feedstock, wherein metal particles are tightly connected by polymer binder. The usage of flexible powder sheets is expected to solve all the drawbacks inherent in LPBF (). However, the printability of MAPS has yet to be investigated and optimised.
A high-speed camera has been utilised to study particle dynamics, laser beam-powder interaction, and the manufacturing mechanisms of metal material in loose powder LPBF [Citation16,Citation17]. Bidare et al. [Citation16] investigated the particle dynamics in LPBF using a high-speed camera and revealed that the inclination of the laser plume was shifted from forwards to backwards by adjusting the laser power and scanning speed. Andani et al. [Citation18] examined the distribution of spatters under various energy inputs through high-speed imaging, highlighting scanning speed as one of the dominant factors that influence the formation of spatter in LPBF. To understand the laser beam-material interaction during AM and to gain insights into the multi-physics phenomena in the melt pool area, a comprehensive investigation into the induced spatter particles during the fusion process of powder sheets is essential. Specifically, high-speed imaging can be used to detect the characteristics of spatter formation, particle movement, evaporation process of the polymer binder, and the evolution of powder sheets into solidified material in the MAPS process.
Melt pool characterisation is one of the crucial factors that influence the manufacturing process of metal AM. The geometry of the melt pool is particularly significant, as its width, depth and length can affect the density and microstructure of fabricated components by imposing changes to the cooling rate [Citation19]. Previous studies have demonstrated that the temperature history and morphology (e.g. dimension and shape) of melt pool during the LPBF building process can significantly influence the microstructure, the presence of defects (such as pores and cracks), surface roughness, and hence the mechanical performance of the fabricated components [Citation20–23]. To accurately gain insights into the complex multiphysics phenomena that occur within the melt pool during melting and solidification processes, it is vital to fully understand the MAPS process and the related fabrication mechanisms. However, the melt pool characteristics of MAPS have not been investigated as of yet.
Identifying the appropriate processing parameters is crucial for ensuring successful prints when using MAPS. Previous studies revealed that improper process parameters could result in various deficiencies such as balling, deteriorated surface finish, part shrinkage, pores microcracks, and residual stress-induced defects including warping and distortion in the loose powder LPBF [Citation24–26]. The scanning speed can not only affect the build time, but also the thermal gradient, cooling rate, and the performances of manufactured samples. A fast-scanning speed can lead to insufficient melting and poor density of samples, especially when the polymer binder is added to the MAPS process. Conversely, slow scanning can cause overheating and keyholing, resulting in voids in sub-surface layers and, once again, the poor density of manufactured samples [Citation27]. Research related to laser beam defocus has been conducted on melt pool characterisation, microstructure, and mechanical properties of additively manufactured components [Citation28–30]. In the loose powder LPBF, the focal plane of the laser beam is not always at the powder bed [Citation30]. For instance, Rashid et al. [Citation31] found that the optimal LPBF printing of AlSi12 is at a defocus setting of −3 mm. However, to date, there is no study has examined the effects of process parameters such as defocus settings and scanning speeds on melt pool characteristics and microstructure properties of steel-based components printed by MAPS.
In this study, the printability of a novel additive manufacturing (AM) technique of MAPS using a composite powder sheet feedstock material is optimised via an appropriate set of experiments. The usage of powder sheet material eliminates loose powder feedstock, thus enhancing the safety of metal AM. Unlike the binder jetting techniques, MAPS does not require post-sintering for densification. Building upon the results of the previous MAPS studies [Citation13,Citation32], this current study significantly advances the development of MAPS. As the defocus setting of the laser beam can significantly affect the energy density delivered to the feedstock, its effects on the printability and performance of MAPS printed samples were investigated for the first time. The laser beam-powder sheet interaction was characterised using a high-speed imaging technique. The characteristics of powder sheet feedstock material, their chemical composition and the microstructure of MAPS manufactured SS304 were analysed. The mechanism behind the effect of the negative defocus setting on productivity was elucidated. The successful printing of fully dense and defect-free metal parts using MAPS demonstrates its revolutionary features and also provides a new pathway for fabricating functional components.
2. Methodology
2.1. A novel powder sheet additive manufacturing method
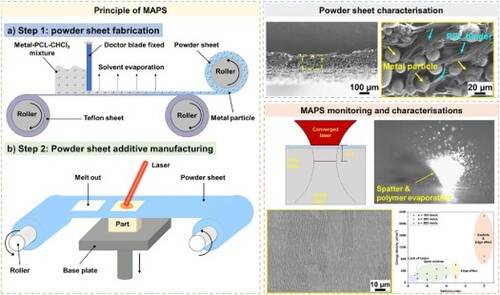
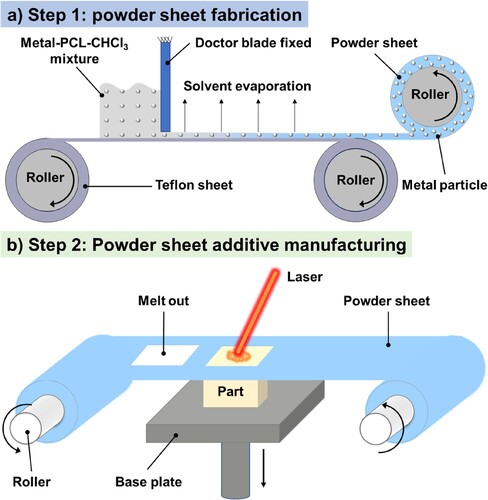
In this work, a novel breakthrough MAPS method is employed. It uses a continuity and flexible metal–polymer composite powder sheet (a) in place of the loose powder used in the conventional LPBF. The powder sheet feedstock material is integrated with the rollers and is then fed into the scanning path of a laser beam (b). As the laser beam is activated in the MAPS process, the polymer binder is evaporated due to its low boiling temperature, while the metal powder is simultaneously melted. The 3D geometry is formed by repeating the melting-solidification processes of the material. The flexibility feature of the powder sheet ensures its resistance against fractures, both during rolling and the subsequent MAPS manufacturing processes.
Figure 2. Schematic illustration of powder sheet fabrication process (a) and MAPS manufacturing by using feedstock of powder sheet (b).
The MAPS method is different from the laminated object manufacturing (LOM) or sheet lamination process in the below key aspects: (1) LOM utilises solid papers/foils as feedstock [Citation33], whereas MAPS employs a flexible metal powder-polymer binder composite; (2) In LOM, the papers/foils between different layers are bonded together by glues or binders in a layer-by-layer manner, thus, post-processing is required to achieve the desired effect [Citation34]. In MAPS, no post-processing is required; (3) LOM normally requires an additional laser or milling to cut or trim the papers/foils to the desired shape, but is not needed in the MAPS process. In addition, LOM has drawbacks such as being labour-intensive and having lower accuracy compared to other AM methods [Citation33].
The MAPS method provides many advantages over the traditional loose powder LPBF:
There is no need for handling loose powder and it is also easier to store in powder sheet format. Thus, this reduces the associated health risks for AM operators;
The powder sheet production is powder-independent and can be used for all kinds of metal materials such as titanium, stainless steel, copper, nickel, and aluminium;
Faster part-to-part setup time due to the fact that the printing chamber does not need to be deep cleaned;
Functionally graded multi-material components can be printed in a single step within the same AM system [Citation14]. This is simply done by shifting the powder sheets on the rollers to another material. Therefore, this can significantly reduce the material changeover time;
The fabrication processes and properties of powder sheets are controllable: manufacturing metal powder sheets with variations of dimensions and thicknesses is feasible by adjusting the process parameters or the ratio of metal powder to the polymer binder;
Lower material consumption and minimised waste powder production due to easy powder sheet recycling.
2.1.1. Powder sheet manufacturing
The powder sheet feedstock was prepared using a ‘solvent casting’ method (a) [Citation13,Citation35]. Firstly, a solution is made by dissolving 20 g of Polycaprolactone (PCL, (C6H10O2)n) pellets in 100 ml of CHCL3. The density of PCL pellets is 1.145 g/cm3. Secondly, a metal–polymer-solvent mixture is formed by mixing 40 g of gas-atomized SS304 powder (Carpenter Additive, particle diameter in the range of 15 - 53 µm) and 10 ml of the PCL-CHCL3 pre-solution. This is followed by casting the mixture on a flexible Teflon sheet. To obtain a uniformly distributed 120 µm setting thickness of the mixture, a doctor blade is then moved at a constant speed of 5 cm/min. The solvent subsequently evaporates from the mixture, leaving the metal powder and polymer to solidify for 15 mins in a fume hood. This results in the formation of a flexible composite film. Finally, the solidified metal- polymer composite film is peeled from the Teflon sheet. An illustration of the powder sheet fabrication process is shown in a. Further details regarding the fabrication process of the powder sheet feedstock can be found in the authors’ previous studies [Citation32,Citation36]. The chemical composition of the SS304 loose powder utilised for manufacturing the powder sheet is shown in . The packing density of the SS304 powder sheet is 52.83 ± 4.02%, calculated based on bulk density and material density [Citation13]. In this study, SS304 is utilised as an example, but the manufacturing process of powder sheets is suitable for various other metal, ceramic and cermet materials.
Table 1. Chemical composition of SS304 loose powder (wt. %).
2.1.2. Metal parts manufacturing
For MAPS manufacturing using powder sheets, a commercial Realizer SLM50 LPBF system with a continuous wave (CW) fibre laser beam and a spot diameter of 70 µm (1/e2 of Gaussian profile) was employed. The Realizer system was modified to allow for the utilisation of powder sheets instead of loose powder. To explore the printability and the optimum configurations of MAPS, 30 layers of 5 mm × 5 mm square plates were designed and then manufactured using a laser power of 100 W (which is the maximum power of the Realizer SLM 50 printer) at three different scanning speeds (100, 300 and 500 mm/s). To investigate the effect of laser defocusing (i.e. focus shift) and the resulting energy density distribution on powder sheet printing, negative defocuses (refer to the focal plane below the powder bed) of −3, −4, −5, −6 and −7 mm were used for the MAPS printing (). For comparative purposes, a print setting without any laser defocusing (i.e. 0 mm, focal plane of the laser is on the top surface of the powder bed) was also tested. To prevent the occurrence of oxidation, the prints were performed under an argon atmosphere. The commonly used hatch spacing of 100 μm in LPBF was employed for the MAPS printing. Details of the process parameters that were employed for printing SS304 samples are shown in .
Figure 3. The illustration of defocus for MAPS printing (a). The relationship between laser spot diameter and defocus, which is calculated based on reference [Citation40] (b). Power density distribution (z = 0) with different defocuses: (c) 0 mm. (d) −3 mm. (e) −4 mm. (f) −5 mm. (g) −6 mm. (h) −7 mm.
![Figure 3. The illustration of defocus for MAPS printing (a). The relationship between laser spot diameter and defocus, which is calculated based on reference [Citation40] (b). Power density distribution (z = 0) with different defocuses: (c) 0 mm. (d) −3 mm. (e) −4 mm. (f) −5 mm. (g) −6 mm. (h) −7 mm.](/cms/asset/7a1e2681-27f3-46bd-8c9e-43fc073a5ee4/nvpp_a_2361856_f0003_oc.jpg)
Table 2. Process parameters used for printing functional components.
For the MAPS printing, the SS304 powder sheet was placed directly above the base plate, which is similar to the powder spreading process during the conventional LPBF using loose powder. Then, a finely focused laser beam was activated which rapidly scanned the powder sheet by following the pre-defined scanning path of the 3D model. After finishing the printing of a specific layer, the base plate was lowered by a distance equivalent to the thickness of the solidified material. Following this, the powder sheet was shifted by rotating the rollers, ensuring a new area of the powder sheet was placed above the region to be scanned. The laser beam was then switched on to manufacture the next layer. By using a specifically designed MAPS printer, the process of moving the powder sheet supply is convenient and could be realised automatically in seconds by rotating the rollers. The SS304 samples were MAPS printed by repeating the above processes using a 90-degree layer rotation of uni-directional scanning strategy [Citation37].
The volumetric power density with different defocuses was calculated by using equation [Citation2,Citation38]:
(1)
(1) where A is the heat source absorption coefficient of 0.4, P is the laser beam power, R is the laser spot radius (which changes according to the defocus setting that is used [Citation39]) and r is the distance to the laser beam centre.
The power density contour was plotted using a custom-written MATLAB (Mathworks Inc., USA, R2022a) script (c-h). The maximum power density of the laser beam occurs in the case of no laser beam defocus (0 mm). This is because it has the smallest laser spot size and thus, a more concentrated laser beam compared to other scenarios. As the magnitude of negative defocus increases, the power density decreases. However, increasing the magnitude of negative defocus leads to a larger laser beam spot diameter, resulting in greater divergence (i.e. a wider distribution).
2.2. High-speed imaging characterisation
To investigate the laser beam-powder sheet interaction, a high-speed camera (HotShot 1700CC), in conjunction with a SIGMA lens (105 mm 2.8 EX DG MACRO) were employed to monitor the MAPS manufacturing process. The high-speed camera was placed outside the protective chamber window of the printing system, and the inclination angle of the high-speed camera was roughly 20 ° to the horizontal direction. A working distance of 135 mm between the lens and the melting area was employed, representing the optimised distance for effective observation of the MAPS process by the high-speed camera. The videos in this study were recorded with 3000 frames per second (fps) and a resolution of 800 × 590 pixels. For the purpose of illumination, a powerful LED light was also used. The manufacturing process of samples by using different scanning speeds and defocus settings was filmed.
2.3. Microstructural and density measurements
To qualitatively investigate the decomposition behaviour of the SS304 powder sheet, thermalgravimetric analysis (TGA) was performed under a nitrogen environment. The MAPS manufactured as-built samples were cut using wire electric discharge machining (Excetek V440G EDM). Subsequently, the samples were mounted, followed by grinding using abrasive sandpapers. To form a mirror finish, the samples were polished using diamond suspensions of 6 µm, 3 µm and 1 µm. Polishing via the use of diamond suspensions was followed by a 0.25 µm silica solution. The relative density of printed samples was measured using the ImageJ software and is calculated by the percentage of the pixels classified as pores compared to the total number of pixels in cross-sectional optical microscopy (OM) of the polished samples [Citation41]. The microstructural grain compositions were characterised using electron backscatter diffraction (EBSD) with a step size of 1.49 μm. Specifically, the microstructure of selected samples printed with negative defocus settings of 0 mm, −4 mm and −6 mm was analysed. Finally, the polished samples were electrochemically etched and characterised using scanning electron microscopy (SEM). This was done for the purpose of conducting microstructural analysis along the cross-section of the etched samples.
3. Results and discussion
3.1. Characterisations of powder sheet
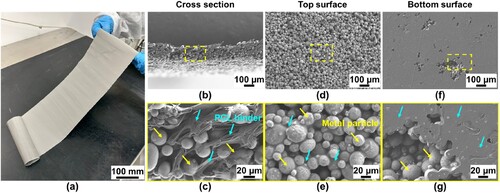
By using the powder sheet fabrication machine (a), an SS304 powder sheet was manufactured and used for the MAPS printing, as shown in a. b-g shows the corresponding SEM observations of the SS304 powder sheet in which the polymer binder connects the metal particles tightly and the particles are distributed evenly amongst the surface area and cross-section of the powder sheet. To date, there has been no evidence suggesting detachment of the metal particles from the manufactured powder sheet. SEM images show that the fabricated SS304 powder sheet has two distinct sides: a metal powder side (d-e) and a polymer side (f-g). This is caused by the drying process of the powder sheet, during which the solvent evaporates from the top of the mixture to the bottom. Due to that, the liquid is carried to the top side by capillary forces, while the meniscus begins to withdraw to the inner section of the powder sheet, as outlined in the previous studies [Citation36,Citation42]. To ensure the stabilised printing conditions, the metal powder side (d-e) was placed to be directly in contact with the surface of the base plate or the previously solidified material.
Figure 4. Manufactured SS304 powder sheet and SEM characterisations. (a) Photo of a rollable and flexible powder sheet. SEM observation of cross-section (b) with a higher magnification (c), top surface (d) with a higher magnification (e), and bottom surface (f) with a higher magnification (g) of powder sheet.
To characterise the thermal decomposition of PCL polymer binder, TGA was used with the SS304 powder sheet. a shows that the PCL polymer binder degraded from a temperature of 220 °C onwards. From 350 °C, the weight percentage of the material stabilised, which indicates the complete degradation of the PCL binder. The TGA result shows that 94.97 wt. % of the material in the powder sheet is SS304.
Figure 5. (a) TGA of SS304 powder sheet. (b) Absorption spectra for SS304 powder sheet and pure PCL polymer sheet, measured from each side.
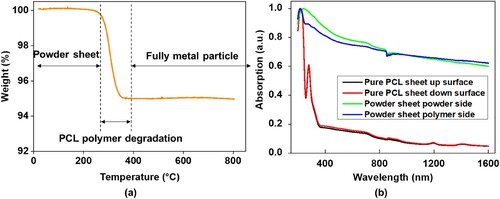
The powder sheets were also characterised by optical absorption spectroscopy, as detailed in b. Two separate samples were investigated: (1) an SS304 powder sheet with a thickness of 80 µm, which was fabricated with 20 wt.% PCL polymer and (2) a pure PCL polymer sheet which was implemented as a control and therefore had the same thickness as the SS304 powder sheet. Due to the discrepancies between the top and bottom sides of the powder sheets (), the absorption was measured from both sides to determine whether the powder sheet orientation affects the amount of absorbed power during laser processing. From the measured curves (b), despite a difference in absorption in the UV (200 - 400 nm) and visible regimes (400 - 700 nm), there is no marked difference from 800 to 1200 nm. Given that the wavelength of the laser used in these experiments is 1064 nm, it can be determined that the power delivered to the powder sheets will not be affected by whichever side of the powder sheet is in contact with the build plate. There is no observable difference in the sides of the PCL control sheet.
3.2. Single tracks scanning
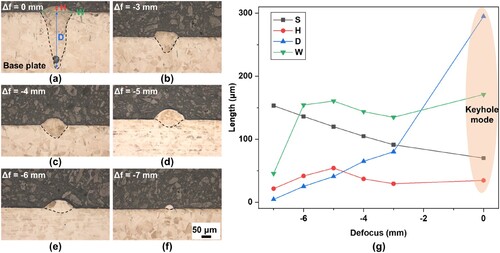
To investigate the effect of laser beam defocusing and thus the energy density distribution on printability, preliminary studies were made using single tracks using a scanning speed of 100 mm/s and a laser power of 100 W. The corresponding cross-sectional observations of the deposited single lines are shown in . A keyhole type of defect was observed when printing the single line without using defocus (a). reveals that the melt pool depth reduced as the magnitude of negative defocus increased due to less energy input [Citation43] (). The area of processed material above the base plate increased with the increase in magnitude of negative defocus from 0 to −6 mm. This phenomenon can be attributed to the reduction in vapour pressure exerted on the melt pool due to lower energy input. At the print using a −7 mm defocus setting, a shallow melt pool was formed, resulting from a lack-of-fusion of the material due to less energy input. The decrease of the melt pool depth with the increase in magnitude of negative defocus has also been found in the loose powder LPBF [Citation43].
Figure 6. OM observations of melt pool morphology of single lines printed using a constant scanning speed of 100 mm/s and laser power of 100 W with different defocus settings: (a) 0 mm, (b) −3 mm, (c) −4 mm, (d) −5 mm, (e) −6 mm and (f) −7 mm. (g) Statistics of the melt pool morphology with S represents laser spot diameter, H represents melt pool depth above the base plate, D means melt pool depth below the base plate and W means the melt pool width.
3.3. The effect of negative defocus on printability of MAPS
3.3.1. High-speed camera observation with a variation of process parameters
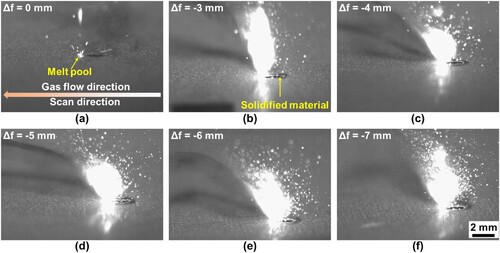
To monitor the MAPS printing process and to understand the laser-material interaction when using different process parameters such as defocus settings and scanning speeds, high-speed imaging was employed. The time is counted from when the laser beam is switched on. shows significantly different laser beam-powder sheet interactions and evolutions with time at no defocus of 0 mm and defocus setting of −6 mm, when using a constant scanning speed of 100 mm/s. A noticeable difference in the evaporation behaviour (i.e. vapour plume) is observed, whereby a much larger area of hot vapour plume can be seen at the defocus setting of −6 mm compared to that of the 0 mm print. When using the negative defocus strategy in MAPS, a larger amount of byproducts (polymer evaporation and metal particles) were observed to flow away with the inert gas, as evidenced by its evolution over time. This is caused by the larger laser spot size, the larger laser beam-material interaction area, and the divergence feature of the laser beam () [Citation39,Citation44]. When MAPS printing uses the no defocus setting (a-c), the appearance of pores (a) can be attributed to the high energy density input (), a smaller amount of binder degradation flowing away with the inert gas and an increased entrainment of byproducts into the melt pool.
Figure 7. Comparison of high-speed imaging for MAPS printing and evolution with time at no defocus (0 mm, a-c) and negative defocus setting of −6 mm (d-f). (a) and (d) at 0.667 ms. (b) and (e) at 10 ms. (c) and (f) at 50 ms.
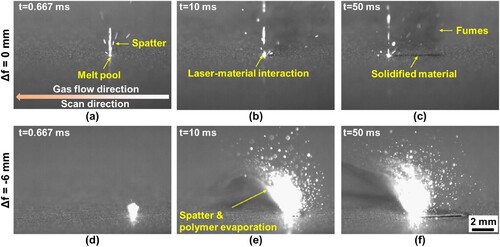
For printing at the defocus setting of −6 mm, the dynamics of polymer binder removal can be monitored, as shown in the hot vapour area in d-f. However, this cannot be done in the case of printing at a defocus setting of 0 mm. This is caused by the lower power density that was emitted and a larger laser beam spot size when using a −6 mm defocus setting [Citation28] (). The spatter behaviour that occurs in the conventional loose powder LPBF is also observed in the MAPS printing, attributed to the interaction between the high-energy laser beam and powder particles [Citation45]. For both the 0 mm and −6 mm defocus prints, the area of the hot vapour plume increased over time, due to the heightened thermal accumulation with the increased length of the scanning vector [Citation2,Citation46].
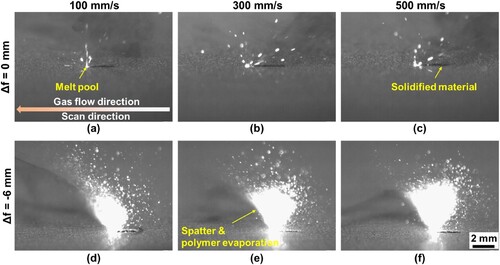
The effect of scanning speed on MAPS printing was also investigated at a setting with no defocus (0 mm, a-c) and a setting with a defocus of −6 mm (d-f). For both cases, the area of the vapour plume increases with the increase in scanning speed. This is because the faster the scanning speed, the lower the energy density, which is consistent with the decrease in laser beam defocus magnitude in . At the no defocus print setting of 0 mm, the spatter ejection became more violent as the scanning speed increased from 100 mm/s to 500 mm/s, due to the more unstable printing process with the increase in scanning speed [Citation16]. It is interesting to observe that increasing the laser scanning speed from 100 mm/s to 500 mm/s resulted in a change in the inclined direction of the vapour plume for both print settings: transitioning from forwards to backwards with respect to the scanning direction. This phenomenon also happened in the loose powder LPBF [Citation16,Citation47]. At the scanning speed of 300 mm/s, the bright spatters were ejected, and the polymer binder was evaporated upward in various directions.
Figure 8. High-speed imaging for MAPS printing at defocuses of 0 mm (a-c) and −6 mm (d-f) and three different scanning speeds of 100 mm/s, 300 mm/s, and 500 mm/s, respectively. (a) and (d) for 100 mm/s. (b) and (e) for 300 mm/s. (c) and (f) for 500 mm/s.
shows the overall comparison of high-speed imaging by six different defocus settings (0, −3, −4, −5, −6 and −7 mm) at a constant laser power of 100 W and scanning speed of 100 mm/s. Significant differences in high-speed imaging were observed between the case of no defocus (i.e. 0 mm) and those of negative defocus settings ranging from −3 mm to −7 mm. It can be seen from that with the increase in the magnitude of negative defocus from 0 mm to −7 mm, in general, there is an increasing area of vapour plume formed. When printing using the negative defocus settings, a bright saturated region appeared in the high-speed images. This region contains the vapour plume comprising metal and polymer binder, along with a cone of bright spatters. This is because of the increase in laser spot size (), which also influences the laser beam-powder sheet interaction. At defocus settings of −4 mm to −7 mm (c-f), the divergence in energy input of the laser beam facilitates the evaporation of the polymer binder, due to the porous feature of the cross-section of the powder sheet (). A similar phenomenon has been observed in another study of loose powder LPBF [Citation47]. When printing using the defocus setting of 0 mm, the area of the vapour plume is quite small, and only some spatters were ejected from the melt pool.
Figure 9. High-speed images by six different defocus settings: (a) 0 mm. (b) −3 mm. (c) −4 mm. (d) −5 mm. (e) −6 mm. (f) −7 mm.
3.3.2. Characterisations of MAPS printed samples
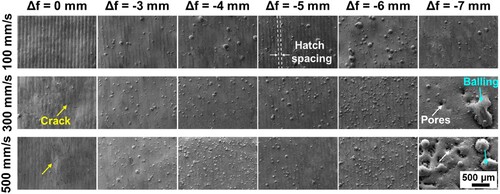
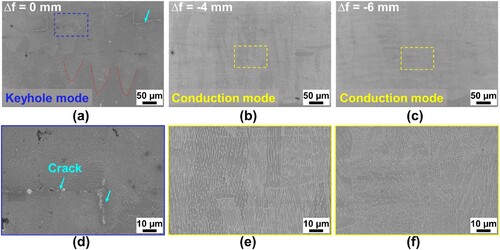
SEM observations of the top surface of SS304 samples printed with powder sheet feedstock and using different defocus settings and scanning speeds are shown in . When printing without any defocus of the laser beam (Δf = 0 mm), cracks occurred at the top surface of samples printed at the scanning speeds of 300 mm/s and 500 mm/s, respectively. This is caused by a higher thermal input than other cases (i.e. defocus settings from −3 to −7 mm). There are more partially melted metal particles and spatters that are connected with the top surface of printed samples for prints conducted with negative defocus settings (−3 mm to −7 mm), in comparison to prints that were made with no defocus. This also mitigated cracks at the top surface, due to the lower energy density of the prints with a negative defocus setting. When printing at a defocus setting of −7 mm and scanning speeds between 300 mm/s and 500 mm/s, pores and balling phenomena were formed. This is owed to a lack of fusion (round-shaped pores) as a result of the energy distribution being too divergent and not being dense enough to melt the raw material [Citation48]. For all the other cases, there is no obvious appearance of cracking, balling, porosity, or other defects at the top surface of the printed samples.
Figure 10. SEM observation at the top surface of SS304 samples printed by different scanning speeds (100, 300 and 500 mm/s) and defocus settings (0, −3, −4, −5, −6 and −7 mm).
illustrates the relative density and geometric accuracy of samples printed using different defocus settings and scanning speeds. Cracks and keyhole mode defect are present at the cross-section of samples printed with a defocus setting of 0 mm for all three scanning speeds. This is due to the higher thermal input compared to other defocus settings, which is consistent with the SEM observation at the top surface of samples (). At the no defocus printing, the interaction between the laser beam and powder sheet above the build surface is smaller than at the negative defocus (). Thus, more energy reached the build surface that caused the keyhole mode defect [Citation44]. Digging () occurred at the boundary of the square plate at the highest energy density (i.e. defocus of 0 mm and scanning speed of 100 mm/s), instead of only being deposited on the base plate. There are round-shaped pores formed at the cross-section, which is caused by gas entrapment. Such an observation is consistent with those made in another conventional LPBF study using loose powder [Citation28].
Figure 11. Optical micrographs of polished cross sections showing geometry and density of SS304 samples printed by different scanning speeds (100, 300 and 500 mm/s) and defocus settings (0 mm, −3 mm, −4 mm, −5 mm, −6 mm, and −7 mm).
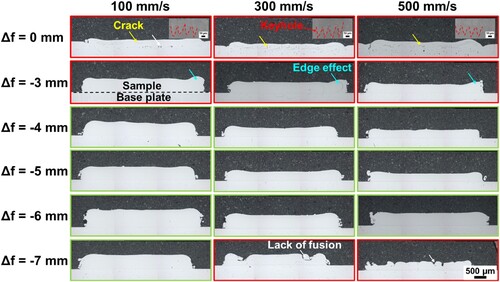
At defocus settings of 0 mm and −3 mm, the ‘edge effect’ appeared, which means that the edge of the sample is higher than that of the central area. This phenomenon is induced by increased amounts of surface tension, mass transfer, stress, and heat accumulation along the sample edges. Additionally, the boundary of the samples experiences a lower temperature than the central area due to convection and radiation from the edges of the sample into the surrounding atmosphere [Citation49–51]. The ‘edge effect’ affects the contact of the powder sheet with the top surface of the previously solidified material, thus influencing the successive deposition of powder sheet material. At the defocus setting of −7 mm and scanning speeds of 300 mm/s and 500 mm/s, there are lack-of-fusion defects formed due to a lower energy input compared to other processing parameters. This is consistent with what is shown in the top surface images of samples (). Comparing geometries from defocus settings of −4 mm to −7 mm with that of the 0 mm print geometry, the ‘edge effect’ reduced. This is in agreement with a similar study when using LPBF and not MAPS, whereby it was found that a lower energy density reduced the edge ridges in LPBF with feedstock of loose powder [Citation51,Citation52].
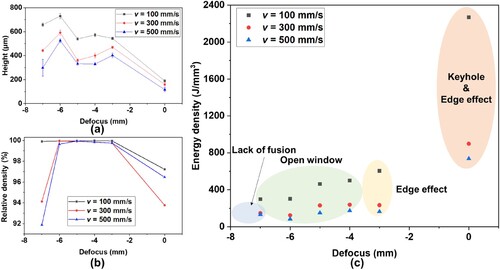
a shows the changes in the total height of 30-layer samples with defocus and scanning speed. For all cases, regardless of the defocus employed, the total height of the sample decreases with the increase in scanning speed. For instance, the total height of a sample is 28.08% less at a scanning speed of 500 mm/s (524.84 μm) than that of 100 mm/s (729.78 μm) for samples that were manufactured at the same defocus setting of −6 mm. This is because the slower the scanning speed is, the higher the volume of metal particles that are involved in the melt pool. This subsequently caused a larger melt pool width and depth [Citation30]. Due to the different energy density inputs (), the total height of the sample is the highest at the defocus setting of −6 mm, while the lowest sample height is recorded at the defocus setting of 0 mm. Due to the energy input being too high for powder sheet printing at a defocus setting of 0 mm, a significant amount of material evaporated, thus causing the lowest total height of the MAPS printed sample. The larger spot size when using the negative defocus setting can attract a higher amount of material to the melt pool, thus causing an increased height of the MAPS printed samples before the laser beam becomes too divergent to melt the material [Citation44].
Figure 12. (a) The relationship of 30-layer SS304 sample’s total height and defocus and scanning speed. (b) Relative density of samples manufactured by different defocus settings and scanning speeds. (c) Open window for MAPS printing with different scanning speeds and defocus settings.
In the loose powder LPBF printing, the layer thickness of solidified material is determined by the recoater in conjunction with stage movement. Varying amounts of loose powder material are unevenly delivered for a new layer according to the morphology of the previous layer. However, this process differs in the MAPS printing. In MAPS, the powder sheet is directly placed over the previously deposited material and therefore cannot compensate for the varying layer thicknesses that are experienced over the cross-sectional area of the sample as a result of varying process parameters. Therefore, MAPS eliminates the concept of layer thickness, and the thickness of solidified material depends on process parameters and can be magnified with the increased printing height of samples.
The relative density of all the samples printed using different defocus settings and scanning speeds is shown in b. When printing using defocus settings that range from −3 mm to −6 mm, the relative density of the 5 mm × 5 mm square plate is always higher than 99.65%, regardless of the scanning speed employed. The high relative density of the MAPS manufactured samples indicates that the vaporised polymer gases () have negligible effects on the fusion of the metal parts. The relative density of the sample that was printed with the lowest defocus setting of −7 mm and a scan speed of 100 mm/s is also high (99.91%) and can thus be used for printing. in conjunction with indicate that improving geometric accuracy is beneficial for improving the relative density of printed samples, due to better contact between the placed powder sheet for the next layer and the previously solidified layer of material. The volumetric energy density of all the printing settings was calculated by following the calculation equation in reference [Citation53]. In this work, the energy density calculation equation (Equationeq. 1(1)
(1) ) is applied for the negative defocus setting only. It is uncertain what will happen when the positive defocus setting is used, as the convergence or divergence of the laser beam is not considered in the energy density calculation equation, despite its crucial role in AM printing. c reveals that for printing high-quality samples using MAPS, the energy density should be in the range of 83.973 J/mm3 to 500.07 J/mm3. When using a higher energy density (e.g. 604.68 J/mm3), issues such as cracking and the ‘edge effect’ appeared on the MAPS printed samples ().
shows the SEM observation of the melt pool morphology of electrochemically etched samples, which were printed using a 100 W laser power, 300 mm/s scanning speed and three different defocus settings (0 mm, −4 mm and −6 mm). Printing without defocus (0 mm) led to the formation of a keyhole mode of laser beam melting (a and d) [Citation54]. This scenario is caused by the addition of polymer in the powder sheet feedstock. Hereby, evaporation from both metal and polymer elements quite possibly increased the development and formation of a vapour cavity. In comparison, when printing at negative defocus settings (−4 mm and −6 mm), the melt pool became shallow, transitioning into the conduction mode of the melt pool (b and c). This shift resulted in improved geometric accuracy () and relative density of samples (). Remarkably, when printing using the negative defocus settings, no macro-defects such as cracks or pores are observed at the interface between adjacent layers, indicating the achievement of metallurgical interfacial bonding. Therefore, the optimum MAPS printing configuration is with a negative defocus setting between −4 mm and −6 mm.
Figure 13. SEM observation of electrochemically etched 30-layer SS304 samples printed with different defocus settings: (a) and (d) 0 mm defocus. (b) and (e) −4 mm defocus. (c) and (f) −6 mm defocus.
The optimum defocus values in this study can be seen to depart from the default setpoint that is typically used in the conventional LPBF. One reason is that the negative defocus strategy reduced the energy density distribution, resulting in the conduction mode of the melt pool. Additionally, the evaporation of the PCL binder can absorb extra energy in comparison to the conventional LPBF process using loose powder feedstock. This can influence the melting and cooling dynamics of the metal material in MAPS. Furthermore, the evaporation of the polymer binder caused accumulation on the optical window of the laser. That can absorb, scatter or defocus some amounts of the energy that is emitted from the laser beam [Citation39]. Consequently, this can alter the energy distribution and thus the focal plane of the laser beam. The effect of absorption decreased with the increase in magnitude of the negative defocus setting [Citation43].
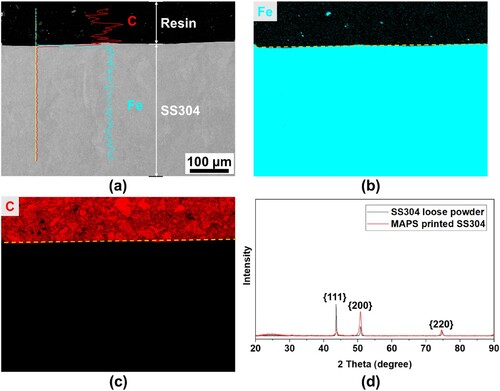
To characterise if there is any PCL polymer binder residual in MAPS printed SS304 samples, Energy-dispersive X-ray spectroscopy (EDX) mapping was performed on the print using the −6 mm defocus setting. The results show an insignificant C signal in the printed sample as all the polymer binder had been decomposed during the melting process (a-c). XRD results (d) show that there is no significant oxide phase or other new phases in existence within the MAPS printed sample, compared to that of the loose powder. It is however unclear if a slight shifting of the peaks has taken place, perhaps indicating some forms of lattice distortion in the MAPS printed sample when compared to the raw powder.
Figure 14. EDX analysis for the chemical composition of the MAPS printed SS304: line analysis (a), mapping for the Fe element (b), mapping for the C element (c). XRD comparison of MAPS printed SS304 with loose powder (d).
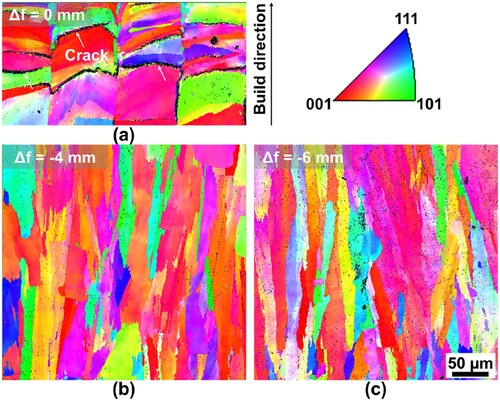
To assess the effect that defocusing on the crystallographic properties, EBSD was performed. All three samples were fabricated with a laser power of 100 W and a scanning speed of 300 mm/s, but using three different defocus settings (0 mm, −4 mm and −6 mm). Characteristic inverse pole figure (IPF) maps are displayed in . Austenite was the only phase detected in all three samples, which is consistent with the previous report [Citation55]. In terms of crystallographic texture, none of the samples exhibited a particularly prominent texture, which again is in agreement with the previous results [Citation55]. For the samples printed using defocus settings (b-c), elongated grains aligned with the printing direction were observed, which is consistent with the loose powder LPBF [Citation56]. However, the grain direction changed in the sample printed with no defocus setting (a), where cracks occurred along the boundaries of grains. Due to the lower productivity at the no defocus setting compared to the negative defocus settings (a), a smaller area was chosen for EBSD analysis in the sample printed using the no defocus setting (a) than the samples that were printed using negative settings (b and c). The location for the EBSD characterisation is close to the base plate, combined with the high energy input when using the no defocus setting, leading to a complex grain growth path (i.e. not along the printing direction) during AM [Citation57].
Figure 15. EBSD orientation maps perpendicular to the build direction for 0 mm no defocus setting (a), −4 mm defocus setting (b) and −6 mm defocus setting(c). The ternary chart with colours corresponds with crystallographic orientations for austenite.
illustrates the effects of defocus setting on the formation mechanism of the melt pool and the MAPS manufacturing process of MAPS. When utilising the no defocus setting for MAPS manufacturing, vapour evaporation from the polymer binder can entrain into the melt pool. This is a result of the smaller spot size inducing a smaller powder sheet heat-affected zone and thus insufficient time for the vapour to escape. The entrainment of vapour and the larger energy density in the no defocus setting can cause a keyhole mode of the melt pool (a) [Citation24]. In contrast, when printing using a negative defocus setting, the powder sheet heat affected zone is larger than that of the no defocus setting. This allows for the release of polymer degradation induced vapour before laser scanning of metal material, thereby leading to the formation of a conduction mode of the melt pool (d). This finding is consistent with the experimental results from the high-speed imaging that a larger amount of byproducts such as vapour induced by the polymer degradation is observed when printing at the negative defocus setting than the no defocus ().
Figure 16. Schematic illustration of the defocus setting effect on MAPS printing: no defocus setting (a-c) and negative defocus setting (d-f).
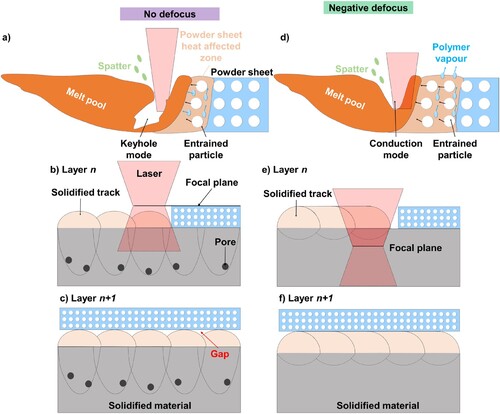
When printing using the no defocus setting, the smaller laser beam spot diameter and thus the smaller area of laser beam-material interaction can generate a gap between the newly placed powder sheet for layer n+1 and the previously solidified material of layer n (b-c). In MAPS, the gap can affect the interaction between laser beam and powder sheet material, leading to the formation of defects such as cracks (). On the other hand, MAPS printing with a negative defocus setting, characterised by a larger area of laser-material interaction, can entrain more metal particles into the melt pool, resulting in the formation of a more flatten top surface of the solidified material (e-f) compared to printing using the no defocus setting [Citation44].
4. Conclusions
A novel additive manufacturing method (MAPS) was employed for the fabrication of metal components using metal–polymer composite powder sheets. The formation mechanism of the melt pool during the MAPS printing was investigated. High-speed imaging was utilised to monitor the MAPS manufacturing process, providing a fundamental understanding of the manufacturing process. Furthermore, the effects of process parameters such as laser beam defocus and scanning speed on SS304 were thoroughly examined. This included analysis of aspects such as the geometrical accuracy, relative density, height, and microstructure of MAPS printed SS304 samples. The main conclusions include:
The formation mechanism of the melt pool during MAPS printing is investigated using S304 material as an example, revealing that a conduction mode of the melt pool is achieved when printing using a negative defocus strategy. This prevents the occurrence of the keyhole mode defect observed when printing using no defocus. This phenomenon results from reduced vapour entrainment into the melt pool.
Defocusing of the laser has been shown to have significant effects on the geometrical accuracy, relative density and microstructure of MAPS manufactured samples, which is caused by the different energy density distributions. When the defocus setting is in the range of −4 mm to −6 mm and the scanning speed is between 100 to 500 mm/s, high relative density specimens without cracking are obtained. However, when the defocusing setting is −7 mm, a crack-free specimen with high relative density is obtained for the 100 mm/s scanning speed only.
The printing efficiency is controllable by adjusting the negative defocus settings and scanning speeds. The average layer thickness of MAPS printed samples is process parameters dependent. Specifically, the average layer thickness decreases with the increase in scanning speed, regardless of the defocus applied. This is because the faster the scanning speed that is implemented, the fewer metal particles that are attracted into the melt pool. The average layer height of the sample printed at a −6 mm defocus setting and 500 mm/s scanning speed was 39.05% less than that of the sample printed with a 100 mm/s scanning speed.
An in-situ high-speed camera was employed to monitor the evolution of the vapour plume during MAPS manufacturing. The powder sheet printing process and performances of printed samples are highly dependent on the evaporation characteristics. A key factor is the negative defocus, due to its reduced energy density input, converged feature, and larger laser beam-powder sheet interaction than that of the no-defocus print.
The mechanism to mitigate defects in MAPS printed SS304 is examined. Improving the geometrical accuracy could simultaneously increase the relative density of the MAPS manufactured samples, attributed to the better contact of the powder sheet with the previously solidified material underneath. Thus, this can provide more stabilised MAPS printing.
The innovation of MAPS not only significantly improves feedstock safety but also effectively minimises the risk of material cross-contamination. We found that the productivity of MAPS increased with the negative defocus setting for the first time, a finding that could also be applied to the LPBF printing. We delved into the detailed formation mechanisms of various defects, including the keyhole mode defect of the melt pool, cracks, and lack-of-fusion. Through these investigations, an effective solution has been identified using the negative defocus setting, resulting in the successful fabrication of defect-free SS304 samples. These insights and findings have substantial implications, particularly in achieving the optimum configurations for printing large-scale functional metal components. Therefore, our study makes a noteworthy and valuable contribution to the AM community.
Further research should be focused on evaluating the mechanical performance (e.g. tensile and fatigue properties) of MAPS printed samples and comparing these properties with those of the conventional loose powder LPBF. Furthermore, the production of an in-house printer which will be customised towards using a feedstock of powder sheets is ongoing. This printer will incorporate a higher laser power in an effort to obtain a wider processing window to print high-quality samples. Finally, future studies should explore the evolution mechanism of microstructure and interfacial bonding mechanism during the MAPS.
Acknowledgement
The authors gratefully acknowledge the funding from EIT Raw Materials (grant number: 22021), Enterprise Ireland (CF-2020-1564-A/B), European Innovation Council Pathfinder project (101046835), Science Foundation Ireland (18/EPSRC-CDT/3581 and 17/CDA/4704), Engineering and Physical Sciences Research Council (EP/S023259/1), Deutsche Forschungsgemeinschaft (SY 217/1-1) and the AML in Trinity College Dublin. EIT RawMaterials is supported by EIT, a body of the European Union. We acknowledge the technical contribution of Prof. Jonathan Coleman and Dr. Ningsong Fan from TCD.
Disclosure statement
No potential conflict of interest was reported by the author(s).
Data availability statement
The authors confirm that the data supporting the findings of this study are available within the article.
Additional information
Funding
References
- Zhang W, Guo D, Wang L, et al. X-ray diffraction measurements and computational prediction of residual stress mitigation scanning strategies in powder bed fusion additive manufacturing. Addit Manuf. 2023;61:103275. doi:10.1016/j.addma.2022.103275
- Zhang W, Tong M, Harrison NM. Scanning strategies effect on temperature, residual stress and deformation by multi-laser beam powder bed fusion manufacturing. Addit Manuf. 2020;36:101507. doi:10.1016/j.addma.2020.101507
- Su J, Jiang F, Teng J, et al. Recent innovations in laser additive manufacturing of titanium alloys. Int J Extreme Manuf. 2024;6(3):032001. doi:10.1088/2631-7990/ad2545
- Bodner SC, Hlushko K, van de Vorst LTG, et al. Graded Inconel-stainless steel multi-material structure by inter- and intralayer variation of metal alloys. J Mater Res Technol. 2022;21:4846–4859. doi:10.1016/j.jmrt.2022.11.064
- Wei C, Zhang Z, Cheng D, et al. An overview of laser-based multiple metallic material additive manufacturing: from macro- to micro-scales. Int J Extreme Manuf. 2021;3(1):012003. doi:10.1088/2631-7990/abce04
- Guo C, Wei S, Wu Z, et al. Effect of dual phase structure induced by chemical segregation on hot tearing reduction in additive manufacturing. Mater Des. 2023;228:111847. doi:10.1016/j.matdes.2023.111847
- Wen Y, Zhang B, Narayan RL, et al. Laser powder bed fusion of compositionally graded CoCrMo-Inconel 718. Addit Manuf. 2021;40:101926. doi:10.1016/j.addma.2021.101926
- Blakey-Milner B, Gradl P, Snedden G, et al. Metal additive manufacturing in aerospace: a review. Mater Des. 2021;209:110008. doi:10.1016/j.matdes.2021.110008
- Hung CH, Sutton A, Li Y, et al. Enhanced mechanical properties for 304L stainless steel parts fabricated by laser-foil-printing additive manufacturing. J Manuf Process. 2019;45:438–446. doi:10.1016/j.jmapro.2019.07.030
- Rittinghaus S-K, Throm F, Wilms MB, et al. Laser fusion of powder and foil – a multi material approach to additive manufacturing. Lasers Manuf Mater Process. 2022;9(4):569–589. doi:10.1007/s40516-022-00190-6
- Bodner SC, van de Vorst LTG, Zalesak J, et al. Inconel-steel multilayers by liquid dispersed metal powder bed fusion: microstructure, residual stress and property gradients. Addit Manuf. 2020;32:101027. doi:10.1016/j.addma.2019.101027
- Guan J, Wang Q. Laser powder bed fusion of dissimilar metal materials: a review. Materials (Basel). 2023;16(7):2579. doi:10.3390/ma16072757
- Zhang W, Lu X, Coban A, et al. Powder sheet additive manufacturing of multi-material structures: experimental and computational characterizations. Compos Part B: Eng. 2024;272:111203. doi:10.1016/j.compositesb.2024.111203
- Zhang W, Sasnauskas A, Coban A, et al. Powder sheets additive manufacturing: principles and capabilities for multi-material printing. Addit Manuf Lett. 2024;8:100187. doi:10.1016/j.addlet.2023.100187
- Zhang W, Pullini D, Alberghini M, et al. Material incorporation in powder sheet additive manufacturing toward lightweight designs for future mobility. J Laser Appl. 2024;36(2). doi:10.2351/7.0001348
- Bidare P, Bitharas I, Ward RM, et al. Fluid and particle dynamics in laser powder bed fusion. Acta Mater. 2018;142:107–120. doi:10.1016/j.actamat.2017.09.051
- Bitharas I, Parab N, Zhao C, et al. The interplay between vapour, liquid, and solid phases in laser powder bed fusion. Nat Commun. 2022;13(1):2959. doi:10.1038/s41467-022-30667-z
- Taheri Andani M, Dehghani R, Karamooz-Ravari MR, et al. A study on the effect of energy input on spatter particles creation during selective laser melting process. Addit Manuf. 2018;20:33–43. doi:10.1016/j.addma.2017.12.009
- King WE, Anderson AT, Ferencz RM, et al. Laser powder bed fusion additive manufacturing of metals; physics, computational, and materials challenges. Appl Phys Rev. 2015;2(4):041304. doi:10.1063/1.4937809
- Wang Q, Zhang W, Li S, et al. Material characterisation and computational thermal modelling of electron beam powder bed fusion additive manufacturing of Ti2448 Titanium alloy. Materials. 2021;14(23):7359. doi:10.3390/ma14237359
- Chen Q, Zhao Y, Strayer S, et al. Elucidating the effect of preheating temperature on melt pool morphology variation in Inconel 718 laser powder bed fusion via simulation and experiment. Addit Manuf. 2020;37:101642. doi:10.1016/j.addma.2020.101642
- Zhang W, Abbott WM, Sasnauskas A, et al. Process parameters optimisation for mitigating residual stress in dual-laser beam powder Bed fusion additive manufacturing. Metals. 2022;12(3):420. doi:10.3390/met12030420
- Zhang W, Tong M, Harrison NM. Multipart build effects on temperature and residual stress by laser beam powder bed fusion additive manufacturing, 3D. Printing Addit Manuf. 2023;10(4):749–761. doi:10.1089/3dp.2021.0143
- Guo L, Wang H, Liu H, et al. Understanding keyhole induced-porosities in laser powder bed fusion of aluminum and elimination strategy. Int J Mach Tools Manuf. 2023;184:103977. doi:10.1016/j.ijmachtools.2022.103977
- Yeung H, Kim FH, Donmez MA, et al. Keyhole pores reduction in laser powder bed fusion additive manufacturing of nickel alloy 625. Int J Mach Tools Manuf. 2022;183:103957. doi:10.1016/j.ijmachtools.2022.103957
- Gu D, Guo M, Zhang H, et al. Effects of laser scanning strategies on selective laser melting of pure tungsten. Int J Extreme Manuf. 2020;2(2):025001. doi:10.1088/2631-7990/ab7b00
- Wu AS, Brown DW, Kumar M, et al. An experimental investigation into additive manufacturing-induced residual stresses in 316L stainless steel. Metall Mater Trans A. 2014;45(13):6260–6270. doi:10.1007/s11661-014-2549-x
- Xiaojia N, Chen Z, Qi Y, et al. Effect of defocusing distance on laser powder bed fusion of high strength Al–Cu–Mg–Mn alloy. Virtual Phys Prototyp. 2020;15:1–15. doi:10.1080/17452759.2019.1644184
- Kunimine T, Miyazaki R, Yamashita Y, et al. Effects of laser-beam defocus on microstructural features of compositionally graded WC/Co-alloy composites additively manufactured by multi-beam laser directed energy deposition. Sci Rep. 2020;10(1):8975. doi:10.1038/s41598-020-65429-8
- Metelkova J, Kinds Y, Kempen K, et al. On the influence of laser defocusing in selective laser melting of 316L. Addit Manuf. 2018;23:161–169. doi:10.1016/j.addma.2018.08.006
- Rahman Rashid RA, Ali H, Palanisamy S, et al. Effect of process parameters on the surface characteristics of AlSi12 samples made via selective laser melting. Mater Today: Proc. 2017;4(8):8724–8730.
- Rocco Lupoi RP. A product and method for powder feeding in powder bed 3d printers. Int Appl. 2020. https://patents.google.com/patent/US20220126372A1/en
- Shen Y, Li Y, Chen C, et al. 3D printing of large, complex metallic glass structures. Mater Des. 2017;117:213–222. doi:10.1016/j.matdes.2016.12.087
- Aboulkhair NT, Bosio F, Gilani N, et al. Chapter six - Additive manufacturing processes for metals. In: J Kadkhodapour, S Schmauder, F Sajadi, editors. Quality analysis of additively manufactured metals. Elsevier; 2023. p. 201–258.
- Volpp J, Zhang W, Abbott W, et al. Binder Evaporation during Powder Sheet Additive Manufacturing, Solid Freeform Fabrication Symposium, Austin Texas, 2023, pp. 324–328.
- Lupoi R, Abbott WM, Senthamaraikannan R, et al. Metal additive manufacturing via a novel composite material using powder and polymers formed in sheets. CIRP Ann. 2022;71:181–184. doi:10.1016/j.cirp.2022.03.012
- Jia H, Hua S, Wang H, et al. Scanning strategy in selective laser melting (SLM): a review. The Int J Adv Manuf Technol. 2021;113:2413–2435. doi:10.1007/s00170-021-06810-3
- Zhang Z, Huang Y, Rani Kasinathan A, et al. 3-Dimensional heat transfer modeling for laser powder-bed fusion additive manufacturing with volumetric heat sources based on varied thermal conductivity and absorptivity. Opt Laser Technol. 2019;109:297–312. doi:10.1016/j.optlastec.2018.08.012
- Gaikwad A, Williams R, Winton H, et al. Multi phenomena melt pool sensor data fusion for enhanced process monitoring of laser powder Bed fusion additive manufacturing. Mater Des. 2022;221:110919. doi:10.1016/j.matdes.2022.110919
- Bean GE, Witkin DB, McLouth TD, et al. Effect of laser focus shift on surface quality and density of Inconel 718 parts produced via selective laser melting. Addit Manuf. 2018;22:207–215. doi:10.1016/j.addma.2018.04.024
- Ronneberg T, Davies CM, Hooper PA. Revealing relationships between porosity, microstructure and mechanical properties of laser powder bed fusion 316L stainless steel through heat treatment. Mater Des. 2020;189:108481. doi:10.1016/j.matdes.2020.108481
- Riedel R, Chen I-W. Ceramics Science and Technology; 2011.
- Liu B, Fang G, Lei L, et al. Experimental and numerical exploration of defocusing in Laser Powder Bed Fusion (LPBF) as an effective processing parameter. Opt Laser Technol. 2022;149:107846. doi:10.1016/j.optlastec.2022.107846
- Zhao P, Zhang Y, Liu W, et al. Influence mechanism of laser defocusing amount on surface texture in direct metal deposition. J Mater Process Technol. 2023;312:117822. doi:10.1016/j.jmatprotec.2022.117822
- Wang D, Dou W, Ou Y, et al. Characteristics of droplet spatter behavior and process-correlated mapping model in laser powder Bed fusion. J Mater Res Technol. 2021;12:1051–1064. doi:10.1016/j.jmrt.2021.02.043
- Ogoke F, Farimani AB. Thermal control of laser powder bed fusion using deep reinforcement learning. Addit Manuf. 2021;46:102033. doi:10.1016/j.addma.2021.102033
- Zheng H, Li H, Lang L, et al. Effects of scan speed on vapor plume behavior and spatter generation in laser powder bed fusion additive manufacturing. J Manuf Process. 2018;36:60–67. doi:10.1016/j.jmapro.2018.09.011
- Zhang B, Li Y, Bai Q. Defect formation mechanisms in selective laser melting. A review. Chin J Mech Eng. 2017;30(3):515–527. doi:10.1007/s10033-017-0121-5
- D’Accardi E, Krankenhagen R, Ulbricht A, et al. Capability to detect and localize typical defects of laser powder bed fusion (L-PBF) process: an experimental investigation with different non-destructive techniques. Prog Addit Manuf. 2022;7:1239-1256. doi:10.1007/s40964-022-00297-4
- Metelkova J, de Formanoir C, Haitjema H, et al. Elevated edges of metal parts produced by laser powder bed fusion: characterization and post-process correction. Joint Special Interest Group Meeting between euspen and ASPE Advancing Precision in Additive Manufacturing Ecole Centrale de Nantes, France, September 2019. https://www.euspen.eu/knowledge-base/AM19105.pdf
- Paraschiv A, Matache G, Constantin N, et al. Investigation of scanning strategies and laser remelting effects on top surface deformation of additively manufactured IN 625. Materials. 2022;15:3198. doi:10.3390/ma15093198
- Matache G, Vladut M, Paraschiv A, et al. Edge and corner effects in selective laser melting of IN 625 alloy. Manuf Rev. 2020;7:8. doi:10.1051/mfreview/2020008
- Liu SY, Li HQ, Qin CX, et al. The effect of energy density on texture and mechanical anisotropy in selective laser melted Inconel 718. Mater Des. 2020;191:108642. doi:10.1016/j.matdes.2020.108642
- King WE, Barth HD, Castillo VM, et al. Observation of keyhole-mode laser melting in laser powder-bed fusion additive manufacturing. J Mater Process Technol. 2014;214(12):2915–2925. doi:10.1016/j.jmatprotec.2014.06.005
- Yu H, Yang J, Yin J, et al. Comparison on mechanical anisotropies of selective laser melted Ti-6Al-4V alloy and 304 stainless steel. Mater Sci Eng A. 2017;695:92–100. doi:10.1016/j.msea.2017.04.031
- Leicht A, Fischer M, Klement U, et al. Increasing the productivity of laser powder Bed fusion for stainless steel 316L through increased layer thickness. J Mater Eng Perform. 2021;30(1):575–584. doi:10.1007/s11665-020-05334-3
- Pham M-S, Dovgyy B, Hooper PA, et al. The role of side-branching in microstructure development in laser powder-bed fusion. Nat Commun. 2020;11(1):749. doi:10.1038/s41467-020-14453-3