
 ?Mathematical formulae have been encoded as MathML and are displayed in this HTML version using MathJax in order to improve their display. Uncheck the box to turn MathJax off. This feature requires Javascript. Click on a formula to zoom.
ABSTRACT
NiTi shape memory alloys (SMAs) prepared by the laser powder bed fusion (LPBF) technology have demonstrated promise in aerospace and medical applications. Nevertheless, ensuring repeatability and customised design in printed parts remains challenging. This paper addressed this challenge by introducing a machine learning model that effectively predicted the performance of NiTi SMAs across diverse LPBF processing and equipment conditions. Trained on a dataset of 195 entries from 23 publications, the model accurately predicted critical metrics, including density, ultimate tensile strength, elongation, and thermal hysteresis. Validation using data from eight experimental groups confirmed its reliability and generalisation capability. Multi-objective optimisation identified processes yielding synergistic improvements, achieving a tensile strength of 7838 MPa, an elongation of 13.7
0.8% and a low hysteresis of 15.1 K. This study also discussed strategic applications of the model for LPBF process optimisation and proposed a method for constructing tailored LPBF process maps for specific NiTi alloy performance attributes.
1. Introduction
Nickel-titanium (NiTi) shape memory alloys (SMAs) own unique functional properties (i.e. shape memory effect and superelasticity behaviours), low stiffness, excellent biocompatibility, damping characteristics and corrosion behaviours, and are thus widely used in the fields of aerospace and medical devices [Citation1]. However, it is a hard task to fabricate NiTi parts by using traditional techniques (like casting and powder metallurgy) because of difficulties in the processing and machining caused by the high ductility and strong work hardening of alloys. Recently, the laser powder bed fusion (LPBF) technology, as the primary metal-based additive manufacturing (AM) technology, has rapidly developed due to the advantages of manufacturing parts with complex configurations over conventional techniques [Citation2]. The LPBF technology also provides a metallurgical approach to in-situ modulation of alloy microstructure and thus performance tuning. Hence, with the emerging concept of four-dimensional (4D) printing [Citation3], increasing interest has been gained in the material-structure functionality integrated manufacturing of NiTi-based complex parts by using the LPBF [Citation4,Citation5].
Over the past decade, enormous studies have been conducted on fabricating high-quality NiTi SMAs by powder bed additive manufacturing [Citation6,Citation7]. The LPBFed NiTi parts have been widely used in aerospace and medical devices [Citation8]. Despite this, the repeatability and customised functional behaviours of AM fabricated parts have frequently been identified as the most noticeable challenge for NiTi alloys. That is because many factors may strongly affect the composition and microstructure of as-fabricated NiTi alloys, including the quality of powders [Citation9], the effectiveness of the laser source [Citation2], the impurity of the building chamber, and the processing parameters [Citation10]. Generally, rational control of the powder quality, the processing parameters, including laser powder (P/W), scanning speed (v/mm/s), hatch space (h/ m), and laser thickness (t/μm) sustain as the most important issues to be addressed [Citation11]. In this regard, many researchers have investigated the dependence of printability, phase transformation temperature, mechanical properties, and functional behaviours of LPBFed NiTi on different process parameters [Citation10,Citation12]. Specially, Wang et al. [Citation10] prepared 22 samples to investigate the effect of process parameters on phase transformation behaviours and tensile properties. Such a trial-and-error approach typically necessitates a significant number of iterations due to the intricate relationship between the parameters and the resultant quality of the fabricated parts. Rational methods for LPBF process optimisation have also been developed, including the empirical laser energy density estimation [Citation13], melt pool structure analyses [Citation14], and high-fidelity computational modelling [Citation15]. These strategies primarily focus on adjusting individual processing parameters or their linear combinations, limiting predictive capacity to as-print sample density. However, for LPBFed NiTi SMAs, the prediction of performance characteristics such as density, phase transformation temperature, and mechanical properties solely through linear relationships of process parameters proves inadequate. Achieving accurate predictions necessitates a comprehensive approach encompassing factors such as powder composition, process parameters, equipment parameters, and others. Nevertheless, optimising performance within such intricate parameter space poses considerable challenges.
Nowadays, the machine learning (ML) technique has emerged as a novel data-driven approach to evaluate the ‘composition-process-structure-property’ relationship and help fabricate high-quality parts in the metal LPBF process [Citation16,Citation17]. Unlike the traditional design of experiment schemes that are time-consuming and expensive, ML models offer an efficient means to optimise highly nonlinear responses based on historical data or prior experience. In LPBFed NiTi research, numerous experimental observations [Citation5,Citation10,Citation18–20] facilitate the generation of extensive datasets for ML analysis. By leveraging statistical methods, ML algorithms excel at navigating the intricate high-dimensional parameter spaces inherent in NiTi LPBF processes, encompassing factors such as powder composition, process parameters, and equipment specifications. Various types of algorithms, including kernel-based, tree-based, and network-based models [Citation21], possess the capability to handle high-dimensional parameters and can be considered for constructing the ML model. Moreover, techniques such as data imputation [Citation22], feature engineering, and hyperparameter optimisation contribute to enhancing the predictive performance and generalisation capability of the model. The algorithms effectively discern data patterns and establish non-parametric quantitative relationships between high-dimensional inputs and multiple targets. Subsequently, by employing inference and multi-objective optimisation techniques [Citation23], the optimal process parameters conducive to the outstanding comprehensive performance of NiTi alloys under specified experimental conditions can be pinpointed [Citation24]. Furthermore, conducting uncertainty analysis of the predicted performance of LPBFed alloys holds substantial importance in enhancing printing performance repeatability [Citation25].
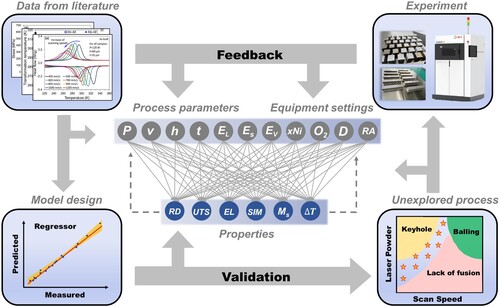
As a result, this paper introduced a novel approach to accelerate the optimisation of the LPBF process for fabricating NiTi SMAs with enhanced and controllable properties, by leveraging machine learning and multi-objective optimisation techniques. The workflow of this study is depicted in . Initially, 195 experimental data points were compiled from existing literature and subjected to rigorous data cleaning to construct a dataset featuring multiple influencing factors and target performance metrics. Subsequently, a multi-output predictive model was developed through feature importance analysis and model training. Multiple rounds of experimental validations were then conducted to showcase the generalisation capability of the ML model and refine its performance under specific experimental conditions. Utilising a multi-objective optimisation approach, the study identified and experimentally validated the process parameters yielding the most favourable comprehensive target properties. Finally, this paper discussed the reliability of the model and optimisation approach across various experimental conditions and presented a process map to streamline process optimisation for achieving target performance.
Figure 1. Workflow of this study. Initially, multi-source data obtained from the literature are compiled and utilised to train a multi-output machine learning model. Subsequently, the generalisation capability of the model is validated by selecting unexplored processes from the training set. Finally, the experimental results are incorporated back into the original model to enhance its accuracy.
2. Methodology
2.1. Machine learning
Dataset construction: This study reviewed 23 publications on LPBF-fabricated NiTi SMAs [Citation4–7,Citation10,Citation12,Citation13,Citation18–20,Citation26–38] and compiled data from 226 samples, focusing on six significant properties as targets and three types of influencing factors as descriptors: (i) powder composition; (ii) process parameters and (iii) equipment settings. The relevant properties and descriptors and their abbreviations are listed in . Experimental conditions and observations were directly sourced from tables in the literature or extracted from figures. Data cleaning procedures were conducted, including error correction, removal of duplicate data, feature identification, and data supplementation. Both descriptors and targets were generally standardised using Equation (1) to minimise bias in the modelling process.
(1)
(1) where X is the feature value, i is the index of the variable, and j is the index of the specimen at the ith variable.
Table 1. Data features, corresponding abbreviations and targets of concern.
Feature engineering: The linear combinations of individual process parameters, with energy density among them, were also included in the model features for further screening, and capturing the patterns in training data more effectively. The Pearson correlation coefficient was utilised to identify features exhibiting significant correlations. Subsequently, feature importance was ranked by permutation importance.
Model selection: Various machine learning models were employed to estimate the six targets using a non-convex input/output fitness function, including random forest regression (rf), gradient boosting regression (gbr), catboost regression (cat), gaussian process regression (gpr), support vector regression with a linear kernel (svr_lin), a polynomial kernel (svr_poly) and a radial basis function kernel (svr_rbf), multilayer perceptron model (mlp). Hyperparameter optimisation of the models was primarily conducted by using the GridsearchCV algorithm. The bootstrap resampling and cross-validation (CV) were used to assess the generalisation capability of the model. Root mean square error (RMSE) and coefficient of determination (R2), were selected as reference measures to evaluate the accuracy of the model predictions. The RMSE captures the difference between the model predicted values (ypre) and the experimental results (ypre), given by RMSE . The R2 is an alternative measure and is given by,
, where
is the mean value of yi.
2.2. Experimental procedure
In this work, the NiTi powders were prepared by electrode induction-melting gas atomisation technique (AMC Powders Co. Ltd., Beijing). As depicted in (a) and (d), the powders were spherical or near-spherical with a few irregularly shaped satellite particles, and the corresponding D50 was 35 m, as measured by Malvern Mastersizer 3000 analyzer. The content of Ni in the powders was 50.63 at.%, as determined by the titration method. The powders exhibited a single B2 austenite structure with multiple phase transition peaks during the cooling/heating process ((e) and (f)). The powders were processed by EOS M290 LPBF system equipped with a 100
m laser beam in a high-purity Ar atmosphere. The oxygen content in the building chamber was strictly limited to under 500 ppm, to the maximum extent achievable by the equipment. The scanning path of the laser alternated 67° between adjacent layers ((b)). Regarding the process parameters for experimental validation, we followed the approach of Xue et al. [Citation5], as shown in the right corner of . Within the initially screened printable region, we designed eight process parameters with significant variations to assess the model’s effectiveness across a wide range of process parameter settings. All the detailed parameters can be found in the Supplementary File. Dense cuboid parts with dimensions of 70
12
10 mm3 were then directly fabricated with the selected process parameters.
Figure 2. (a) Morphology and (d) size distribution of the NiTi SMA pre-alloyed powders; (b) Illustration of the present strip-type scanning strategy. The width of the stripe is 5 mm, and a bidirectional scanning manner is employed within the stripe. The scanning direction is rotated for 67° between layers; (c) LPBFed SMA parts of cuboid for experimental validation; (e) DSC curves and (f) XRD patterns of the NiTi SMA powders test at room temperature (25°C).
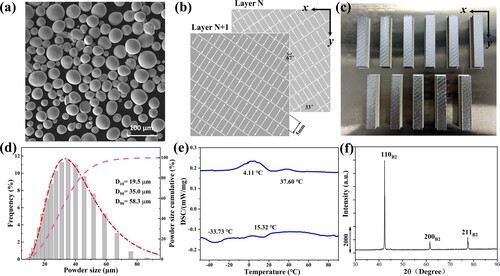
The relative density of LPBF-fabricated samples was measured by a ME155DU density determination kit using a theoretical maximum density of 6.46 g/cm3. The phase transformation behaviour was characterised by differential scanning calorimetry (DSC) in a NETZSCH DSC 214 calorimeter with a cooling/heating rate of 10 K/min between −60 and 100 °C. DSC samples weighing 10–20 mg were obtained by cutting small pieces from the centre of the LPBF-fabricated samples. Dog-bone-shaped NiTi SMA samples (with a gauge section 3 mm in width, 2 mm in thickness, and 15 mm in length) were cut parallel to the x-y plane out of the cuboid samples with different process parameters for tensile testing (INSTRON 3362 equipped with an electronic extensometer). All the tensile tests were conducted with a constant strain rate of 5.0 × 10⁻⁴ s−1 at room temperature (25°C).
3. Results and discussion
3.1. ML model training
Machine learning proves highly effective in LPBF process optimisation by handling data from multiple sources and establishing non-linear quantitative relationships between features and targets. In constructing models for LPBFed NiTi SMAs, effective predictions of formability, mechanical properties, and functional properties require consideration of three types of features. Firstly, the Ni content in pre-alloyed powders was chosen as a potential feature, owing to the high composition dependence of two targets Ms and T [Citation5]. Secondly, the process parameters such as P, v, h, t, their linear combinations Ev, Es, and El, along with the scanning strategy, simplified as rotation angle, were also considered, as they directly impact the quality of the as-built parts [Citation39,Citation40]. Thirdly, empirical studies underscored the notable influence of equipment settings, such as the spot diameter of the laser source (D) [Citation41] and oxygen content in the building chamber (O2) [Citation10], on the quality of as-built NiTi alloy. Thus, features were extended to include equipment parameters, thereby ensuring model generalisation across different equipment. Ultimately, six significant properties were chosen as targets, with eleven potential influencing factors identified as features, for constructing a machine learning model. The full names of concerning targets and features along with their abbreviations are listed in . Following data preprocessing (see Supplementary File), the final dataset comprised 195 completely labelled data entries.
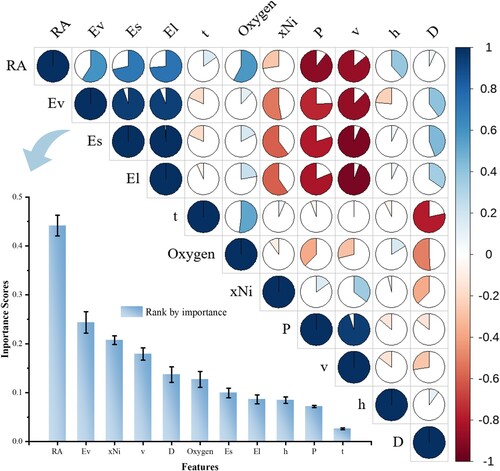
Original features built the predictive model’s physical foundation, yet the redundant ones often inflate dimensionality, complicating interpretation. Thus, a hybrid method, combining correlation analysis and permutation feature importance, filtered redundant features. As depicted in , the Pearson correlation map initially identified features with stronger correlations. Features Ev, Es, and El show a robust positive correlation, as they are derived from the ratios of v, h, and t for P. This also elucidates the negative correlation among the feature v and Ev, Es, and El. The relatively weak negative correlation between feature P and Es, Ev stems from the experimental process, where elevated laser power requires higher scanning speed and hatch spacing to prevent localised overheating of the melt pool, potentially reducing energy density. Moreover, the statistical significance of the negative correlation between P and v with RA is minor, as the training data for RA comprises only two discrete interlayer angles. Subsequently, the feature importance was ranked by permutation importance with random forest regressor. Unlike typical ML models, our model selected six significant properties as labels. Thus, in feature importance analysis and subsequent model selection, the mean error in predicting the six target outcomes served as the evaluation loss function. As three out of the six targets (RD, UTS, EL) directly reflect formability, features controlling printability such as scanning strategy and volume energy density (Ev), exhibited the highest importance. Features associated with phase transformation characteristics (Ms and T), specifically xNi, closely followed in importance. Besides, features like oxygen content, significantly impacting strength and ductility, also scored high. Consequently, combining correlation analysis with feature importance assessment, the redundant features Es and El were filtered out.
Figure 3. Feature filtering by correlation and permutation importance. All the original features are listed in the correlation map. Blue represents positive correlation while red negative correlation. A larger fan-shaped with deeper colour indicates a higher level of correlation. The importance of features shown at the bottom is ranked by permutation importance with random forest regressor.
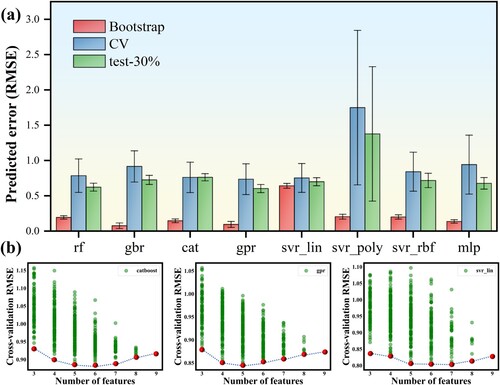
After feature engineering, eight models encompassing kernel-based, tree-based, and network-based categories were developed. Bootstrap resampling assessed model performance and robustness on training data, while cross-validation with testing set scores evaluated generalisation capability. The original dataset was divided into a 70% training set (137 samples) and a 30% test set (58 samples). Bootstrap sampling was performed on the training set by randomly selecting n observations with replacement, and the models were trained on this bootstrap set by repeating 100 times to estimate the RMSE. Subsequently, the models underwent 10-fold cross-validation, repeated 100 times with varying training/testing splits, to calculate the mean and standard deviation of RMSE. (a) displays the predicted errors of eight ML algorithms, with rf, gbr, cat, and gpr performing better on the bootstrap sample, and gpr, svr_lin showing lower prediction error with cross-validation and the testing set. The relatively large standard deviations of RMSE in cross-validation for some models primarily stem from difficulties in achieving a random distribution of cross-validation data with 10-fold sampling, leading to RMSE bias. Hence, three models, cat, gpr, and svr_lin, representing typical algorithms, were selected as candidates. To assess model performance on different feature subsets while minimising the complexity, we evaluated all possible combinations of the nine independent features to identify the subset yielding the lowest error for the three ML models. Five-fold cross-validation was employed for evaluation, with (b) displaying the mean RMSE scores. Initially, model errors decreased with increasing features, indicating an improvement in prediction accuracy. However, additional features led to significant error increases, suggesting overfitting. A comparison among feature subsets in the three models revealed the same combination of features, i.e. xNi, Ev, RA, v, D, that yielded the lowest error. To construct subsequent process maps, the laser power (P) and oxygen content (O2) were also added to the final model, which had a minimal impact on predictive accuracy. Comparing the prediction errors of the three models, both the gpr and svr_lin models exhibited lower mean RMSE values, with the svr_lin model consistently maintaining the lowest RMSE across combinations comprising 5–7 features, indicating potential overfitting. Conversely, the gpr model achieved the lowest RMSE only for combinations with 5 features, and notably, the gpr model inherently provides estimates of prediction uncertainty. Thus, a predictive model based on Gauss process regression utilising seven significant features was established.
Figure 4. Model evaluation and dimensionality reduction of the features. (a) The performance of eight ML algorithms was compared using bootstrap resampling, 10-fold cross-validation, and score on the testing set. (b) The predicted error (RMSE of cross-validation) of three selected models (cat, gpr, svr_lin) contains a subset of the nine features in our dataset. The red frontier tracks the best model for a given number of features.
3.2. Predictive model and experimental validation
After data preprocessing, feature engineering and model selection, the predictive ML model for the LPBFed NiTi process was ultimately constructed. The present model is an extension of Gaussian Process Regression to multiple outputs, incorporating seven features related to powder feedstock, process parameters, and equipment settings. It was trained on a dataset comprising 195 experiments from various sources. The kernel function and optimised hyperparameters used to construct the model are listed in Table S2. The performance of the model on six different targets can be directly evaluated by comparing the experimental results (measured) and the predicted targets for the data in the training set. In , the predicted properties of the entire dataset were plotted as a function of measured properties. Generally, the scatter points are distributed closely to the diagonal line indicating a good ability to predict the properties we are interested in. To analyse in detail, in (a), although the overall predictive results align well with the measured outcomes, there is still a tendency for the predicted values to be higher in the low-density range. This is typically associated with measurement errors in the Archimedes displacement method used in experiments [Citation42]. The model displayed a better performance on UTS and EL, with R2 scores of 0.95. Moreover, the model also demonstrates strong predictive capabilities for properties related to martensitic phase transformation, including SIM-SMR, Ms and T. In particular, the model exhibits an impressive prediction accuracy of 0.96 for Ms, and the predictive results cover a wide temperature range of nearly 100 K. For the prediction of thermal hysteresis in (f), the bias mainly comes from data collection, as most of the phase transition-related data needed to be extracted from DSC curves. Given that the training dataset encompasses experimental data from diverse machine types (as shown in Table S1) and features pertinent machine settings like D and O2, the prediction results of the model across different targets inherently showcased its capability across varied machine settings.
Figure 5. Performance of the predictive model with multiple objectives on the training set and experimental validation set. (a) Model prediction and scores on relative density (RD). (b) ultimate tensile strength (UTS). (c) elongation (EL). (d) stress-induced martensitic transformation or stress-induced martensite reorientation (SIM-SMR). (e) martensitic transformation temperature (Ms) and (f) thermal hysteresis (ΔT).
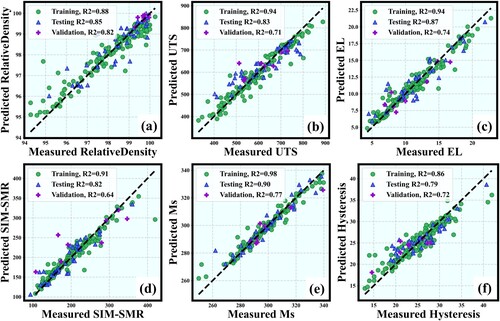
shows the experimental validation results of the DSC and tensile test. The eight selected process parameters lead to significant variations in both thermal and mechanical performance. From a process feature perspective, alloys fabricated with low power and low scanning speed exhibited a wider phase transition range. What’s more, under room temperature axial loading, the stress-induced martensitic reorientation occurred, leading to higher elongation. Correspondingly, processes with higher power and scanning speeds can lower the martensitic phase transformation temperature, narrow the transition interval, and reduce thermal hysteresis (as depicted in ). Such type of process also caused stress-induced martensitic phase transformation and resulted in a remarkable increase in ultimate tensile strength but at the cost of some loss in ductility. The validation results were plotted in with purple signs. The model demonstrated excellent predictive capabilities across all six output objectives in the validation set. The coefficient of determination R2 values for all targets, except SIM-SMR, exceed 0.7. The experimental validation conducted over a wide range of process parameters confirms the effectiveness of our constructed multi-output Gaussian regression model in predicting the performance of LPBFed NiTi alloys. Meanwhile, based on the experimental validation results, slight adjustments were made to the model parameters to achieve more accurate predictions on the existing equipment.
Figure 6. Experimental results of DSC curves and stress-strain curves under axial tensile test. (a) DSC curves of eight as-built NiTi samples with different process parameters. (b) Stress-strain curves of the same NiTi samples under axial tensile loading at room temperature. The inset illustrates a schematic representation of obtaining SIM or SMR using the tangent method.
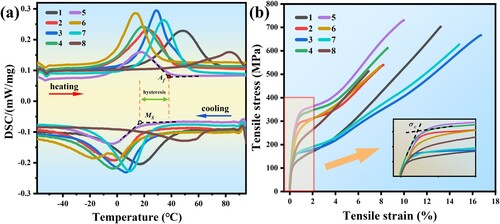
Table 2. Process parameters for experimental validation samples and optimised samples along with their corresponding as-printed properties.
3.3. Optimised LPBF processes for multiple desired properties
In practice, achieving multiple favourable performance attributes within a given process parameters range is highly desirable. Yet, optimising several properties simultaneously using limited data-driven machine learning in complex, black-box scenarios pose significant challenges. Such challenge can be effectively framed as a multi-objective optimisation task aimed at enhancing the desired performance [Citation23,Citation43]. For optimising multiple properties [Citation44], methods that screen out processes outside the regime of interest based on single objective predictions, probabilistic maximisation of target fulfilment likelihood as well as multi-objective optimisation methods that successively improve the Pareto front, are typically used. Here, a genetic algorithm was employed to search for the Pareto front and associated uncertainty within the predictive result space of three targets, i.e. UTS, EL, and ΔT. The algorithm initially assesses the predictive performance of each solution across the objectives. Subsequently, it selects superior parent solutions based on their overall predictive accuracy. By applying crossover and mutation, it merges the features and hyperparameters of the selected parents, generating new candidate models that progressively achieve optimal balances among the three objectives.
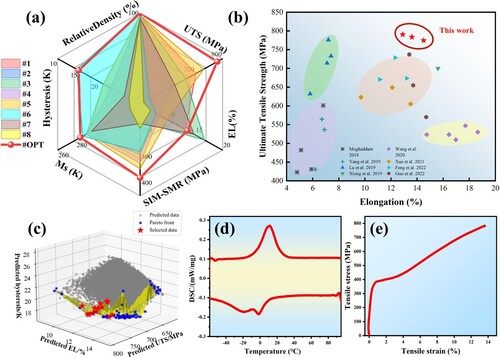
As mentioned above, the constructed machine learning model incorporates six target properties, including RD, UTS, EL, SIM-SMR, Ms, and ΔT, about formability, mechanical properties, and functional properties, respectively. Due to the extensive computational demands associated with optimising all six objectives, achieving results that accurately reflect practical requirements becomes challenging. Therefore, we focus on UTS and EL to represent mechanical properties, along with ΔT, which influences cycle life and response time in the service process, as our optimisation goals. Our aim is to identify a 3D-printed NiTi alloy with superior strength, toughness, and minimal thermal hysteresis within the prediction space. Initially, the ML model predicted the three objectives by varying process parameters such as P, v, h, Ra (varying h to obtain feature Ev), while maintaining the fixed composition and equipment parameters. Subsequently, the best performance combination within the feasible region was sought, while ensuring the minimal compromise to other objectives. (c) illustrates a broad spectrum of predictive results with grey dots, while the Pareto front is represented by blue squares and a yellow surface. From this front, red star points were further selected, adhering to constraints of UTS > 750 MPa, EL > 12% and ΔT < 22 K. (d) and (e) depict the experimental verification results of one of the recommended points in (c). The sample fabricated with the optimised parameters exhibited a thermal hysteresis of 15.1 K, ultimate tensile strength of 7838 MPa and elongation of 13.7
0.8%, demonstrating excellent overall performance. Comparison in (a) showcases the significant improvement in ultimate tensile strength and minimal thermal hysteresis of the alloy with optimised process parameters compared to samples 1-8. Besides, the OPT sample demonstrated the highest critical stress for inducing martensitic phase transformation due to its lower martensitic transformation temperature. (b) highlights that the optimised sample achieved a synergistic improvement in strength and toughness, compared to previously reported works [Citation4,Citation5,Citation10,Citation12,Citation19,Citation20,Citation33,Citation36]. Notably, our optimisation strategy, with only two sets of experiments, yielded the desired excellent overall performance, enhancing the process optimisation efficiency compared to traditional orthogonal experiments. It is important to acknowledge limitations in equipment precision, such as oxygen content control (500 ppm), which prevented achieving the high elongation reported by Wang et al. [Citation10]. Equipment variations, including challenges in adjusting laser spot diameters or imprecise control over oxygen content, are inevitable. Nonetheless, our model offers a rapid method for optimising processes and anticipating multi-objective performance across different equipment setups.
Figure 7. Multi-objective optimisation for desired properties in LPBFed NiTi alloys and the enhanced performance in experimental results. (a) Performance comparison between multi-objective optimisation sample and samples #1–8. Lines connecting the centre to the corners of a hexagon represent six objective performances. Samples #1–8 performances depicted using polygons. Optimized results (OPT) are indicated by red circles. (b) EL vs UTS of optimised properties in this work, compared with those of LPBFed NiTi SMAs in other literature. (c) The predicted results for three targets including UTS, EL and thermal hysteresis, the Pareto frontier derived from these results, and the selected data points. (d-e) DSC curve and stress-strain curve of the sample fabricated using optimised process parameters.
3.4. Multi-objective decision-making based on the ML model
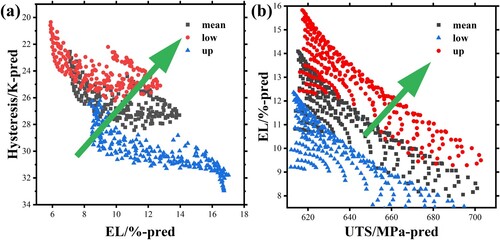
After thorough experimental validation and optimisation result analysis, we will further discuss the effectiveness of machine learning-assisted NiTi alloy process multi-objective collaborative design within a broader scope. Generally speaking, both constraining and synergistic relationships exist in the properties of NiTi alloy. For instance, the tensile strength and elongation of LPBFed NiTi alloys generally exhibit a constraining relationship similar to other alloy systems ((b)). Moreover, the requirements for low thermal hysteresis and high elongation also create constraints between them ((a)). Our design objectives for each pair of performance metrics are along the green lines, which are challenging to achieve through single-objective optimisation. Therefore, multi-objective optimisation is crucial in the optimisation of additive manufacturing NiTi alloy processes.
Figure 8. Pairwise interdependencies among multiple objective performances. (a) The predicted elongation values against thermal hysteresis. (b) The predicted UTS against EL. The red and blue markers represent the upper and lower bounds of prediction uncertainty, respectively.
In the previous section, the predicted results solely under variations in process parameters and the methodology for optimising three of the objectives were discussed, leading to a synergistic enhancement of performance under our limited experimental conditions. Building on this foundation, we further released all feature parameters of the model to attempt to predict alloy performance under different powder compositions, process parameters, and equipment settings. This fact can further illustrate the model’s predictive and optimisation capabilities under varying and complex experimental conditions. With all the seven feature dimensions unrestricted, it resulted in a substantial volume of predictive data. Hence, the multi-axis parallel coordinate plots were employed to visualise the high-dimensional data. As shown in (a), the segmentation of different features was conducted by setting grid values within a certain range based on the requirements of the actual experimental setup. For example, five grid points were established between 50.0 to 51.0 at.% to accommodate the measured values for powder composition. In the case of scan spacing, which significantly impacts the as-print performance, intervals of 100 mm/s were set within the range of 100 to 1000 mm/s. Layer-to-layer rotation angles were selected at 45°, 67° and 90°, representing different scanning strategies. As for oxygen content, a variation range of 100 to 600 ppm was chosen, considering equipment limitations and cost control during actual fabrication.
Figure 9. Predicted results of multiple objectives. (a) Parallel coordinate plot of the input features and output targets. (b) The relationship between prediction results and their uncertainties as a function of a single feature.
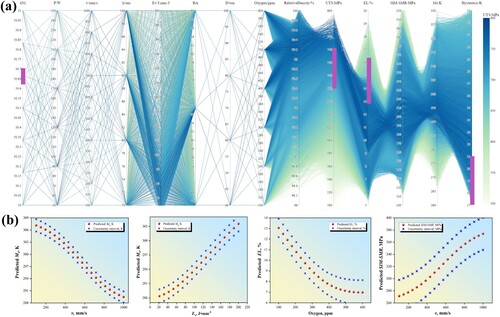
(a) displays the settings of feature parameters and the predicted results of multiple objectives, with UTS values represented by colour bars. As powder composition, process parameters, and equipment parameters vary, the model provides predictions of corresponding target performance along with their uncertainties. Parallel coordinate plots clearly illustrate the variations in predicted targets and the synergistic or constraining relationships among multiple predicted objectives. Besides, this plot demonstrates the powerful capability of our model for designing and optimising multi-objective performance. For example, to design an LPBFed NiTi shape memory alloy with low hysteresis, high strength, and high ductility, one can fix the performance ranges of three objectives (UTS, EL, Hysteresis), input powder composition, and obtain the recommended equipment parameters and process parameters to facilitate the one-time formation of an alloy with the desired performance. Detailed results can be found in Figure S2 in the Supplementary Files. In addition, when other variables in the prediction results were fixed, the relationship between predicted performance and feature parameters as well as their uncertainties with parameter variations can be observed, as shown in (b). As the scanning speed increases, the Ms decreases, whereas with an increase in energy density, the Ms increases, which is consistent with the findings reported by Wang et al. [Citation10]. The process parameters can alter the transformation temperature by affecting the evaporation of Ni elements. On the other hand, the elongation significantly decreases with an increase in the oxygen content during the forming process, similar to the trend reported in the literature [Citation10,Citation19]. Elevated indoor oxygen content during forming generates numerous TiOx oxide precipitates at grain boundaries, severely compromising the alloy ductility. Moreover, the SIM-SMR value increases with the scanning rate, which can be explained by changes in Ms and the Clausius–Clapeyron relationship [Citation45] which relates the uniaxial stress to phase transformation temperature. The predicted trends align with those reported in the literature [Citation10] and are consistent with theoretical explanations [Citation4], indicating the good interpretability of the present model.
3.5. Processing maps for LPBFed NiTi alloys
Every 3D printing engineer aspires to achieve high-quality parts with desired properties on the first attempt. The models and multi-objective optimisation methods discussed above lay a solid foundation for realising such aspirations. Through meticulous consideration of influencing factors and multi-objective optimisation, a synergistic enhancement has been achieved in the strength and toughness of LPBFed NiTi alloys while maintaining low hysteresis. However, due to the complexity of metal additive manufacturing, quantitatively analysing the impact of process parameters on multiple NiTi alloy properties poses challenges. While some researchers have used orthogonal experiments to construct process maps for NiTi alloy additive manufacturing [Citation46], they could only qualitatively analyse parameter influences within limited ranges due to experimental constraints. Therefore, we employed our robust ML model, considering multiple performance objectives, to classify processes and analyse process parameter characteristics for specific performance enhancements in NiTi.
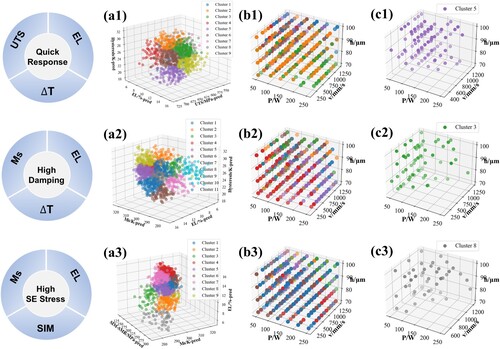
Here, three essential performance criteria commonly required in applications were selected as optimisation targets, each associated with three properties of as-printed NiTi SMAs. For instance, the fabrication of NiTi alloys with a quick response in brake systems necessitated low thermal hysteresis and standard mechanical properties. Thus, predicted results were categorised based on three objectives, UTS, EL and T by using the K-nearest neighbour (KNN) algorithm. As depicted in (a1-b1), the prediction of these three criteria yielded nine clusters based on data patterns, each corresponding to distinct process parameters plotted with P, v, and h. Cluster 5, indicating lower
T, was characterised by moderate laser power and scanning speed settings. Similarly, achieving high damping performance required significant thermal hysteresis, relatively higher elongation, and lower transformation temperatures. Clustering predicted properties also revealed characteristic process parameter combinations. For applications requiring high superelastic stress, like NiTi fasteners, optimal process parameters involved intermediate laser power, high scanning speed, and increased hatch spacing, as depicted in (a3-c3). This approach facilitated the identification of process parameter characteristics aligned with various target properties, enabling researchers to achieve one-time molding with optimal performance. On this basis, the process map for preparing alloys with specific properties can be developed efficiently.
Figure 10. Clustering results for different applications and target performance. The three circles on the left are the typical application requirements and corresponding properties of NiTi alloys. (a1-a3) Clustering results for various objectives. (b1-b3) Process parameter range corresponding to different clusters. (c1-c3) Clusters of process parameters with potentially superior performance that meet target requirements.
4. Conclusions
To summarise, our study has demonstrated the efficacy of integrating machine learning with multi-objective methods to expedite the optimisation of the LPBF process for fabricating NiTi SMAs with desired properties. Based on the intrinsic pattern of the dataset, seven influential factors encompassing powder feedstock, process parameters, and equipment settings were identified as key features to build the reliable predictive model. Leveraging the Gaussian process regression and the selected features, our multi-output machine learning model exhibited remarkable predictive accuracy for the six target performance metrics and their associated uncertainties. Validation against eight experimental sets reaffirmed the predictive capability of the model and its ability to generalise across diverse conditions. Employing a multi-objective optimisation strategy, the process parameters yielding optimal performance were pinpointed from a vast array of predicted outcomes. The sample produced under these optimised conditions exhibited a synergistic enhancement in both strength and ductility, boasting a tensile strength of 7838 MPa and an elongation of 13.7
0.8%, while maintaining a low thermal hysteresis of 15.1 K. Moreover, the robust generaliation capability of our model facilitated the optimisation of LPBF processes for NiTi SMAs across varied experimental conditions. Ultimately, clustering analysis of the prediction results efficiently aided in identifying process characteristics aligned with various desired performances of LPBFed NiTi alloys, which paved the way for the development of a process-performance map for LPBFed NiTi SMAs.
Supplemental Material
Download MS Word (1 MB)Acknowledgments
The financial support from the Natural Science Foundation of Hunan Province for Distinguished Young Scholars (Grant No. 2021JJ10062), the National Natural Science Foundation of China (Grant No. 52101028), the China Postdoctoral Science Foundation (Grant No. 2021M703628), and the project supported by State Key Laboratory of Powder Metallurgy, Central South University, Changsha, China is acknowledged.
Disclosure statement
No potential conflict of interest was reported by the author(s).
Data availability statement
The data generated and/or analysed during the current study are available from the corresponding author upon reasonable request.
Additional information
Funding
References
- Elahinia M, Shayesteh Moghaddam N, Taheri Andani M, et al. Fabrication of NiTi through additive manufacturing: a review. Prog Mater Sci. 2016;83:630–663. doi:10.1016/j.pmatsci.2016.08.001
- DebRoy T, Wei HL, Zuback JS, et al. Additive manufacturing of metallic components-process, structure and properties. Prog Mater Sci. 2018;92:112–224. doi:10.1016/j.pmatsci.2017.10.001
- Zhang Z, Demir KG, Gu GX. Developments in 4D-printing: a review on current smart materials, technologies, and applications. Int J Smart Nano Mater. 2019;10(3):205–224. doi:10.1080/19475411.2019.1591541
- Guo W, Feng B, Yang Y, et al. Effect of laser scanning speed on the microstructure, phase transformation and mechanical property of NiTi alloys fabricated by LPBF. Mater Des. 2022;215:110460. doi:10.1016/j.matdes.2022.110460
- Xue L, Atli KC, Picak S, et al. Controlling martensitic transformation characteristics in defect-free NiTi shape memory alloys fabricated using laser powder bed fusion and a process optimization framework. Acta Mater. 2021;215:117017. doi:10.1016/j.actamat.2021.117017
- Lu HZ, Ma HW, Cai WS, et al. Stable tensile recovery strain induced by a Ni4Ti3 nanoprecipitate in a Ni50.4Ti49.6 shape memory alloy fabricated via selective laser melting. Acta Mater. 2021;219:117261. doi:10.1016/j.actamat.2021.117261
- Zhang Q, Hao S, Liu Y, et al. The microstructure of a selective laser melting (SLM)-fabricated NiTi shape memory alloy with superior tensile property and shape memory recoverability. Appl Mater Today. 2020;19:100547. doi:10.1016/j.apmt.2019.100547
- Sharma N, Jangra KK, Raj T. Fabrication of NiTi alloy: a review. Proc Inst Mech Eng, Part L: J Mater: Des Appl. 2015;232(3):250–269. doi:10.1177/1464420715622494
- DebRoy T, Mukherjee T, Milewski JO, et al. Scientific, technological and economic issues in metal printing and their solutions. Nat Mater. 2019;18(10):1026–1032. doi:10.1038/s41563-019-0408-2
- Wang X, Yu J, Liu J, et al. Effect of process parameters on the phase transformation behavior and tensile properties of NiTi shape memory alloys fabricated by selective laser melting. Add Manuf. 2020;36:101545. doi:10.1016/j.addma.2020.101545
- Alagha AN, Hussain S, Zaki W. Additive manufacturing of shape memory alloys: A review with emphasis on powder bed systems. Mater Des. 2021;204:109654. doi:10.1016/j.matdes.2021.109654
- Feng B, Wang C, Zhang Q, et al. Effect of laser hatch spacing on the pore defects, phase transformation and properties of selective laser melting fabricated NiTi shape memory alloys. Mater Sci Eng A. 2022;840:142965. doi:10.1016/j.msea.2022.142965
- Shen FL, Li HQ, Guo H, et al. Effect of energy density on the superelastic property of Ni-rich NiTi alloy fabricated by laser powder bed fusion. Mater Sci Eng A. 2022;854:143874. doi:10.1016/j.msea.2022.143874
- Lu L-X, Jiang H, Bian Q, et al. Integrated modelling and simulation of NiTi alloy by powder bed fusion: single track study. Mater Des. 2023;227:111755. doi:10.1016/j.matdes.2023.111755
- Wen Y, Wu X, Huang A, et al. Laser powder bed fusion of immiscible steel and bronze: A compositional gradient approach for optimum constituent combination. Acta Mater. 2024;264:119572. doi:10.1016/j.actamat.2023.119572
- Gao J, Li Z, Liu J, et al. Current situation and prospect of computationally assisted design in high-performance additive manufactured aluminum alloys: a review. Acta Metall Sinica. 2023;59(1):87–105. doi:10.11900/0412.1961.2022.00430
- Sing SL, Kuo CN, Shih CT, et al. Perspectives of using machine learning in laser powder bed fusion for metal additive manufacturing. Virtual Phys Prototyp. 2021;16(3):372–386. doi:10.1080/17452759.2021.1944229
- Gu D, Ma C, Dai D, et al. Additively manufacturing-enabled hierarchical NiTi-based shape memory alloys with high strength and toughness. Virtual Phys Prototyp. 2021;16(sup1):19–38. doi:10.1080/17452759.2021.1892389
- Lu HZ, Yang C, Luo X, et al. Ultrahigh-performance TiNi shape memory alloy by 4D printing. Mater Sci Eng A. 2019;763:138166. doi:10.1016/j.msea.2019.138166
- Xiong Z, Li Z, Sun Z, et al. Selective laser melting of NiTi alloy with superior tensile property and shape memory effect. J Mater Sci Technol. 2019;35(10):2238–2242. doi:10.1016/j.jmst.2019.05.015
- Zhang J, Yin C, Xu Y, et al. Machine learning applications for quality improvement in laser powder bed fusion: a state-of-the-art review. Int J AI Mater Des. 2024;1(1). doi:10.36922/ijamd.2301
- Goh GD, Huang X, Huang S, et al. Data imputation strategies for process optimization of laser powder bed fusion of Ti6Al4V using machine learning. Mater Sci Addit Manuf. 2023;2(1). doi:10.36922/msam.50
- Zhang T, Zhong J, Zhang L. Pareto optimal driven automation framework for quantitative microstructure simulation towards spinodal decomposition. MRS Commun. 2023;13(5):877–884. doi:10.1557/s43579-023-00429-z
- Jordan MI, Mitchell TM. Machine learning: trends, perspectives, and prospects. Science. 2015;349(6245):255–260. doi:10.1126/science.aaa8415
- Hu Z, Mahadevan S. Uncertainty quantification and management in additive manufacturing: current status, needs, and opportunities. Int J Adv Manuf Technol. 2017;93(5):2855–2874. doi:10.1007/s00170-017-0703-5
- Gan J, Duan L, Li F, et al. Effect of laser energy density on the evolution of Ni4Ti3 precipitate and property of NiTi shape memory alloys prepared by selective laser melting. J Alloys Compd. 2021;869:159338. doi:10.1016/j.jallcom.2021.159338
- Guo W, Sun Z, Yang Y, et al. Study on the junction zone of NiTi shape memory alloy produced by selective laser melting via a stripe scanning strategy. Intermetallics. 2020;126:106947. doi:10.1016/j.intermet.2020.106947
- Lu HZ, Liu LH, Yang C, et al. Simultaneous enhancement of mechanical and shape memory properties by heat-treatment homogenization of Ti2Ni precipitates in TiNi shape memory alloy fabricated by selective laser melting. J Mater Sci Technol. 2022;101:205–216. doi:10.1016/j.jmst.2021.06.019
- Lu HZ, Ma HW, Cai WS, et al. Altered phase transformation behaviors and enhanced bending shape memory property of NiTi shape memory alloy via selective laser melting. J Mater Process Technol. 2022;303:117546. doi:10.1016/j.jmatprotec.2022.117546
- Mahmoudi M, Tapia G, Franco B, et al. On the printability and transformation behavior of nickel-titanium shape memory alloys fabricated using laser powder-bed fusion additive manufacturing. J Manuf Process. 2018;35:672–680. doi:10.1016/j.jmapro.2018.08.037
- Ren Q, Chen C, Lu Z, et al. Effect of a constant laser energy density on the evolution of microstructure and mechanical properties of NiTi shape memory alloy fabricated by laser powder bed fusion. Opt Laser Technol. 2022;152:108182. doi:10.1016/j.optlastec.2022.108182
- Saedi S, Shayesteh Moghaddam N, Amerinatanzi A, et al. On the effects of selective laser melting process parameters on microstructure and thermomechanical response of Ni-rich NiTi. Acta Mater. 2018;144:552–560. doi:10.1016/j.actamat.2017.10.072
- Shayesteh Moghaddam N, Saghaian SE, Amerinatanzi A, et al. Anisotropic tensile and actuation properties of NiTi fabricated with selective laser melting. Mater Sci Eng A. 2018;724:220–230. doi:10.1016/j.msea.2018.03.072
- Shi G, Li L, Yu Z, et al. The interaction effect of process parameters on the phase transformation behavior and tensile properties in additive manufacturing of Ni-rich NiTi alloy. J Manuf Process. 2022;77:539–550. doi:10.1016/j.jmapro.2022.03.027
- Yang Y, Zhan JB, Li B, et al. Laser beam energy dependence of martensitic transformation in SLM fabricated NiTi shape memory alloy. Materialia. 2019;6:100305. doi:10.1016/j.mtla.2019.100305
- Yang Y, Zhan JB, Sun ZZ, et al. Evolution of functional properties realized by increasing laser scanning speed for the selective laser melting fabricated NiTi alloy. J Alloys Compd. 2019;804:220–229. doi:10.1016/j.jallcom.2019.06.340
- Yu C, Hu Y, lu W, et al. Effect of hatch spacing on phase transformation behavior and mechanical properties of NiTi shape memory alloy fabricated by selective laser melting. Laser Optoelectron Prog. 2021;58(19):1–10. doi:10.3788/LOP202158.1914008
- Yu Z, Xu Z, Guo Y, et al. Study on properties of SLM-NiTi shape memory alloy under the same energy density. J Mater Res Technol. 2021;13:241–250. doi:10.1016/j.jmrt.2021.04.058
- Gong X, Groeneveld-Meijer W, Manogharan G. Additive manufacturing: application and validation of machine learning-based process-structure-property linkages in Ti-6Al-4V. Mater Sci Addit Manuf. 2023;2(3). doi:10.36922/msam.0999
- Koh HK, Moo JGS, Leong Sing S, et al. Use of fumed silica nanostructured additives in selective laser melting and fabrication of steel matrix nanocomposites. Materials. 2022;15(5):1869. doi:10.3390/ma15051869.
- Sow MC, De Terris T, Castelnau O, et al. Influence of beam diameter on Laser Powder Bed Fusion (L-PBF) process. Addit Manuf. 2020;36:101532. doi:10.1016/j.addma.2020.101532
- Agrawal AK, Rankouhi B, Thoma DJ. Predictive process mapping for laser powder bed fusion: A review of existing analytical solutions. Curr Opin Solid State Mater Sci. 2022;26(6):101024. doi:10.1016/j.cossms.2022.101024
- Dai R, Yang S, Zhang T, et al. High-throughput screening of optimal process parameters for PVD TiN coatings with best properties through a combination of 3-d quantitative phase-field simulation and hierarchical multi-objective optimization strategy. Front Mater. 2022;9:924294. doi:10.3389/fmats.2022.924294
- Liu P, Huang H, Wen C, et al. The γ/γ′ microstructure in CoNiAlCr-based superalloys using triple-objective optimization. NPJ Computat Mater. 2023;9(1):140. doi:10.1038/s41524-023-01090-9
- Otsuka K, Ren X. Physical metallurgy of Ti-Ni-based shape memory alloys. Prog Mater Sci. 2005;50(5):511–678. doi:10.1016/j.pmatsci.2004.10.001
- Xue L, Atli KC, Zhang C, et al. Laser powder bed fusion of defect-free NiTi shape memory alloy parts with superior tensile superelasticity. Acta Mater. 2022;229:117781. doi:10.1016/j.actamat.2022.117781