
 ?Mathematical formulae have been encoded as MathML and are displayed in this HTML version using MathJax in order to improve their display. Uncheck the box to turn MathJax off. This feature requires Javascript. Click on a formula to zoom.
ABSTRACT
Optimising the cell type and configuration is a key approach for overcoming stress concentration and irreversible deformation in lightweight lattice structures with high strength. In this work, the topology optimisation method was utilised to design force-direction-sensitive structures, including face-centre loaded (FCL), central-edge loaded (CEL), and hybrid-loaded (HL) structures, which were manufactured by laser powder bed fusion (LPBF) using Nitinol (NiTi) shape memory alloy. Results indicated that the HL lattice exhibited the highest initial peak force of 7.6 kN with higher specific compressive strength (41.74 MPa·cm3/g) and specific energy absorption (6.82 J/g), which was benefit from the layer-by-layer deformation mechanism. Furthermore, the HL lattice also exhibited the best damping properties and energy absorption capacity, while achieving a high shape recovery ratio of 85%. This work offers insights into a design strategy for functional structures with high strength and large deformation recovery capacity.
1. Introduction
The increasing demand for lightweight, integrated, and intelligent development of aerospace equipment has put forward higher requirements for the structural design of future smart aircraft. Lattice structure is a periodic arrangement of unit cells that form a porous and interconnected framework with excellent properties such as low density, high specific strength, energy absorption, heat dissipation, and damping performance [Citation1–3], which offers an opportunity to promote the lightweight development in future aircraft. Combining the lattice structures with Nitinol (NiTi) shape memory alloys (SMAs) that are based on a reversible phase transformation between martensite and austenite phases to achieve shape memory effect and superelasticity [Citation4–6], enables lattice structures to customise their structural state under external stimuli. However, the occurrence of stress concentration at the junctions of traditional lattice structures like body-centered cubic (BCC) and face-centered cubic (FCC) structures leads to inelastic buckling and irreversible deformation, which impedes the reversible phase transformation of martensite.
To overcome the above challenges, researchers have made numerous beneficial attempts in structural optimisation and spatial layout. One approach is detailed modifications to the structural configuration, involving optimising the strut size [Citation7], and introducing curved [Citation8] or tapered features [Citation9], which can improve the loading-bearing capacity. Notably, this geometry-modified method may result in increased mass, and the optimal parameters are difficult to determine. Another approach is the mathematical model-based design, also known as triple periodic minimum surface (TPMS) structures [Citation10, Citation11], which is made of smooth and continuous curved surfaces, eliminating stress concentrations [Citation12, Citation13]. Nevertheless, the sheet-based shape characteristics and parametric structural design limit the tunability and deformation ability. Furthermore, inspired by natural organisms, bionic structural design exhibits improved stress distribution and mechanical performances by altering the spatial configuration of materials. For example, the sandwich structure with cross-arranged configurations inspired by beetle elytra was demonstrated to exhibit excellent energy absorption capacity with a specific energy absorption of 9.16 J/g [Citation14]. However, the complex geometries and connections in bio-inspired structures can create excessive material utilisation and local stress concentration, especially at junctions or interfaces between structural units.
Considering the advantages and disadvantages of the above three design methods of lattice structures, there is an urgent need to develop a method to achieve ‘design with force’ of the structure, that is, redistributing the material layout according to the force distribution. Topology optimisation (TO) is a function-oriented active design method that iteratively explores optimal material distribution in a defined design domain and certain boundary conditions using mathematical modelling and optimisation algorithms [Citation15, Citation16], which has been proven to be a valuable tool for optimising material and structural layout [Citation17, Citation18]. Feng et al. established the functional relationship between equivalent mechanical properties and relative density of TPMS lattice cells, and then rationally distributed lattice cell types according to stress conditions based on the TO method, which was helpful for low stress concentration and high structural stiffness of components [Citation19]. Song et al. proposed a novel cuttlebone-like lattice structure based on the TO design, which exhibits excellent compression-resistant capacity with a specific compressive modulus of 5.4 GPa·kg−1 [Citation20]. Furthermore, laser powder bed fusion (LPBF) technology, as a promising metal additive manufacturing (AM) technology, is a layer-by-layer processing method that exhibits unique flexible forming freedom and high forming precision, enabling the fabrication of topology-optimised structures with intricate geometrical characteristics and great design freedom that are not possible via conventional manufacturing methods [Citation21–23]. However, current topology-optimised structures, exhibiting high stiffness, can have limitations in terms of the ability to recover their shape after deformation and focus on a specific load case that cannot adapt to the diversity and complexity of the actual force directions. Although some NiTi porous structures with shape memory effects have been developed, balancing weight, stiffness, and deformation recovery ability remains a major challenge in structural design for NiTi alloys. For example, it was reported that NiTi scaffolds structures exhibited a shape recovery rate of 79.7% [Citation24]. Zhang proposed a bionic porous structure with a high compressive strength of 147.6 MPa, but the deformation recovery capacity has not been investigated [Citation25]. Therefore, it was essential to develop lattice structures with high load-bearing and large deformation recovery capabilities.
In the present work, based on the concept of ‘design with force’, the TO method with constraints based on different loading modes was utilised to design force-direction-sensitive NiTi porous structures. The optimised lattice structures were fabricated by LPBF technology. The mechanical properties, damping capacity, and deformation recovery behaviours of NiTi lattice structures were investigated combined with analysis of surface morphologies, microstructures, geometrical characteristics, and temperature distribution.
2. Materials and methods
2.1. Topology-optimised design
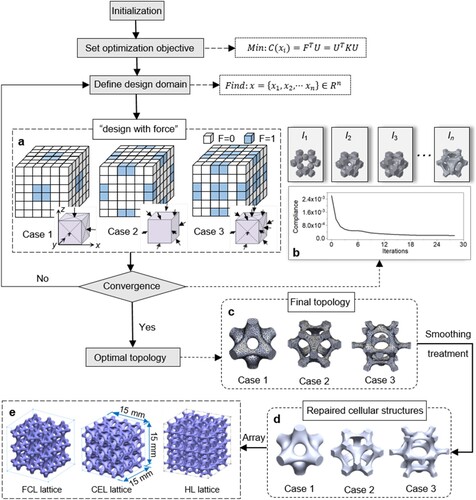
shows the topology optimisation process of various cellular structures, developed by the solid isotropic material with penalisation (SIMP) method. The basic principle of the unit cell topology is to define the design domain based on the actual loading modes, with preset functional demands as the optimisation objectives to obtain an optimal structure. In this work, the force distribution in a design domain was illustrated in (a), where a value of 1 signifies the grid element as the primary loading unit, and a value of 0 indicates the absence of force. To evaluate the mechanical properties at various loading directions and stress transformation paths, three cases with different loading conditions were employed, where each case involved loading in specific directions and regions. In Case 1, the load was applied perpendicular to each surface, and the loading domain was restricted to the central region of each surface. This case ensured that the structure could exhibit excellent mechanical performance under pure compression or tensile loads. In Case 2, the load was at an angle of 45° from each surface and applied at the centre of each edge, which is beneficial for a structure that was better suited to resist shear forces. When the structure was subjected to a comprehensive loading condition, the optimised structure in Case 3 was employed, where the loading condition was a combination of the previous two cases. Notably, all the cubes with various constrained conditions take the volume constraint with the value of 30% as the constraint condition, with the minimum compliance (C) as the objective function. The optimisation problem was formulated as [Citation26]:
(1)
(1)
(2)
(2)
(3)
(3) where xi denotes the design variable, that is the volume constraint; F, U, and K are the load matrix, displacement matrix, and stiffness matrix of the cellular structure, respectively; V0 represents the initial volume; V is the effective volume of the design region after optimisation. For all optimisation procedures, the penalty exponent was set to 3. Subsequently, continuous iterative optimisation was performed, and the optimisation procedure stopped automatically when the following convergence criteria that objective function delta criterion of 0.001 and element density delta criterion of 0.005 were fulfilled. As a result, the convergence solution was obtained (b), and three optimal topologies were developed (c). After that, to eliminate the sharp angels, geometric discontinuity, and irregular features that may be introduced during the TO process, a smoothing treatment was carried out based on the TO results (d). Finally, arranging the reconstructed TO cellular structures composed of 3 × 3 × 3 unit cells in X, Y, and Z directions to obtain different lattice structures with the dimensions of 15 mm × 15 mm × 15 mm, as the three CAD models illustrated in (e). These samples were denominated Central-edge loaded (CEL) lattice structure (strut size: 0.5 mm; pore size: 1.1 mm), face-centre loaded (FCL) lattice structure (strut size: 0.7 mm; pore size: 2.5 mm), and hybrid-loaded (HL) lattice structure (strut size: 0.5 mm; pore size: 2.1 mm).
Figure 1. Topology optimisation process: (a) Designed constraint conditions; (b) Iteration process; (c) Topology-optimised results; (d) Repaired cellular structures; (e) Arrayed lattice structures.
2.2 Effective elastic properties
The analysis of the effective elastic properties of unit cells enables a prediction of the mechanical properties of lattice structures. The lattice structures are the periodic arrangement. Hence, based on the homogenisation method, a representative volume element (RVE) model that was subjected to periodic boundary conditions (PBCs) was established that can be defined as follows [Citation26, Citation27]:
(4)
(4) where
denote the displacement filed of the positive and negative directions along the kth axis,
represents a given strain, and
is a constant for any given cubic unit cell.
Herein, the lattice cells were hypothesised to be linearly elastic and orthotropic on the macro-scale. The effective material properties were calculated using ABAQUS software, where Young’s modulus and Poisson’s Ratio of the base material were set based on our previous work [Citation28]. Based on the generalised Hooke’s law, the macroscopic constitutional relationship existing in the micro structure unit cell is described as follows [Citation29]:
(5)
(5) in which the macroscopic stress
, equal elasticity tensor C, and macroscopic strain
can be expressed as [Citation30]:
(6)
(6)
(7)
(7)
(8)
(8)
The compliance matrix S is defined as the inverse matrix of C, that is [S] = [C]−1, which can be expressed by:
(9)
(9) where Ei (i = 1,2,3) represents the elastic modulus along the X, Y, and Z directions; vij (i,j = 1,2,3) is the Poisson’s Ratio along the j direction due to the principle force in the direction i; Gij (i,j = 1,2,3) denotes the shear modulus in the i-j plane.
According to the inverse relationship, the compliance coefficients can be expressed by stiffness coefficients:
(10)
(10) where C and S are interchangeable, thus the stiffness coefficients of the lattice cell can be defined as:
(11)
(11) Hence, once the mechanical properties of lattice cells are resolved, the matrix C can be calculated. Moreover, the elastic anisotropy of lattice cells can be conveniently assessed by the Zener ratio A, with a value close to 1, the structures can be considered isotropic [Citation31].
(12)
(12)
2.3. Material and laser powder bed fusion processing
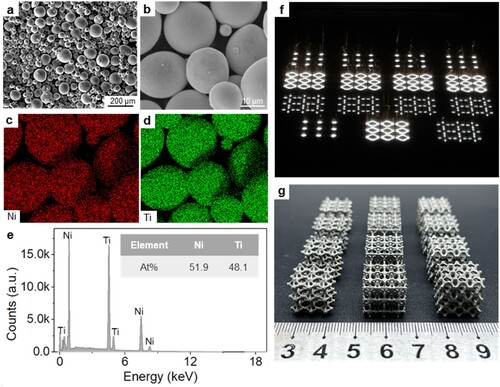
As shown in (a) and (b), the NiTi pre-alloyed powder purchased from China Shenzhen Micro-Nano Additive Technology Co., Ltd. with a particle size of 15-53 µm was utilised as the raw material, which shows a near-spherical shape. As observed in the energy dispersive spectrometer (EDS) analysis, the powder particles appeared to be well pre-alloyed, as the red-bright regions in the distribution map of the Ni element are approximately similar to the green-bright regions in the Ti element, indicating a homogeneous distribution of Ni and Ti elements (c and d). Moreover, the spectrum is presented in (e). A batch of NiTi lattice structures was fabricated using the in-house LPBF system developed by Nanjing University of Aeronautics and Astronautics. The entire fabrication process was carried out under the protection of a high-purity argon atmosphere (99.99%) with an oxygen content lower than 10 ppm. Based on our previous work [Citation32, Citation33], the island scanning strategy with a partition size of 5 mm × 5 mm was applied to reduce the residual stress during the LPBF process, and a batch of lattice structures was fabricated using optimised laser process parameters, including laser power of 125 W, scanning speed of 1400 mm/s, hatching space of 50 μm, and layer thickness of 30 μm. All samples were cut from the substrate by EDM wire cutting, and then ultrasonic cleaned in alcohol solution for 10 min before morphological characterisation. (f) shows the long-exposure photograph during the LPBF process, and the as-built NiTi structures are shown in (g).
Figure 2. (a-b) SEM morphology of NiTi powder; EDS mapping of (c) Ni element, and (d) Ti element; (e) EDS spectrum; (f) Long-exposure photograph of LPBF process; (g) LPBF-fabricated NiTi lattice structures.
2.4. Material characterisation and mechanical testing
The surface morphology of NiTi lattices was characterised by a scanning electron microscope (SEM) (Tescan MIRA4, Czech Republic). The confocal laser scanning microscope (Zeiss LSM 900, Germany) was utilised to measure the surface roughness. The samples for electron backscattered diffraction (EBSD) analysis were prepared based on the cross section which is parallel to the building direction, and transmission electron microscopy (TEM) observation was performed on an FEI Talos F200X instrument, Czech Republic. Phase identification was carried out using an X-ray diffraction diffractometer (XRD) (Bruker D8 Advance, Germany) with Cu-Kα radiation. The phase transformation behaviour was analyzed by differential scanning calorimetry (DSC TA250, USA) at a heating/cooling rate of 10 °C·min−1 in an argon atmosphere.
The mechanical properties and energy absorption characteristics of NiTi lattices were investigated through quasi-static compression tests in line with ISO 13314:2011. The CMT5205 testing machine (MTS Industrial System, China) with a loading capacity of 200 kN was used for all compressive tests, and the cross head velocity was selected as 1 mm/min. The applied load was perpendicular to the building direction. During the compression process, the deformation behaviour and temperature distribution of NiTi lattices were additionally recorded via a digital camera and an infrared camera (FLIR ONE Pro LT, Teledyne FLIR, USA), respectively. Furthermore, a multiple-channel temperature recorder (MT500, Shenhua, China) was utilised to monitor the temperature variation at different positions of NiTi lattices. To further assess the damping and shape memory properties, cyclic compression tests were implemented. After 8 displacement-controlled cycles, NiTi lattices were heated to 100 °C for 5 minutes to obtain a recoverable strain.
3. Results and discussion
3.1. Morphological characterisation
(a) shows the SEM morphologies of LPBF-fabricated NiTi lattices along the building direction. No visible cracks, deformation, or delamination were observed. Nevertheless, a large amount of powder adhesion and micro-pores were observed on the surface of NiTi lattices, as seen in the local magnification, which contributed to the error between the designed model and the as-fabricated NiTi lattices. Except for the above phenomenon, the overhanging structure is another critical factor causing dimensional deviation in the fabrication of complex components [Citation34]. The unsupported outer profile causes a portion of the lattice surface to build on loose powders, while the lower thermal conductivity of metal powder caused a larger molten pool, resulting in some powder particles of the previous powder layer melting and adhering to the bottom of the struts. This leads to the formation of an overhang of accumulated particles at the upper of the pore. Moreover, it is worth noting that the larger pore size along the building direction leads to less powder accumulation within the pore, enhancing the overall surface quality.
Figure 3. (a) SEM morphologies of LPBF-fabricated NiTi lattice structures along building direction; (b) 3D model of HL lattice structure; (c-f): 3D morphologies and surface roughness of HL-TO unit cell: Top surface (c,e) and side surface (d,f); (g) Surface roughness of various lattices.
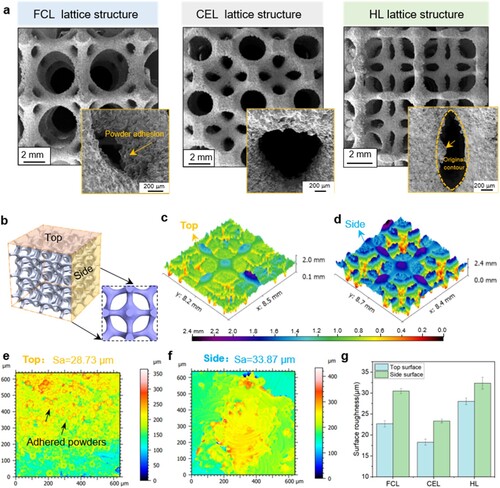
To evaluate the surface roughness of LPBF-fabricated NiTi lattices, the surface topographies at different surfaces (side surface and top surface) were investigated. As shown in (b), the testing region of surface roughness were selected as a flat region with a size of 0.6 mm × 0.6 mm in the insert figure. It can be observed that the top surface seemed relatively smoother than the side surface. Notably, a considerable amount of partially melted particles were observed to adhere to the surface of HL lattice structures, leading to a rough surface (c-f). Moreover, it is all known that the surface roughness of LPBF-fabricated samples is also orientation-dependent. Compared to the top surface, the side surface displayed a higher surface roughness (Sa) due to the layer-by-layer building process, which may create visible steps or ridges. Additionally, the CEL lattice structure generally displayed the lowest Sa value, which was about 18.3 and 23.3 μm at the top and side surface, respectively (g). The smaller pore size of the FCL lattice structure and more horizontal struts of the HL lattice structure were responsible for their higher Sa values. On the one hand, the significant amount of heat generated by laser scanning may accumulate in the narrow pores, leading to higher heat accumulation and thermal gradients. On the other hand, the high surface area of the horizontal struts causes a localised concentration of energy during the LPBF process, and the horizontal struts can also cause unsupported overhangs, which can lead to incomplete melting of the powder and the formation of defects. In contrast, the CEL lattice structure displayed a unique geometric feature with larger pore size and higher inclined angle, which was favourable to improve its surface quality.
3.2. Microstructural characterisation
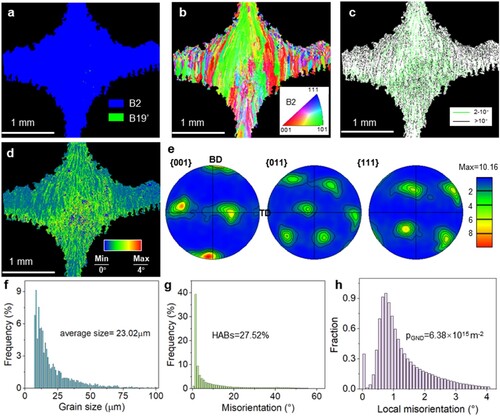
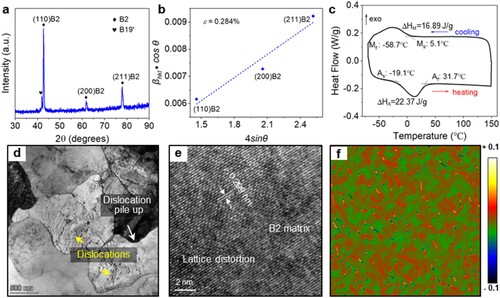
shows the EBSD results for the HL structure. The LPBF-fabricated NiTi lattice was mainly composed of B2 phase, and only a small amount of B19’ phase was observed, as shown in phase map (a). Notably, grains were observed to be finer at the location of strut edge and elongated along the strut direction (b), owing to the higher cooling rate and with the preferential heat conduction along the strut direction. The grains with low angle grain boundaries below 10° are dominant (LAGBs), with a proportion of 72.5%, as indicated in (c,g), and the high angle grain boundaries (HAGBs) are mainly distributed at the strut edge. It is well known that temperature gradient and solidification rate during the LPBF process determine the grain orientation. Since the initial solidification driving force comes from the direction of the maximum temperature gradient, a preference for grain orientation in the [001] direction parallel to the building direction was observed, as the pole figure (PF) shown in (e), resulting in a strong crystalline texture with the value of 10.16. The average grain size of LPBF-fabricated HL structure was 23.02 μm (f). Moreover, the kernel average misorientation (KAM) map could reflect the density of geometrically necessary dislocations (GNDs). It can be observed that the centre of the strut exhibited a higher KAM value than the strut edge, indicating higher plastic deformation or dislocation in this region (d). This phenomenon can be explained by the fact that the central region of the strut experienced more thermal cycling than the strut edge, owing to the thermal accumulation of the track-by-track scanning mode during LPBF process, thereby resulting in relatively higher dislocation formation. As shown in (h), it can be found that the grains with the misorientation of 0.5-1° exhibited a higher frequency.
Figure 4. EBSD diagram of as-fabricated HL lattice:(a) Phase map; (b) Crystal orientation-color relation map; (c,g) Grain boundary (GB) map and the corresponding misorientation angle distribution; (d,h) KAM map and the corresponding distribution plot;(e) Pole figure; (f) Grain size distribution.
Based on the XRD pattern shown in (a), it was obvious that B2 austenite was the dominant phase with a small amount of B19’ martensite, which is consistent with the results of EBSD analysis. As shown in (b), quantitative analysis of the XRD pattern was conducted using the Williamson-Hall method to evaluate the microstrain within the crystalline, from which residual microstrain was estimated as 0.264%. As can be seen in (c), a typical one-stage B2 ↔ B19’ phase transformation occurred with an Af temperature of 31.7 °C, indicating a primarily austenite phase at ambient temperature, which agrees with the XRD results described above. Moreover, the structure exhibited a high phase transition enthalpy of 22.37 J/g, resulting from a destabilisation of B2 phase. Dislocations were observed in the interior of B2 grains due to the high cooling rates (∼ 103–108 K/s) during the LPBF process (d). Furthermore, dislocations pile-ups were observed within the microstructure, potentially enhancing the matrix, and dislocations accumulated within the matrix could impede the movement of martensite and austenite interfaces during stress-induced transformation, thereby enhancing the mechanical properties of LPBF-fabricated NiTi. As shown in (e), the interplanar spacing of B2 matrix was calculated to be 0.2099nm based on the HRTEM image. The inhomogeneous strain tensor components obtained by geometrical phase analysis (GPA), with strain values between – 0.1 and +0.1, as depicted in (f), may influence the martensite transformation and local functional response of NiTi alloy [Citation35, Citation36].
Figure 5. (a) XRD patterns for the as-fabricated samples; (b) Williamson-Hall plots; (c) DSC curves; (d) High-density dislocations; (e) HRTEM image of B2 matrix; (f) Strain tensor components of (e) obtained by GPA.
3.3. Mechanical properties
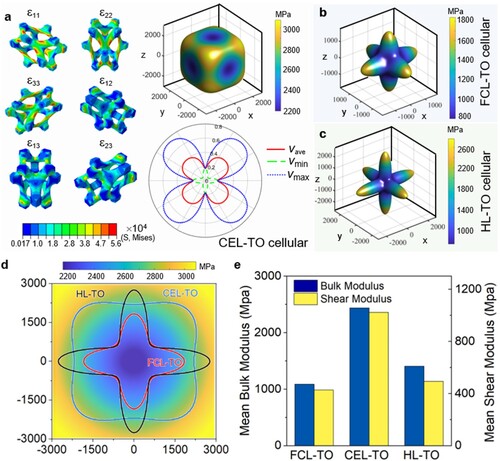
Based on six different loading conditions (a), the effective elastic responses of various lattice structures in different directions were calculated to evaluate the load-bearing capacities. As observed in the spatial distribution of elastic modulus, the rigidity at the uniaxial direction of the FCL-TO (b) and HL-TO (c) unit cells was distinctively stronger than that on the diagonal region. Inversely, the elastic modulus at the diagonal direction of the CEL-TO structure became the maximum directional elastic modulus, resulting in a large improvement in mechanical properties at the diagonal direction. Notably, the FCL-TO structure exhibited the minimum Young’s modulus in all directions, indicating the lowest stiffness, which agrees with the results of plane projections shown in (d). Meanwhile, the Zener ratio of the FCL-TO, CEL-TO, and HL-TO structure was 0.383, 1.473, and 0.211. Compared to the FCL-TO and HL-TO lattice cells, the Zener ratio of the CEL-TO structure was relatively closer to 1, demonstrating its less anisotropy, which was attributed to the improved mechanical properties at diagonal directions and weakened mechanical properties at uniaxial directions. Furthermore, it was obvious that the CEL-TO structure exhibited higher mean bulk modulus and shear modulus, as shown in (e).
Figure 6. Effective elastic performances of (a) CEL-TO, (b) FCL-TO, and (c) HL-TO cellular structure; (d) Plane projections of Young’s modulus (e) Comparison of mean bulk modulus and shear modulus.
(a)-(c) illustrate the force-displacement curves of NiTi lattices. Three force peaks can be found in the curves, which are the same as the number of lattice layers. All curves exhibited similar tendencies, the force increased with the increasing displacement at the elastic-plastic stage. After that, the initiation of buckling led to a sudden drop in force. When the remaining intact part and broken struts come into contact with each other, the lattice structure restarted to bear the load, and the force resumed increasing. The FCL lattice structure, in particular, was prone to breaking at strut connections, resulting in a sudden loss of load-bearing capability, which made the force value drop significantly following the initial peak and tended to be zero. Since the largest elastic modulus at the uniaxial direction of the HL-TO cellular (c), it exhibited the highest initial peak force of 7.6 kN (c). The fracture of the FCL lattice structure tended to initiate at nodes and then spread into adjacent struts (inserted in a), whereas the CEL lattice structure displayed the shear band failure (inserted in b). For the FCL lattice, the loss of structural load-bearing capacity caused by the struts breaking abruptly makes it difficult for the structure to bear the load again (applied strain > 9%). Subsequently, a smaller ascent was observed in the force-displacement curve of the FCL lattice structure with the applied displacement further increased. Notably, the HL lattice structure exhibited a layer-by-layer failure mode, which collapsed from the top layer and developed to the bottom layers (inserted in c). This unique collapse behaviour is the underlying reason for the occurrence of three force peaks that match each other in the force-displacement curve of HL lattice structure.
Figure 7. (a-c) Force-displacement curves; (d-f) Relative load-bearing area along the loading direction; (g-i) Strain hardening rate and true stress-true strain curves.
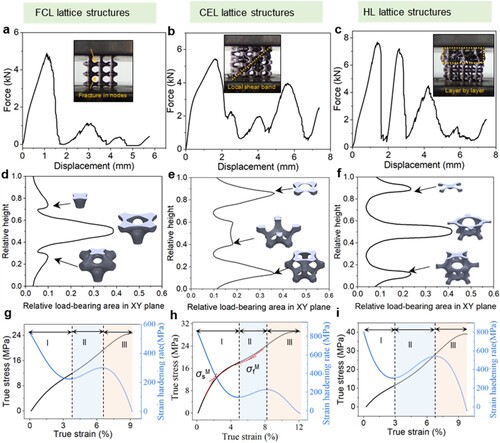
Moreover, research has demonstrated that the internal distribution of material within a lattice structure is an important determinant of its mechanical properties [Citation37], where the relative load-bearing area determines the bearing capacity of a certain location. The establishment of correlations between the geometrical characteristics of unit cells and the mechanical properties of lattice structures enables a prediction of the deformation behaviour of NiTi lattices. The variation of the relative load-bearing area in the XY plane along the loading direction is illustrated in (d)-(f). All unit cells undergo two cycles in height varying from 0.032–0.385, 0.112–0.362, and 0.076–0.415, respectively, indicating the symmetrical geometric characteristic of three lattice structures. The maximum relative loading area of the HL lattice structure is responsible for its highest peak force (c). Since the relative load-bearing area of the FCL lattice structure is lower at nodes (d), the load may be concentrated on a few struts, resulting in local stress concentrations and deformation, thus the fracture was prone to emerge at the nodes. This failure mode has been considered as an unfavourable mechanism that possesses limited energy dissipation capability, which was further demonstrated in Section 3.7. Notably, the smallest variation range of relative bearing area is beneficial for decreasing the force fluctuations (e), contributing to a relatively slower descent of the CEL lattice structure in the force after a fracture. Similarly, the smallest loading area at the top layer of the HL lattice structure caused a higher stress concentration, making the top layer deform more easily and affecting the deformation of the layers below it, thus leading to a layer-by-layer deformation process (f).
(g)-(i) depict the strain hardening rate and true stress-true strain curves of NiTi lattices in the elastic-plastic stage, where they all exhibit the same variation trend. The strain hardening rate curves exhibited three distinct phases: (I) elastic deformation, (II) plastic deformation accompanied by an increasing strain hardening rate, indicating stronger strain hardening effects, and (III) plastic deformation where the strain hardening rate decreased. The transformation stress σsM and σfM denote the start and the end of the stress-induced martensitic transformation, respectively, which can be determined via the intersection method of two tangent red lines [Citation38]. It is worth noting that the CEL lattice structure exhibits a more distinct martensite transformation platform compared to FCL and HL lattice structures, indicating the sensitivity of the structure to stress-induced martensite transformation, which is beneficial for energy absorption and dissipation.
3.4. Energy absorption
To further evaluate the mechanical properties of NiTi lattices, shows the energy absorption curve and radar map based on force-displacement curves. Herein, energy absorption (EA) can be calculated by integrating the corresponding stress-strain curve, which can be expressed as follows [Citation39]:
(13)
(13) where σ(ϵ) denotes the compressive stress, and ϵ is the corresponding strain.
Figure 8. (a) Energy absorption curve; (b) Radar plots for mechanical properties comparison; (c) Comparison of SCS and SEA with other lattice structures [Citation40–47].
![Figure 8. (a) Energy absorption curve; (b) Radar plots for mechanical properties comparison; (c) Comparison of SCS and SEA with other lattice structures [Citation40–47].](/cms/asset/71d51b03-2957-416a-9581-c151ad2aedec/nvpp_a_2365860_f0008_oc.jpg)
Specific energy absorption (SEA) and specific compressive strength (SCS) are employed to exclude the mechanical properties from the influence of lattice density, which can be calculated as follows [Citation48, Citation49]:
(14)
(14)
(15)
(15) where
is the nominal relative density of lattice structures and
denotes the base material density;
represents the ultimate compressive strength.
The cumulative energy absorption of NiTi lattices derived from the load-displacement curves are shown in (a). The CEL and HL lattice structures exhibited better energy absorption capacity compared to the FCL lattice structure. The oscillations can be observed in the EA curve of the HL lattice structure, which is associated with layer-by-layer deformation of the lattice structure from the top to the bottom. Based on the evaluated indicators of mechanical properties shown in (b), the values of the HL lattice structure were far away from the origin, indicating the most excellent load-bearing and energy absorption capacity. Compared with FCL and CEL lattice structures, the HL lattice structure exhibited the highest SEA value of 6.82 J/g, which was increased by 148% and 44.8%, respectively. (c) compares the SEA and SCS of the proposed lattice structures with previously reported lightweight structures, including conventional face-centered cubic (FCC) structures, body-centered cubic (BCC) structures, Octet structures, hierarchical structures, Schwartz diamond (SD) and Rhombic dodecahedron structures. It can be observed that the proposed lattice structures exhibited better energy absorption capacity than most lattices except for modified BCC and SD lattices, and outstanding SCS, indicating that the proposed TO design method for lattice structures is a promising candidate in energy absorption applications.
3.5. Temperature evolution during compression
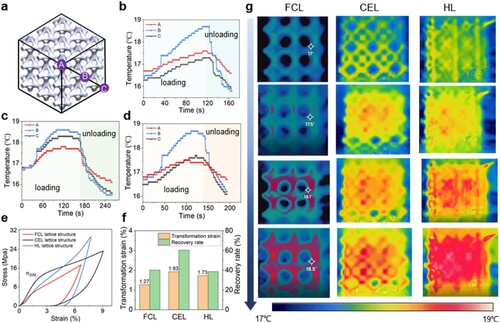
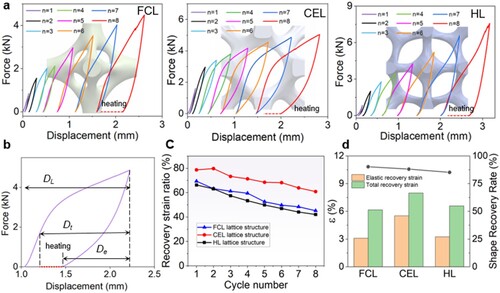
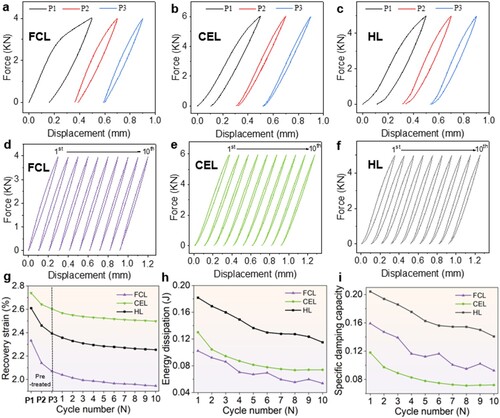
To investigate the temperature evolution of NiTi lattices during compression, the loading-unloading tests of the three lattice structures were conducted, where the displacement was set as 80% of the maximum displacement before failure. Herein, the displacement applied to the FCL, CEL, and HL lattice structures were 1 mm, 1.36 mm, and 1.16 mm, respectively. The testing points were selected at three different positions (top, middle, and bottom) of a certain structure, as marked in (a). As the corresponding temperature curves during the loading-unloading process shown in (b-d), the overall temperature variation displayed a small temperature range between 15 °C and 19 °C. The three curves showed similar tendencies, which presented an overall stepwise change trend and were divided into loading and unloading regions. Upon loading, the temperature initially remained stable while elastic deformation occurred in the austenite state. Upon exceeding the critical stress for martensitic transformation, stress-induced martensitic transformation releases heat, causing a self-heating phenomenon in the structure. The cumulative heat released led to an increment in the temperature of the structure itself, ultimately reaching a peak value by the completion of the transformation process. Inversely, during the unloading stage, the reverse martensite transformation and elastic recovery began instantly. The heat absorption of the transformation from B19’ martensite to B2 austenite accelerates the cooling of the structure. Furthermore, it’s worth noting that a sudden rise was observed in the temperature curve of point A during the loading process, indicating the occurrence of the martensitic transformation at such a moment. (e) shows the loading-unloading curves of the three lattice structures before reaching the critical force for failure. Notably, a significant residual strain was observed in all the force-displacement curves, which demonstrated the B2 phase slipped and a small amount of irreversible plastic deformation during the loading process [Citation50]. The comparison of stress-induced martensite (SIM) strain and strain recovery rate is shown in (f). It can be observed that the CEL lattice structure exhibited the highest transformation strain and strain recovery rate at room temperature, with values of 1.93% and 60.3%, respectively. Furthermore, (g) illustrates the evolution of temperature morphologies during the loading process. It was obvious that the difference in surface temperature distribution gradually increased during the compression process. Higher local temperature was observed in the middle section of NiTi lattices, which is consistent with the highest temperature at point B in the temperature curves.
Figure 9. (a) Specific measured points of FCL lattice structure; (b-d) Temperature variation during compression process of FCL (b), CEL (c) and HL (d) lattice structures; (e) Loading-unloading curves; (f) Comparison of transformation strain and strain recovery rate; (g) Temperature evolution during loading process.
3.6. Shape memory effect
The stepwise displacement loading experiments were performed, which were displacement-controlled to 80% maximum displacement with a 10% increment, as displayed in (a). After unloading, all NiTi lattices were heated up to a temperature above the austenite finishing temperature to investigate the shape memory effect (SME). The recovery curves of three lattices were displayed with red dotted lines. It can be found that all NiTi lattices exhibited the hysteresis effect during each loading-unloading cycle, and the CEL lattice structure exhibited a larger hysteresis area, indicating larger energy dissipation. However, the accumulated strains of all lattice structures were increased as the cycle number increased. It can be attributed to the inability of the stabilised B19’ phase to fully return to the parent B2 phase upon unloading, owing to the introduction of dislocations during mechanical cycling [Citation51], which was in accordance with the findings of Oliveira. (c) shows the evolution of the elastic recoverable strain ratio with the number of cycles, which was calculated from the ratio of elastic recoverable deformation De to the applied displacement DL (as marked in (b). It can be observed that the mechanical recoverable strain ratio decreased with the cycle number. Notably, the CEL lattice structure exhibited higher values overall. The irrecoverable deformation of all lattice structures was still observed after heating, indicating the presence of stable irreversible martensite in the lattice structure. This is mainly due to the accumulation of dislocations in the material during cyclic compression, which limits the reversal of martensite transformation. The shape recovery capability of NiTi lattice structures, on the other hand, is determined by their geometrical features. The CEL lattice structure possessed a large number of cell struts dominated by bending deformation, making it prone to undergo bending during the loading process, which reduces the formation of plastic deformation and is beneficial for deformation recovery. The shape recovery rate after heating was calculated by the ratio of the total recoverable deformation Dt to the applied displacement DL. As shown in (d), the FCL structure exhibited an excellent shape memory effect, with a shape recovery rate of 90% at 7% applied strain, followed by CEL of 88% and HL of 85%. It is worth noting that the trade-off between load-bearing capacity and shape recovery capacity is difficult to establish. Although the HL structure exhibited the smallest shape recovery capacity, it achieved a relatively higher shape memory recovery ratio while achieving a high specific strength of 41.74 MPa·cm3/g compared with the traditional lattice structure. Furthermore, compared with the P835 NiTi scaffolds with a shape recovery rate of 79.7% reported by Lu et al, the as-fabricated TO lattices exhibited higher large deformation capacities [Citation24].
Figure 10. (a) Cyclic compression behaviour and recoverable strain via heating of three lattice structures, (b) Illustration of DL, Dt and De, (c) Variation in elastic recoverable strain ratio with number of cycles; (d) Comparison of recoverable strain and shape recovery ratio.
3.7. Damping properties
The damping performances were evaluated by specific damping capacity (SDC), which can be expressed by [Citation52, Citation53]:
(16)
(16) where ΔW denotes the energy dissipation during the loading-unloading process and can also be correlated to the area of the hysteresis loop; W means the energy absorbed during loading that can be calculated by the area of the loading curve.
shows the cyclic compression responses of NiTi lattice structures applied with 3.5% strain at 50 °C. Mechanical pre-treatments were implemented prior to the cyclic loading-unloading process to achieve better reversibility (a-c). Notably, the residual strain of the FCL, CEL, and HL lattice structure after three mechanical pre-treatments was about 0.07%, 0.04%, and 0.07%, respectively. After that, 10 loading-unloading cycles were performed, as shown in (d-f). All force-displacement curves show excellent superelastic properties with a slim hysteresis area and no obvious stress plateau can be observed. (g) shows the variation in the recoverable strain of NiTi lattices with the cycle number, which gradually decreased as the cycle number and remained stable after 10 cycles. The variation in energy dissipation and specific damping capacity of LPBF-fabricated NiTi lattices are displayed in (h) and (i), respectively, which all exhibited a descending trend with the cycle number. It has been shown that the HL lattice structure exhibited better energy dissipation and damping properties, with an improved energy dissipation by approximately a factor of 2 and 1.5 than the FCL and CEL lattice structure, respectively.
Figure 11. (a, b, c) Mechanical pre-treatment, (d, e, f) cyclic compression behaviour at 50 °C, variation in (g) recovery strain, (h) energy dissipation, and (i) specific damping capacity with cycle number.
4. Conclusions
The present work designed lightweight lattice structures with different force distributions based on a strain energy-based topology optimisation (TO) algorithm. The shape memory effect, energy absorption behaviour, and damping capacity of NiTi lattices manufactured by laser powder bed fusion (LPBF) technology were characterised by compressive testing. Based on the research in this paper, the following conclusions can be drawn:
All the as-built lattices show no visible cracks, deformation, or delamination, while the CEL lattice structure exhibited higher surface quality with the surface roughness of 18.3 and 23.3 μm of the top and side surface, due to its relatively larger pore size and higher inclined angles of struts.
The microstructures of LPBF-fabricated NiTi lattice composed of dominant B2 phase with a small amount of B19’, which appeared finer at the strut edge and elongated along the strut direction. The presence of accumulated dislocations within the matrix contributed to a better shape memory effect.
The HL lattice structure exhibited excellent load-bearing capacity, with an initial peak force of 7.6 kN and a specific compressive strength of 41.74 MPa·cm3/g. The HL lattice structure exhibits a layer by layer successful failure mode, resulting in the highest SEA value of 6.82 J/g, which is 148% and 44.8% higher than the FCL and CEL lattice structures, respectively.
The HL lattice structure achieved a high recovery rate of 85% via heating when loaded at a strain of 7%. However, the HL lattice structure exhibited better energy dissipation capability and damping properties, with a hysteresis area of 0.12 J/g and a specific damping capacity of 0.14 after 10 loading-unloading cycles. This provides a possibility to make a tradeoff between the two functional properties while taking into account the mechanical and functional requirements for components.
Data availability statement
The data that support the findings of this study are available from the corresponding author upon reasonable request.
Disclosure statement
No potential conflict of interest was reported by the author(s).
Additional information
Funding
References
- Yu GJ, Xiao LJ, Song WD. Deep learning-based heterogeneous strategy for customizing responses of lattice structures. Int J Mech Sci. 2022;229:107531. doi:10.1016/j.ijmecsci.2022.107531
- Yin HF, Zhang WZ, Zhu LC, et al. Review on lattice structures for energy absorption properties. Compos Struct. 2023;304:116397. doi:10.1016/j.compstruct.2022.116397
- Okubo S, Yamauchi Y, Kitazono K. Effects of random and controlled irregularity in strut lattice structure of PA12 on compression anisotropy. Addit Manuf. 2023;63:103385.
- Zhu JN, Ding ZY, Borisov E, et al. Healing cracks in additively manufactured NiTi shape memory alloys. Virtual Phys Prototyp. 2023;18:e2246437. doi:10.1080/17452759.2023.2246437
- Elahinia M, Moghaddam NS, Andani M, et al. Fabrication of NiTi through additive manufacturing: a review. Prog Mater Sci. 2016;83:630–663. doi:10.1016/j.pmatsci.2016.08.001
- Lu HZ, Chen T; Liu LH, et al. Constructing function domains in NiTi shape memory alloys by additive manufacturing. Virtual Phys Prototyp. 2022;17: 563-581.
- Yang Q, Sun KH, Yang C, et al. Compression and superelasticity behaviors of NiTi porous structures with tiny strut fabricated by selective laser melting. J Alloy Compd. 2021;858:157674. doi:10.1016/j.jallcom.2020.157674
- Dallago M, Raghavendra S, Luchin V, et al. The role of node fillet, unit-cell size and strut orientation on the fatigue strength of Ti-6Al-4V lattice materials additively manufactured via laser powder bed fusion. Int J Fatigue. 2021;142:105946. doi:10.1016/j.ijfatigue.2020.105946
- Zhao M, Zhang DZ, Li ZH, et al. Design, mechanical properties, and optimization of BCC lattice structures with taper struts. Compos Struct. 2022;295:115830. doi:10.1016/j.compstruct.2022.115830
- Zhang C, Zheng H, Yang L, et al. Mechanical responses of sheet-based gyroid-type triply periodic minimal surface lattice structures fabricated using selective laser melting. Mater Des. 2022;214:110407. doi:10.1016/j.matdes.2022.110407
- Zhao M, Li X, Zhang D, et al. TPMS-based interpenetrating lattice structures: design, mechanical properties and multiscale optimization. Int J Mech Sci. 2023;244:108092. doi:10.1016/j.ijmecsci.2022.108092
- Lu H, SN C. An overview of materials with triply periodic minimal surfaces and related geometry: from biological structures to self-assembled systems. Adv Mater. 2018;30:1705708. doi:10.1002/adma.201705708
- du Plessis A, Razavi SMJ, Benedetti M, et al. Properties and applications of additively manufactured metallic cellular materials: a review. Prog Mater Sci. 2022;125:100918. doi:10.1016/j.pmatsci.2021.100918
- Meng L, Zhao J, Lan XQ, et al. Multi-objective optimisation of bio-inspired lightweight sandwich structures based on selective laser melting. Virtual Phys Prototyp. 2019;15:106–119. doi:10.1080/17452759.2019.1692673
- Liu Y, Chen BP, Wang CY, et al. Design of porous metal block augmentation to treat tibial bone defects in total knee arthroplasty based on topology optimization. Front Bioeng Biotechnol. 2021;9:765438. doi:10.3389/fbioe.2021.765438
- Dilgen CB, Dilgen SB, Aage N, et al. Topology optimization of acoustic mechanical interaction problems: a comparative review. Struct Multidiscip Optim. 2019;60:779–801. doi:10.1007/s00158-019-02236-4
- Li QH, Sigmund O, Jensen JS, et al. Reduced-order methods for dynamic problems in topology optimization: a comparative study. Comput Meth Appl Mech Eng. 2021;387:114149. doi:10.1016/j.cma.2021.114149
- Liu BS, Huang XD, Huang CF, et al. Topological design of structures under dynamic periodic loads. Eng Struct. 2017;142:128–136. doi:10.1016/j.engstruct.2017.03.067
- Zhang L, Song B, Fu JJ, et al. Topology-optimized lattice structures with simultaneously high stiffness and light weight fabricated by selective laser melting: design, manufacturing and characterization. J Manuf Process. 2020;56:1166–1177. doi:10.1016/j.jmapro.2020.06.005
- Song J, Wang Y, Zhou WZ, et al. Topology optimization-guided lattice composites and their mechanical characterizations. Compos Part B-Eng. 2019;160:402–411. doi:10.1016/j.compositesb.2018.12.027
- Oliveira JP, Santos TG, Miranda RM. Revisiting fundamental welding concepts to improve additive manufacturing: from theory to practice. Prog Mater Sci. 2020;107:100590. doi:10.1016/j.pmatsci.2019.100590
- Chen LY, Liang SX, Liu YJ, et al. Additive manufacturing of metallic lattice structures: unconstrained design, accurate fabrication, fascinated performances, and challenges. Mater Sci Eng R-Rep. 2021;146:100648. doi:10.1016/j.mser.2021.100648
- Blakey-Milner B, Gradl P, Snedden G, et al. Metal additive manufacturing in aerospace: a review. Mater Des. 2021;209:110008. doi:10.1016/j.matdes.2021.110008
- Lu HZ, Ma HW, Luo X, et al. Microstructure, shape memory properties, and in vitro biocompatibility of porous NiTi scaffolds fabricated via selective laser melting. J Mater Res Technol. 2021;15:6797–6812. doi:10.1016/j.jmrt.2021.11.112
- Zhang XL, Jiang Y, Wang SP, et al. Compression behavior and failure mechanisms of bionic porous NiTi structures built via selective laser melting. Acta Metall Sin. 2023;36:926–936. doi:10.1007/s40195-023-01523-w
- Shi KY, Gu DD, Liu H, et al. Process-structure multi-objective inverse optimisation for additive manufacturing of lattice structures using a physics-enhanced data-driven method. Virtual Phys Prototyp. 2023;18:e2266641. doi:10.1080/17452759.2023.2266641
- Feng JW, Liu B, Lin ZW, et al. Isotropic porous structure design methods based on triply periodic minimal surfaces. Mater Des. 2021;210:110050. doi:10.1016/j.matdes.2021.110050
- Chen W, Gu DD, Yang JK, et al. Compressive mechanical properties and shape memory effect of NiTi gradient lattice structures fabricated by laser powder bed fusion. Int J Extreme Manuf. 2022;4: 045002. doi:10.1088/2631-7990/ac8ef3
- Zhang L, Ma QP, Ding JH, et al. Design of elastically isotropic shell lattices from anisotropic constitutive materials for additive manufacturing. Addit Manuf. 2022;59:103185.
- Ma QP, Zhang L, Ding JH, et al. Elastically-isotropic open-cell minimal surface shell lattices with superior stiffness via variable thickness design. Addit Manuf. 2021;47:102293.
- Fu JJ, Sun PF, Du YX, et al. Isotropic design and mechanical characterization of TPMS-based hollow cellular structures. Compos Struct. 2022;279:114818. doi:10.1016/j.compstruct.2021.114818
- Liu X, Gu DD, Yuan LH, et al. Effect of laser printing mode on surface topography, microstructure, and corrosion property of additive-manufactured NiTi alloy. Adv Eng Mater. 2023;25:2300184. doi:10.1002/adem.202300184
- Yuan LH, Gu DD, Lin KJ, et al. Electrically actuated shape recovery of NiTi components processed by laser powder bed fusion after regulating the dimensional accuracy and phase transformation behavior. Chin J Mech Eng Addit Manuf Front. 2022;1:100056.
- Yang L, Li Y, Wu SQ, et al. Tailorable and predictable mechanical responses of additive manufactured TPMS lattices with graded structures. Mater Sci Eng A-Struct Mater Prop Microstruct Process. 2022;843:143109. doi:10.1016/j.msea.2022.143109
- Li BQ, Wang L, Wang BB, et al. Solidification characterization and its correlation with the mechanical properties and functional response of NiTi shape memory alloy. Addit Manuf. 2021;48:102468.
- Li Z, Xiao F, Chen H, et al. Atomic scale modeling of the coherent strain field surrounding Ni4Ti3 precipitate and its effects on thermally-induced martensitic transformation in a NiTi alloy. Acta Mater. 2021;211:116883. doi:10.1016/j.actamat.2021.116883
- Zhao M, Zhang DZ, Liu F, et al. Mechanical and energy absorption characteristics of additively manufactured functionally graded sheet lattice structures with minimal surfaces. Int J Mech Sci. 2020;167:105262. doi:10.1016/j.ijmecsci.2019.105262
- Yang Y, Zhan JB, Sun ZZ, et al. Evolution of functional properties realized by increasing laser scanning speed for the selective laser melting fabricated NiTi alloy. J Alloys Compd. 2019;804:220–229. doi:10.1016/j.jallcom.2019.06.340
- Ha NS, Pham TM, Hao H, et al. Energy absorption characteristics of bio-inspired hierarchical multi-cell square tubes under axial crushing. Int J Mech Sci. 2021;201:106464. doi:10.1016/j.ijmecsci.2021.106464
- Maconachie T, Lear M, Tran P, et al. The effect of topology on the quasi-static and dynamic behaviour of SLM AlSi10Mg lattice structures. Int J Adv Manuf Technol. 2022;118:4085–4104. doi:10.1007/s00170-021-08203-y
- Wang P, Yang F, Li PH, et al. Design and additive manufacturing of a modified face-centered cubic lattice with enhanced energy absorption capability. Extreme Mech Lett. 2021;47:101358. doi:10.1016/j.eml.2021.101358
- Smith M, Guan Z, Cantwell WJ. Finite element modelling of the compressive response of lattice structures manufactured using the selective laser melting technique. Int J Mech Sci. 2013;67:28–41. doi:10.1016/j.ijmecsci.2012.12.004
- Wang P, Yang F, Lu GX, et al. Anisotropic compression behaviors of bio-inspired modified body-centered cubic lattices validated by additive manufacturing. Compos Part B. 2022;234:109724. doi:10.1016/j.compositesb.2022.109724
- Xiao LJ, Xu X, Feng GZ, et al. Compressive performance and energy absorption of additively manufactured metallic hybrid lattice structures. Int J Mech Sci. 2022;219:107093. doi:10.1016/j.ijmecsci.2022.107093
- Cao XF, Xiao DB, Li Y, et al. Dynamic compressive behavior of a modified additively manufactured rhombic dodecahedron 316L stainless steel lattice structure. Thin-Walled Struct. 2020;148:106586. doi:10.1016/j.tws.2019.106586
- Yang L, Han CJ, Wu HZ, et al. Insights into unit cell size effect on mechanical responses and energy absorption capability of titanium graded porous structures manufactured by laser powder bed fusion. J Mech Behav Biomed Mater. 2020;109:103843. doi:10.1016/j.jmbbm.2020.103843
- Wang P, Yang F, Ru DH, et al. Additive-manufactured hierarchical multi-circular lattice structures for energy absorption application. Mater Des. 2021;210:110116. doi:10.1016/j.matdes.2021.110116
- Yang L, Li Y, Chen Y, et al. Topologically optimized lattice structures with superior fatigue performance. Int J Fatigue. 2022;165:107188. doi:10.1016/j.ijfatigue.2022.107188
- Li LB, Yang F, Li PH, et al. A novel hybrid lattice design of nested cell topology with enhanced energy absorption capability. Aerosp Sci Technol. 2022;128:107776. doi:10.1016/j.ast.2022.107776
- Feng Y, Liu BC, Wan XM, et al. Influence of processing parameter on phase transformation and superelastic recovery strain of laser solid forming NiTi alloy. J Alloys Compd. 2022;908:164568. doi:10.1016/j.jallcom.2022.164568
- Oliveira J, Miranda R, Schell N, et al. High strain and long duration cycling behavior of laser welded NiTi sheets. Int J Fatigue. 2016;83:195–200. doi:10.1016/j.ijfatigue.2015.10.013
- Prajapati M, Kumar A, Lin S, et al. Multi-material additive manufacturing with lightweight closed-cell foam-filled lattice structures for enhanced mechanical and functional properties. Addit Manuf. 2022;54:102766.
- Yan ZR, Zhu JN, Borisov E, et al. Superelastic response and damping behavior of additively manufactured Nitinol architectured materials. Addit Manuf. 2023;68:103505.