
Abstract
This paper focuses on the method for creating 3-dimensional (3D) digital models extracted from patient- specific scans of the brain. The described approach consists of several cross-platform stages: raw data segmentation, data correction in 3D-modelling software, post-processing of the 3D digital models and their presentation on an interactive web-based platform. This method of data presentation offers a cost and time effective option to present medical data accurately. An important aspect of the process is using real patient data and enriching the traditional slice-based representation of the scans with 3D models that can provide better understanding of the organs’ structures. The resulting 3D digital models also form the basis for further processing into different modalities, for example models in Virtual Reality or 3D physical model printouts. The option to make medical data less abstract and more understandable can extend their use beyond diagnosis and into a potential aid in anatomy and patient education. The methods presented in this paper were originally based on the master thesis ‘Transparent Minds: Testing for Efficiency of Transparency in 3D Physical and 3D Digital Models’, which focussed on creating and comparing the efficiency of transparent 3D physical and 3D digital models from real-patient data.
Introduction
In the age of technological advancements, the evolution of teaching methods allows for a variety of approaches. These advancements allowed going beyond learning from textbooks and two-dimensional (2D) images to three-dimensional (3D) models that aid in spatial understanding and interactions between forms. This is especially helpful in learning anatomy since the layout and placement of tissues in space is important in understanding their function.
One way of creating the 3D models is by using patient specific data and extracting specific anatomical structures in segmentation software, for example, 3D Slicer 4.10.2 (3D Slicer, Citation2020). This process involves automatic and manual segmentation of data that creates highly accurate 3D models. This paper described the process of creating anatomically accurate 3D digital transparent models. Transparency, described later in this paper, has been proven to be helpful in showing anatomical placement of organs in relation to their surroundings. This combined with the anatomical accuracy of created 3D digital models through segmentation of raw data yields a useful tool for teaching anatomy. The method to create these types of 3D digital transparent models was described in this paper. The described method demonstrated it on two datasets of Magnetic Resonance Imaging (MRI) scans of an individual with a healthy brain, and scans of a patient with atrophied brain matter due to Alzheimer’s Disease (AD). The project detailed the use for the 3D digital models through interactive online platform, Sketchfab, and suggested their further use, for example in 3D printing. The main objective of this paper was to present the workflow that can be employed to create patient-specific 3D digital models that can be used in patient education, communication with public domain or teaching anatomy.
Background research: 3D models
Recent methods to teach anatomy include interactive resources such as 3D digital models and 3D printss that have proven to be successful through positive learning outcomes and cost effectiveness. Many of the 3D physical models are sourced from their 3D digital counterparts. Crossing the barrier of having to learn anatomy from cadavers, 3D digital and physical models used in anatomy education alongside the cadavers were proven to help with spatial understanding (Hoyek, Collet, Di Rienzo, De Almeida, & Guillot, Citation2014).
3D digital models
3D segmentation software has been proven to be useful in creating accurate 3D digital models from patient specific data, which helped in understanding anatomy knowledge. The study by Pujol et al. (Citation2016) showed that using computer segmentation software to create highly accurate 3D models from MRI data increases the knowledge of the internal abdominal anatomy (mediastinum, upper abdomen, and pelvis) from MRI data. At the beginning of the study, spatial understanding was identified as an issue in learning the complex organisation of organs, even after traditional studying from 2D images and hands-on dissection. The follow-up written tasks and qualitative data have shown that the students understood the spatial relationship, organs, and variation between specimen better than before creating the 3D models themselves.
The benefits of 3D models are further supported by meta-analysis of articles (Triepels et al., Citation2020) that focussed on examining the effectiveness of 2D learning tools, 3D digital learning tools (including augmented reality (AR), virtual reality (VR), and digital models), 3D physical models and cadavers. The examined studies compared the modalities between each other. It was shown that most participants in the studies had preference for the VR and AR computer-based 3D learning techniques.
A review examining 3D digital and 3D physical models, including 3D printing (Fredieu, Kerbo, Herron, Klatte, & Cooke, Citation2015) highlighted the use of 3D physical models (accurately made from raw data and 3D printed) and the improvement of spatial understanding with tangible objects. At the beginning of the experiment, the participants were evaluated for cognitive reasoning. The participants were individuals from dental, veterinary, and medical schools and it was concluded that they did not lack abstract reasoning and logical thinking. Using a physical 3D model could help them overcome difficulties with visually reconstructing data that was rendered digitally. Therefore, it was shown that people, despite having high cognitive abilities, can have difficulty with understanding spatial understanding, which can be aided by using 3D physical models made from raw data.
Previously, researchers (Rosa et al., Citation2019) have examined the efficiency of 3D digital models compared to 3D physical models. Unlike the previous experiment (Fredieu et al., Citation2015) which showed preference for the 3D physical models, the research into 3D digital versus 3D physical models by Rosa et al. (Citation2019), showed that the use of digital 3D models was preferred. This was shown through increased knowledge of anatomy and participants’ satisfaction with a digital learning resource. The satisfaction had the minimal increase of 80% after using digital resources compared to learning anatomy without any 3D model. One way to explain the success of 3D digital models in anatomy teaching is due to advancements in digital technology.
In conclusion, these studies have demonstrated that using 3D digital models in medical, dental, and anatomical education was helpful due to the ability help with spatial placement of the organs.
Transparency
Transparency is a method that has been effectively used in creation of physical models in anatomical education. Franz Tschackert, a German scientist and doctor, has revolutionised how we learn and view the human body using transparency. In 1927, he created a life-sized 3D model of the “Glaserner Mensch”. The model of the ‘glass man’ was innovative due to showing the spatial relationships between the lymphatic, skeletal, and venous systems in relation to each other and to the surrounding organs. The multi-layered 3D physical model that differed to previous 2D anatomical drawings showed organisation of structures that were difficult to see in cadavers.
The transparency component can be easily applied in the software used to create 3D virtual models. Applying transparency in 3D digital models in animations or in applications allows seeing the form of the desired organ for placement context and for seeing its innermost structures.
Using transparency in 3D physical models based on patient-specific data has shown positive outcomes in patient education (Yang et al., Citation2018). In this study, the 3D printed transparent liver models with hepatic tumour were created from Computerised Tomography scans (CT) of children’s livers and used as patient education tool for their parents. The patient specific 3D transparent physical models taught parents about liver anatomy, physiology, tumour characteristic, the planned liver surgery (hepatectomy), and the surgical risks of the procedure. A questionnaire filled out by the parents of the child patients has shown an increase of understanding of the upcoming surgery.
In research (Fernandez, Citation2019) conducted into the effectiveness of transparency in learning anatomy between 3D physical versus 3D digital versus 2D images. The different modalities used transparency as a tool to teach the anatomy of human heart. It suggested that transparency is helpful, as indicated by the nine out of ten participants who agreed with the statement. The researcher has also suggested improvements in creating physical, transparent resin models in the future.
Narrowing down the possibilities to teach anatomy (3D virtual models) and choosing an approach (transparency) is promising in effectively showing the innermost structures that are not easily accessible, such as the structures of the brain. This is especially useful in showing the changes of the hidden physiology, such as the hippocampus located deep inside the brain. Hippocampus is a structure that is susceptible to change but because of its location, it is not easily pictured. Its change is usually shown with MRI only after its structural change causes an outward symptom through the change in behaviour.
Understanding neurological disorders
Neurological disorders are often first observed from differences in behaviour. The MRI images that show anatomical change are generally confusing for people who are not taught to read them because of their abstract appearance. However, it is important for neurological patients and their families to understand how the disease impacts the structures of the brain in relation to it. For example, as shown in the previous research (van der Steen et al., Citation2013), understanding dementia increases comfort of patients during their dying process.
One of the effects of the Alzheimer’s disease is confusion (Alzheimer’s Disease and Dementia, Citation2020), which has an impact on personality and creates difficulties for the patients and their families. Not only they must adjust their lifestyles to accommodate this condition, but it is also a concept that is difficult to grasp because it does not have outward physical symptoms. Therefore, physical representation of the changes in the brain can help the patients and their families to understand the disease.
Given the importance of teaching anatomy to the public domain as well as medical students, the researchers must find an effective means of conveying scientific information. This presents a process of transforming patient specific medical data into transparent 3D digital models. The final models visibly show differences in hippocampus of patient affected by AD and a healthy brain. The methods described in the following chapters are based on a dissertation project, Transparent Minds: Testing for Efficiency of Transparency in 3D Physical and 3D Digital Models’ (Pokojna, Citation2020), which aimed to compare the effectiveness of transparency in the 3D digital and 3D physical modalities as learning tools. The focus of this paper is specifically to describe the methods used to visually represent patient specific data using transparency in 3D digital models.
Materials and methodology
This chapter focuses on the main scope of this paper, which is detailed description of design and methodology of creating 3D digital models from patient MRI brain scans.
Materials
Multidisciplinary approach of processing data was used in re-creating patient-specific medical datasets. This consisted of creating accurate 3D digital models from raw MRI brain scans and processing them into digital 3D models using segmenting software, 3D modelling software and an online interactive platform. The summary of use for each software is shown in .
Table 1. Summary of the software and an online platform used to make the 3D digital models.
Methodology
This section outlines the planning of the 3D digital model creation from 2D MRI scans.
Data
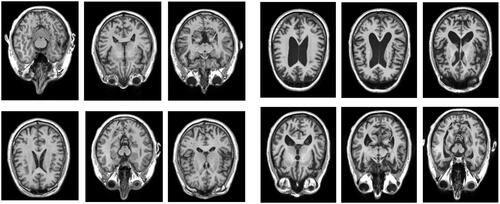
The data and analysis that form the basis of this project were obtained from medical databases ‘Open Access Series of Brain Imaging Studies’, OASIS, (Citation2020; http://oasis-brains.org) for healthy brains and ‘Alzheimer’s Disease Neuroimaging Initiative’, ADNI, (Citation2020; http://adni.loni.usc.edu/) for the AD brain. The data from both databases were made available to the author of this paper thanks to one of the supervisors’ researches, which allowed them to use the two brain datasets. The datasets of the patients have been anonymised. below shows examples of the axial MRI data sets used in this experiment (a) healthy brains and b) AD brains). The finished 3D digital models based on these datasets have been uploaded to a Sketchfab (Citation2020; https://sketchfab.com/) under a private url link to further protect the anonymity, further described in the Results section of this paper.
Figure 1. An example selection of MRI scans used to create the 3D digital model of hippocampus for the healthy brain (left) and atrophied brain by AD (right). The healthy brain MRI scans were obtained from the Open Access Series of Brain Imaging Studies’, OASIS database and the MRI scans for AD brain were obtained from the ‘Alzheimer’s Disease Neuroimaging Initiative’, ADNI database.
Data description
The following and show an explanation of observed results from the MRI scans. The data analysis in and have accompanied the raw MRI data used to create the 3D digital models. below shows processed MRI scans as 2D images. While conclusions about the structure and function of the brain can be made from the raw MRI data, they describe a 3D object (brain) on a 2D format (types of analysis) which makes it difficult to understand in terms of spatial understanding.
Figure 2. Regional analysis showing the Hippocampal Volume Percentile by highlighting the hippocampus in the healthy brain (left) and the AD brain (right).
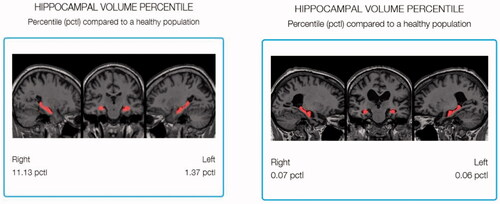
Figure 3. Analysis of hippocampal volume of the control brain (left) and the AD brain (right). It describes the 3D volumetric data in a 2D chart.
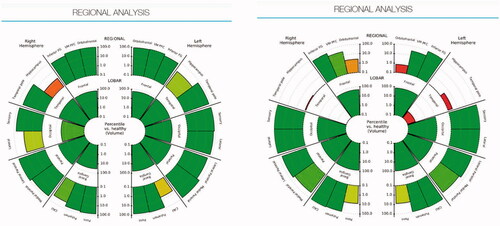
The regional analysis in shows the analysis of the brain volume which can help infer its function capability based on the physical architecture of the left and right hippocampi. The analysis highlights the hippocampus of a healthy brain of MRI scans in 2D (, left) in comparison to the atrophied brain (, right). It describes volumetric loss; however, it is difficult to relate the 2D graph to the real 3D volume since no 3D representation is provided.
Development planning
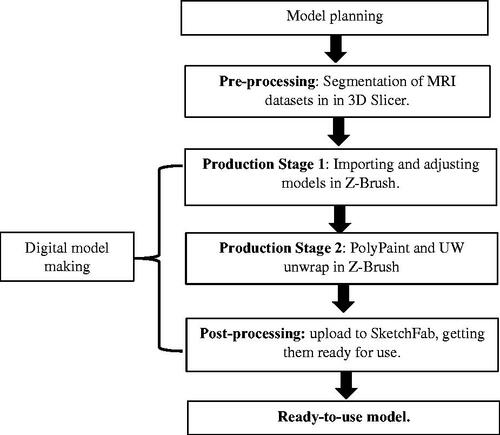
outlines the workflow of creating the 3D digital models. The first stage consisted of planning the creation of the 3D digital models. This was followed by pre-processing of the data where they were segmented in 3D Slicer. The digital model of the brains was made by importing the models and adjusting them in 3D modelling software, then creating UW maps for them. The digital model was complete after post-processing when it was adjusted and uploaded to the online platform SketchFab.
Figure 4. Development workflow.
Model creation
The following section focuses on the creation of 3D models from patient specific data.
Pre-production
The raw data were MRI scans of a brain with Alzheimer’s Disease and a healthy brain. The hippocampus, the brain part that helps diagnose AD, was segmented in the 3D Slicer 4.10.2 software. To do this, first the data were uploaded to Slicer 4.10.2 in the DICOM format. 3D Slicer 4.10.2 (http://www.slicer.org/) is an opensource software that allows the user to load raw PET, MRI, or CT data and segment specific anatomy. Segmentation can be done based on the density of the structure, shape of the structure, or area chosen by the user (Paint Effect). This tool was selected because its wide range of features, its availability, its strong online community presence in case of issues, and the author’s previous experience with the tool. More alternatives for segmentation tools are available, an example is an opensource (https://invesalius.github.io/) developed by Centro de Tecnologia da Informação Renato Archer (CTI) (Amorim et al., Citation2015).
Measurements were taken in the software to measure the distance of hippocampus from the superficial surface of the grey mater. These measurements were used to place the hippocampus in the right location in the 3D digital models in later stages. The process of segmenting the hippocampus from raw MRI data is illustrated in in the healthy brain and in the AD brain.
Figure 5. Data processing.
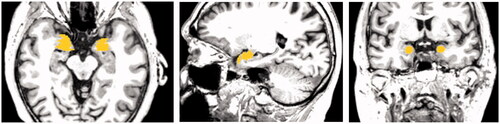
Figure 6. Data checking. The images are arranged in the order they are displayed in 3D Slicer. The top right square shows the viewport with 3D model representation against the axial, coronal, and sagittal MRI scans (2D) which can be scrolled to specific image. These are then displayed in the other three viewports (top left, bottom left, bottom right) in 2D where they also show the highlighted 3D representation.
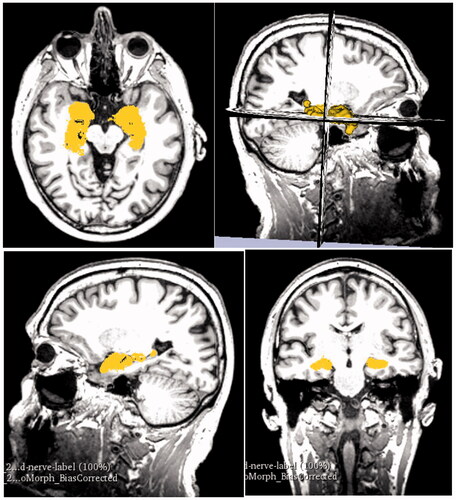
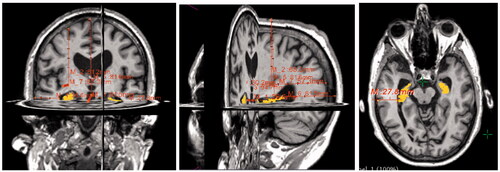
Figure 7. Measuring distance of hippocampus using ruler tool in the Slicer software.
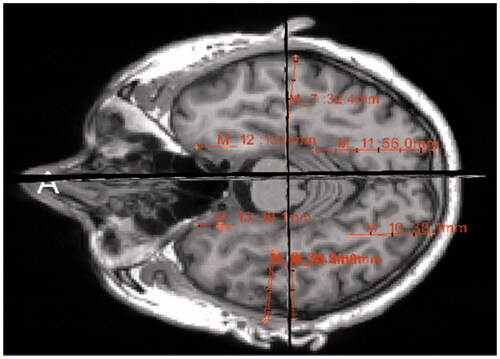
Figure 8. Data process using the Paint Effect tool. The brown area is the highlighted hippocampus.
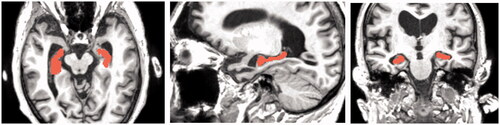
Figure 9. Data process: using Segment Editor The hippocampus is highlighted in green.
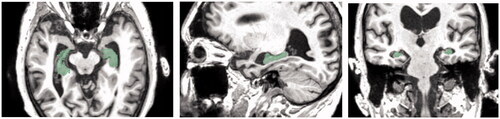
Figure 10. Data checking of overlap between Segmentation paint effect tool (brown) and Segmentation Editor (dim green). This figure shows the enlarged overlapping regions in the horizontal, sagittal, and coronal crosscut.
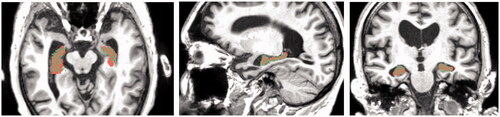
Figure 11. Data checking by comparison of 3D model (right) against the MRI scans (left).
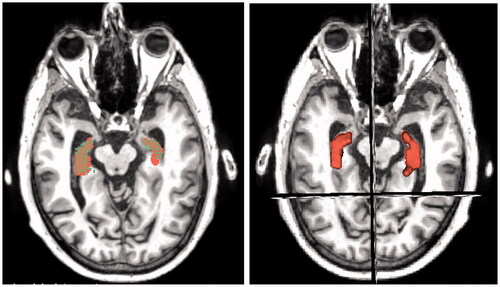
Figure 12. Distance measuring using the Ruler Function.
Control brain
After importing the DICOM data into Slicer 4.10.2, they were adjusted for contrast to have clearer lines and borders between the brain tissues. This would make them easier to segment and to compare the resulting 3D representation against the MRI scans in later stages.
The next step was segmentation. This was done with the Paint Effect tool (Pinter et al., Citation2019) also using Threshold function in Editor module. This allowed the user to select voxels within a certain threshold and to highlight the desired structure, in this case the hippocampus. With the Paint Effect tool, the user needs to click and drag on the area the MRI slice in which of the voxels are to be marked, as shown in .
In the next step, the marked structure on the separate slices got converted into 3D representation (). The 3D volume representation was brought up in the viewport in the top right window. Seeing the three directions of crosscuts and the 3D representations allowed the user to see the placement of the 3D hippocampus on the MRI slices. This was useful in checking whether the segmentation from the scans was correct. If the 3D representation had a floating disconnected piece, it was assumed it was accidentally marked on the scan. Comparing the 3D volume and the cross-sections can be seen in .
Measurements of the distance of hippocampus from the superficial surface of grey matter were taken within the software. These measurements were used to double-check the placement of the hippocampus in the right location in the 3D digital models in later stages. The process of measuring the distances of hippocampus to grey matter from raw MRI data is illustrated in . The measurements for the healthy brain can be seen in Appendix Table A1. The measurements were taken in altimeters and are accounted for human error of ±0.05.
AD brain
The AD brain underwent the same process of data segmentation as the healthy brain except for an extra step which double-checks the accuracy of the segmented hippocampus. This step is described at a later stage of this section. First, the MRI scans of the brain were imported into Slicer 4.10.2 in the form of DICOM data. The raw data were adjusted for higher contrast to make borders between structures more visible.
Similarly, to the healthy brain, the Paint Effect tool was used to segment the hippocampus.
In addition to the Paint Effect tool, the Segment Editor tool was used to make a segmentation of the hippocampus. This tool automatically fills the space in the chosen threshold without the user having to paint it in the wanted area. The second segmentation is shown in below in dim green, which is the default colour for this tool in the software, unless the user specifically chooses another colour.
Because the atrophied hippocampus has an abnormal shape, there was a higher chance of creating an incorrect segmentation by using just one method. Therefore, the next step was to overlay the two different segmentations. The overlap of the two different segmentations was considered the most accurate representation of the hippocampus to be used for 3D digital model. This can be seen in .
The 3D volume representations made with both types of segmentations were shown in viewport and were also compared against the MRI scans from axial, sagittal, and coronal views (). The viewport allows to compare the 3D representation from highlighted areas to the MRI slices. The scans show the highlighted areas in 2D view. This double-checking of data with 3D and 2D was done also in the healthy brain.
Next, the measurements were taken using the Ruler function and placing pins that measure exact distance between each other (). The table of measurements of the distances from the hippocampal part closest to the superficial part of the grey matter for the AD brain can be found in .
Table 2. Summary of the advantages, disadvantages, and hypothesis of 3D digital and 3D physical models.
Production stage 1
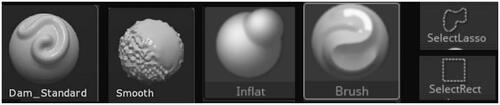
The production stage of the digital 3D models was carried out in Z-Brush 2020.1.1 (Citation2020; https://pixologic.com/; Pixologic, Citation2020). First, the 3D models created in Slicer 4.10.2 were imported into Z-Brush 2020.1.1 as separate STL models, one containing the hippocampus for healthy brain and one containing the atrophied hippocampus. Different types of brushes were used to adjust the 3D models. This consisted of smoothing bumps and filling holes on the hippocampus models, which were created by incorrectly marking the MRI for segmentation in Slicer 4.10.2. These imperfections are common and can be corrected in 3D modelling software, such as Z-Brush 2020.1.1, a powerful software that was available to the author at the time of this project. First, the CloseHoles function was used. This function automatically closes mesh where polygons are missing. However, in cases where the holes were perceived as an intended topology by the software, the holes were not closed, and this needed to be done manually. The following brushes were used: the Standard brush was used for filling small holes on the surface. The Smooth brush was used to smooth out small bumps on the surface. This was done with larger size of the brush and small strength to avoid altering the general shape. The Inflat brush was used to fill in bigger holes in the surface since it inflates the mesh. Add Clay function was used to add a small ball of clay to bridge different parts of the mesh, specifically in the atrophied hippocampus. The Lasso and Select Rect tools were used to select and remove floating particles around the hippocampus as they were accidentally selected parts of the white matter in 3D Slicer. Dynamesh was used to increase the resolution of the topology of the models and by that increase the detail of the surface, to make the hippocampi models more accurate and less angular. The icons of the used tools are in .
Figure 13. The icons of the tools used in Z-Brush 2020.1.1.
Control brain
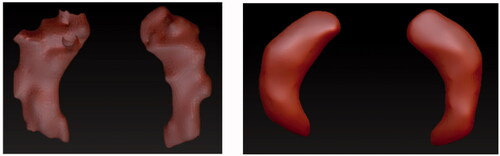
The brushes used to adjust the hippocampus of healthy brain were Smooth brush, Inflat brush, Lasso Tool, CloseHoles, and Dynamesh functions. The comparison between the STL model directly imported from Slicer 4.10.2 and the corrected model in Z-Brush 2020.1.1 can be seen in .
Figure 14. Fixing model imperfections of segmented data of the control brain. Images show the models before (left) and after (right) the processing in the healthy hippocampus.
AD brain
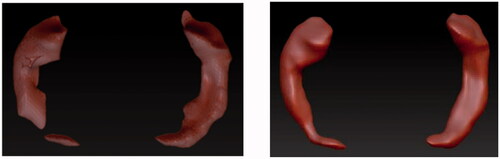
The hippocampus of the atrophied brain was more difficult to correct as its structure was atypical. Parts of the atrophied hippocampus appeared to be separate objects, as seen in , left image on the right hippocampus. It was assumed that the MRI slices in Slicer 4.10.2 were marked incorrectly because of how thin the hippocampus was in that part. In this case, the Standard Brush and AddClay were used to connect these two pieces to create one model of the left hippocampus. Other tools that were used in addition were the Smooth brush, Inflat brush, CloseHoles and Dynamesh functions, and Lasso Tool.
Figure 15. Fixing model imperfections of segmented data of the AD brain. Images show the models before (left) and after (right) the processing in the atrophied hippocampus.
Production stage 2
Hippocampus
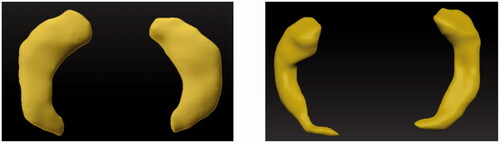
Once the 3D meshes were corrected, the second part of production was to create UW maps, also known as giving the meshes surface textures. This consisted of PolyPainting the mesh, an action of digitally painting the surface. Yellow colour was used to make the hippocampi stand out from the model once it would be embedded within the grey matter. In addition to colour, the Skinshade4 material was applied to the hippocampi. This material allowed nicer reflection of the light without having reflections that were too bright to lose detail or too matt to hide the uneven surface of the PolyPainted hippocampi. The finished models can be seen in .
Figure 16. The PolyPainted 3D models to be exported into the digital model. The healthy hippocampus (left) and the atrophied AD hippocampus (right).
Grey matter
The grey matter was already segmented for both brains and provided in the STL format as 3D digital models. Each of the grey matter models was imported into Z-Brush 2020.1.1 into the same workspace as its respective hippocampus. The grey matter model was Z-Remeshed to correct the polygonal flow, also known as topology, of the 3D model. Correct topology was necessary because the materials and textures that were applied to the model were affected by the topology. The material of the grey matter models was changed to SkinShade4 because of its desirable reflective properties and then its colour was changed to white. The Best Preview Render (BRP) was activated, and the Transparency set to 40, which made the grey matter model more transparent making the hippocampus visible, while the grey matter stayed visible enough to give spatial context. Using the measurements from Slicer 4.10.2, hippocampus was placed inside of the grey matter. These models were then exported using Decimation Master in OBJ format from Z-Brush 2020.1.1 to an online platform Sketchfab. These steps can be seen in .
Figure 17. Texturing of the mesh (left) and rendering of the BRP of the model (right).
If the grey matter was not provided as a separate 3D model, the process described for hippocampus segmentation would have been used (Paint Effect or the Segment Editor tool) to get the 3D digital models of the grey matter. Slicer 4.10.2 allows to segment several structures in one file as separate objects, which means that if they are exported together, their placement in relation to each other will be correct and exact.
Post-processing
The 3D digital models were uploaded to Sketchfab (https://sketchfab.com), where they underwent post-processing. Sketchfab was chosen to host the 3D digital models as the interactive online platform was created specifically to showcase 3D digital models. It also allows post-processing by adding labels with descriptions to specific parts of the model. Furthermore, the users of Sketchfab can rotate the 3D model and explore it by looking at it from different angles or zooming in and out. Visiting the platform is free and even a free publishing Sketchfab licence allows adding a limited number of labels with descriptions. In this case, the paid account belonging to the Centre for Anatomy and Human Identification (University of Dundee) was used for the models to be uploaded and an unlimited number of labels could be added to the 3D models according to the need of the author.
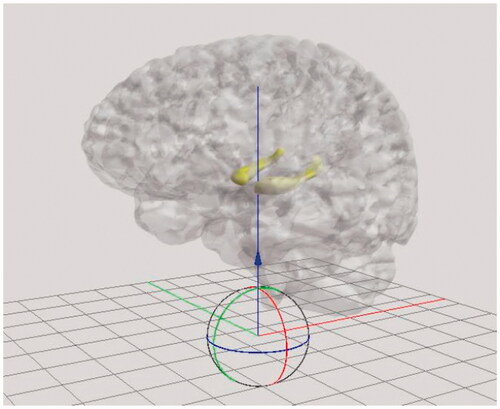
The corrected and textured models from Z-Brush 2020.1.1 consisted of two sub-tools which were exported using DeciMaster ZPlugin in the OBJ format. The post-processing of the digital models begun after being imported into Sketchfab, where they were labelled, and lights, materials and camera angles were adjusted. The entire model was adjusted for sharpness. This means that the brain fissures were more visible in the grey matter model. The model was repositioned into an upright position, as seen in , which shows a just imported 3D digital model.
Figure 18. Adjusting position of the brain in Sketchfab.
The lightning and shadow strength were adjusted. The two sub-tools were paired with their respective UV maps from Z-Brush 2020.1.1. The grey matter was adjusted for opacity, to show the outer structure of the brain, mainly the fissures and hemispheres. It was transparent enough to show the correct position of the hippocampus. The ‘Metalness’ feature was added to the grey matter in 3D Editor, to make the grey matter appear more glass-like and shiny. The hippocampus was clearly visible inside the grey matter where the bright yellow colour helped it to stand out. The environment was changed to black () to increase contrast between the 3D model and the surrounding area, helping to focus the attention on the brain.
Figure 19. Increasing the contrast between the model and the environment in Sketchfab.

In addition to adjusting the appearance of the model, the post-processing included adding annotations of the brain describing their function. Furthermore, this also involved positioning of the camera within Sketchfab, so that when the user clicked on the note button, it showed them a view that was best displaying the desired anatomy.
Results
The 3D digital models were published as ‘Private’ models so they could be accessed only with a specific URL links and were not available to the public. This was done to further protect the patient specific data. The models can be accessed at the following URL:
Healthy: https://sketchfab.com/3d-models/control-brain-transparency-82c44c7e6f5643e48662dce057856158
shows the final uploaded models from different views:
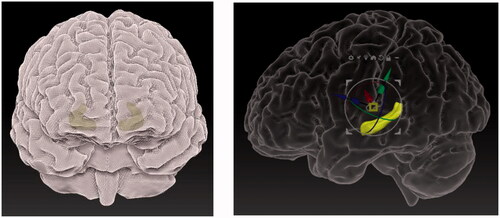
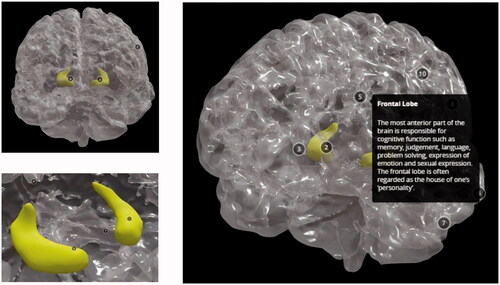
Figure 20. The finished 3D digital model: front view of the healthy brain (top left), view of the healthy hippocampus with camera view placed inside (bottom left), view of the entire 3D digital model with description of the frontal lobe (right).
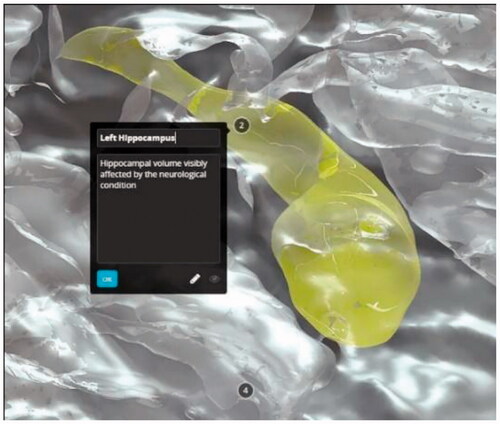
shows how the 3D digital models can be zoomed in and adjusted on a specific view. The notes can be clicked to show the name and a description of the anatomical structure.
Figure 21. Clicking on the left hippocampus to see an annotation of the anatomical region.
Discussion
The creation of anatomically correct 3D digital models of brains used a multi-stage approach. The process of segmenting data in 3D Slicer 4.10.2 had high accuracy as they were based on specific MRI datasets.
An overall advantage was obtainability of the 3D digital patient-specific models. The software used were open-source or could be replaced with open-source software, making it cost-effective process. 3D Slicer 4.10.2 is a free segmentation software, Z-Brush 2020.1.1. can be replaced with open-source 3D modelling software, such as Blender 2.8 (https://www.blender.org; Community Citation2018), which also supports digital sculpting with similar tools as Z-Brush 202.1.1. Sketchfab offers a free uploading licence with fewer annotation options. The software was not difficult to use, but some degree of familiarity was required for segmentation, correction, post-processing, importing, and exporting the correct formats between platforms. This project was time-effective since it was done by a researcher familiar with technology and software used. The process can be easily learned by following the steps described in this paper.
The 3D digital models uploaded to Sketchfab were available and ready to use on devices connected to the internet, such as laptops and tablets. Phones are not recommended because of their smaller screen size making it difficult to explore the models. When internet is not available, the 3D models uploaded to the online platform would not be available. An alternative to counteract the online unavailability of Sketchfab would be downloading the 3D models into an offline application where they can be always accessed.
Further use
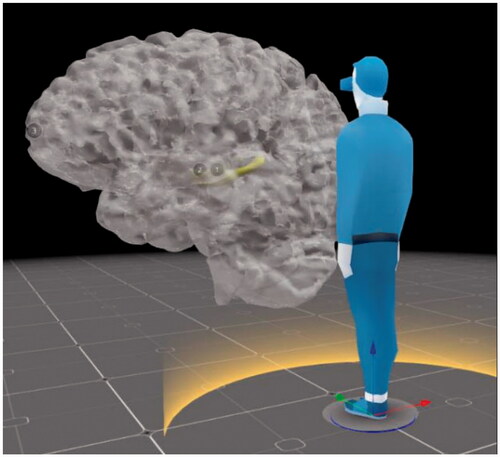
Further benefits of creating 3D digital models are that they can be transformed into different modalities. These can be 3D physical models through 3D printing or creating 3D physical models with resin and other materials. 3D digital models can also be delivered in different digital formats, such as VR and AR. The VR option is already available on Sketchfab, where the user can interact with the model by rotating, zooming, reading the descriptions with specifically marked anatomy, and being able to alter them digitally according to their need. Using 3D digital models in VR also allows the viewer to look at the models in whatever size they desire. This means that their size can be increased to be larger than life () while maintaining the accuracy of their anatomical structure and closely examining the details. Overall, creating a 3D patient-specific 3D digital model is useful on its own, however it can also serve as the initial building block for delivery in other modalities.
Figure 22. What a model would look like in VR setting with increased size in Sketchfab, compared to an adult viewer.
Conclusion
The aim of this paper was to present a detailed workflow of creating 3D digital models from raw patient data that can be further used in education. This method is intended to add to the advancements in technology which help teaching anatomy through websites, animations, and 3D models. The creation of 3D digital models consisted of data segmentation, 3D digital model clean-up, uploading to an interactive website, and post-processing the resulting 3D models. Ways to make the process cost and time-effective were suggested by using open-source software tools. We also focussed on the advantages and limitations of the cross-platform method.
The limitations were mainly attributed to human-error while processing the data. These involved manual data segmentation from MRI scans, hippocampus placement, and changing the structure of the hippocampus when correcting topology of the 3D model. We would like to acknowledge that 3D digital models may not be suitable for patient who are kinaesthetic learners. In addition, a person skilled with technology may be needed to show an AD patient how to navigate Sketchfab.
In the future, the creation of the 3D digital models should involve more detailed work in the segmentation, 3D-modelling software, and post- processing to improve accuracy and appearance of models. This could be helpful in making some of the landmarks in the brain more visible, for example, the Sylvian Fissure and Central Sulcus. The properties of textures should be studied more, for example, only the ‘Roughness’ slider should be adjusted for the shiny appearance.
Its advantages, which outweigh the limitations, are mainly due to time and cost-effectiveness of creating the accurate models and its availability to its users. In addition, creation of accurate 3D digital models can be further used to create 3D physical models, allowing creation of several modalities from the same dataset.
The workflow described in this paper yielded 3D interactive digital models which could help present patient specific data in a less abstract and more understandable way. These could be then used in education of medical students, patients, and the public. Overall, the method described is believed to add educational resources and future access of high-quality visual tools through 3D digital medical models ().
Disclosure statement
No potential conflict of interest was reported by the authors.
Data availability statement
The data that form the basis of this project were obtained from medical databases Open Access Series of Brain Imaging Studies, OASIS (Citation2020), (http://oasis-brains.org) for healthy brains and Alzheimer’s Disease Neuroimaging Initiative, ADNI (Citation2020), (http://adni.loni.usc.edu/) for the brain affected by Alzheimer’s Disease. Patient MRI datasets have been anonymised.
Correction Statement
This article was originally published with errors, which have now been corrected in the online version. Please see Correction (http://dx.doi.org/10.1080/17453054.2022.2069714)
Additional information
Funding
References
- Adni.loni.usc.edu. 2020. ADNI | Alzheimer's disease neuroimaging initiative [online]. Retrieved from http://adni.Ioni.edu/ [Accessed 15 July 2020].
- Alzheimer's Disease and Dementia. 2020. What is dementia? [online]. Retrieved from: https://www.alz.org/alzheimers-dementia/what-is-dementia. [Accessed 18 June 2020].
- Amorim, P., de Moraes, T. F., Pedrini, H., & Silva, J. (2015). InVesalius: An interactive rendering framework for health care support. doi:https://doi.org/10.1007/978-3-319-27857-5_5
- Community, B.O. (2018). Blender - a 3D modelling and rendering package. Amsterdam: Stichting Blender Foundation.
- Fernandez, A. 2019, Glass hearts (Master of Science, University of Dundee, Dundee).
- Fredieu, J., Kerbo, J., Herron, M., Klatte, R., & Cooke, M. 2015. Anatomical models: A digital revolution. Medical Science Educator, 25(2), 183–194. doi:https://doi.org/10.1007/s40670-015-0115-9
- Hoyek, N., Collet, C., Di Rienzo, F., De Almeida, M., & Guillot, A. (2014). Effectiveness of three-dimensional digital animation in teaching human anatomy in an authentic classroom context. Anatomical Sciences Education, 7, 430–437. doi:https://doi.org/10.1002/ase.1446.
- Oasis-brains.org. 2020. OASIS brains – open access series of imaging studies [online]. Retrieved from https://www.oasis-brains.org/ [Accessed 15 July 2020].
- Pinter, C., Lasso, A., & Fichtinger, G. (2019). Polymorph segmentation representation for medical image computing. Computer Methods and Programs in Biomedicine, 171, 19–26. doi:https://doi.org/10.1016/j.cmpb.2019.02.011
- Pixologic. 2020. Z-Brsh 2020.1.1 [Computer sotware]. https://pixologic.com/
- Pokojna, H. 2020. Transparent minds: Testing for efficiency of transparency in 3D physical and 3D digital models (Master of Science, University of Dundee).
- Pujol, S., Baldwin, M., Nassiri, J., Kikinis, R., & Shaffer, K. (2016). Using 3D modeling techniques to enhance teaching of difficult anatomical concepts. Academic Radiology, 23, 507–516. doi:https://doi.org/10.1016/j.acra.2015.12.012
- Rosa, B., Correia, M., Zidde, D., Thuler, L., Brito, A. and Biolchini, J., 2019. Learning hepatobiliary anatomy through the virtual 3D anatomy table. Revista Brasileira de Educação Médica, 43(suppl 1), 615–622.
- Sketchfab. 2020. [online platform for 3D models]. https://sketchfab.com/
- 3D Slicer. 2020. Version 4.10.2 [Computer software]. https://www.slicer.org/
- Triepels, C., Smeets, C., Notten, K., Kruitwagen, R., Futterer, J., Vergeldt, T., & Van Kuijk, S. (2020). Does three-dimensional anatomy improve student understanding? Clinical Anatomy, 33, 25–33. doi:https://doi.org/10.1002/ca.23405
- van der Steen, J. T., Onwuteaka-Philipsen, B. D., Knol, D. L., Ribbe, M. W., & Deliens, L. (2013). Caregivers’ understanding of dementia predicts patients’ comfort at death: A prospective observational study. BMC Medicine, 11(1), article 105. Available at:: https://doi.org/https://doi.org/10.1186/1741-7015-11-105 [Accessed 17 June 2020].
- Yang, T., Tan, T., Yang, J., Pan, J., Hu, C., Li, J., & Zou, Y. (2018). The impact of using three-dimensional printed liver models for patient education. Journal of Internal Medicine Research, 46, 1570–1578. doi:https://doi.org/10.1177/0300060518755267
Appendix
Measurements of the distances between hippocampus and the superficial surfaces of the brain.
Table A1. Control brain.
Table A2. AD brain.