
ABSTRACT
Achieving homogenised and stable suspensions has been one of the important research topics in nanofluid investigations. Preparing nanofluids, especially from the two-step method, is often accompanied with varying degrees of agglomerations depending on some parameters. These parameters include the physical structure of the nanoparticle, the prevalent particle charge, the strength of van der Waals forces of attraction and repulsiveness strength. Amongst the methods of deagglomeration, the use of ultrasonic vibration is most popular for achieving uniform dispersion. However, there are very few works related to its effect on the thermo-physical properties of nanofluids, and above all, standardising the minimum required ultrasonication time/energy for nanofluids synthesis. In this work, the optimum energy required for uniform and initially stable nanofluid has been investigated through experimental study on the combined influence of ultrasonication time/energy, nanoparticle size, volume fraction and temperature on the viscosity of alumina–glycerol nanofluids. Three different sizes of alumina nanoparticles were synthesised with glycerol using ultrasonication-assisted two-step approach. The viscosities of the nanofluid samples were measured between temperatures of 20–70 °C for volume fractions up to 5%. Based on the present experimental results, the viscosity characteristics of the nanofluid samples were dependent on particle size, volume fraction and working temperature. Using viscometry, the optimum energy density required for preparing homogenous nanofluid was obtained for all particle sizes and volume fractions. Finally, an energy density model was derived using dimensionless analysis based on the consideration of nanoparticle binding/interaction energy in base fluid, particle size, volume fraction, temperature and other base fluid properties. The model's empirical constants were obtained using nonlinear regression based on the present experimental data.
1. Introduction
Nanofluids are fluids with modified heat transfer characteristics which are produced from the suspension of ultrafine particles (nanoparticles) with the conventional heat transfer fluids (base fluids) to form homogenised liquid-particle matrix. Clearly, the traditional heat transfer fluids with their inherent poor thermal conductivity and heat capacity cannot handle the present thermal load from the miniaturised, compact, high-capacity and high-energy density devices. On the other hand, the prominent traditional approach, which is the use of extended surfaces, cannot be used because this approach increases the size of equipment (weight and bulkiness). Besides, this method does not support the new design philosophy for attaining global energy sustainability. Reports of experimental investigations on nanofluids’ heat transport properties show that nanofluids have promising potential in handling the new age thermal management challenges. For example, by adding and homogenising nanoparticles of Cu and carbon nanotubes (CNTs) in ethylene glycol (EG) and oil, Eastman et al. [Citation1] and Choi et al. [Citation2] showed that the thermal transport property can be enhanced up to 40% and 160%, respectively, at 1% volume fraction. Pastoriza-Gallego et al. [Citation3] investigated the thermal conductivity of Al2O3–EG and observed that an enhancement of 19% was obtainable at 8.6% volume fraction. Their results also agreed with the work of Timofeeva et al.[Citation4] It should, however, be noted that there are still very few standards established in nanofluids research and the field is still laden with contradictory reports/results on experimental and theoretical predictions. For instance, comparing the work of Amrollahi et al. [Citation5] with the previous work by Liu et al. [Citation6] on CNTs in EG, there exists a notable difference in the enhancement values reported even at the same volume fraction. This difference could be as a result of difference in the method of synthesis of their nanofluids amongst other parameters. Amrollahi et al. [Citation5] used ultrasonication to disperse CNTs up to 24 hours, while Liu et al. [Citation6] used a combination of both magnetic stirrer and ultrasonication without mentioning the equipment settings, sample volume, process time or energy density involved. A similar report was given by Murshed et al. [Citation7] with the observed difference in their experimental data when compared with the work of Wang et al.[Citation8]
Presently, there are only two approaches to the preparation of nanofluids which are the single-step and two-step approaches.[Citation9] Very essential in the synthesis of nanofluids is the techniques to ensure a stable homogenisation. For two-step approach, there are different dispersion assist mechanisms available. Therefore, standardisation of the method of preparation of individual nanofluid as it was captured in the recent review of Ghadimi et al. [Citation10] becomes very crucial. Hwang et al. [Citation11] reported that high-pressure homogeniser gave better performance amongst other physical deagglomeration techniques. The fact is that the results of ultrasonic characterisation presented by Hwang et al. [Citation11] were close to that obtained from high-pressure homogenisation even at 1-hour sonication time. On the other hand, the size of nanoparticles in suspension after preparation as presented by Fedele et al. [Citation12] shows that ultrasonication is more efficient in clusters deagglomeration. This suggests that the variation of the dispersion parameters in ultrasonic vibration method (such as time, amplitude and pulse–pulse intensity) is important in enhancing deagglomeration. Some researchers have shown that ultrasonication probe plays key role in aggregates deagglomeration.[Citation13,Citation14] Amrollahi et al. [Citation14] experimentally showed that optimising the ultrasonication parameters such as time/energy is key to stable suspension. Furthermore, the present most easily accessible and effective two-step assist mechanism is the use of ultrasonic vibration, in which case researchers have mostly chosen an arbitrary value of time when preparing their nanofluids.[Citation15–20]
Considering the works already done to characterise the effects of ultrasonication time/energy on the uniform homogenisation and stability of nanofluids, many were carried out to study its effect on thermal conductivity [Citation21–24] and very few centred on its effects on viscosity.[Citation25] Garg et al. [Citation25] studied the effect of different ultrasonication times on viscosity and heat transfer performance of multi-wall carbon nanotube nanofluids. Agglomeration which could occur as a result of wide size distribution, inelastic collision of particles during Brownian motion, poor physical deagglomeration methods during synthesis or lack of optimisation of the apparently appropriate techniques, increases the viscosity of nanofluids. Wide size distribution is seldom controllable especially when nanoparticles are procured. Inelastic collision, on the other hand, can be minimised either by steric or electrostatic repulsion [Citation26] which ultimately prevents agglomeration. Optimisation of the ultrasonication time/energy ensures stable homogenisation by reducing the agglomerates to the smallest size possible [Citation13] thereby lessening the effect of gravitational pull to the minimum.
In the present work, the optimum energy density required for the preparation of homogenous nanofluids has been studied by investigating the influence of ultrasonication, nanoparticle size, volume fraction and temperature on the viscosity of Al2O3–glycerol nanofluids. The viscosity data are used to determine the consistence of the nanoparticle dispersion based on the methodology proposed by Song and Youn.[Citation27] To the best of authors' knowledge, this is the first work that combines these four parameters for Al2O3–glycerol nanofluids. Finally, an empirical correlation is developed based on non-dimensional analysis in order to predict the required ultrasonication energy density for preparation of alumina–glycerol nanofluids.
2. Materials and methods
2.1. Materials
The three different sizes of alumina nanoparticles used in this work were procured from three different companies: Nano Amorphous Inc. (20–30 nm (γ-Al2O3), MK Nano (80 nm α-Al2O3) and US Nanomaterials Inc. (100 nm α-Al2O3). gives the physical properties of the nanoparticles. Glycerol was procured from Merck Millipore (Germany), with 99.5% purity. All materials in the present work were of analytical grade and used as received without the addition of surfactant or surface active agent.
Table 1. Physical properties of alumina nanoparticles.
2.2. Equipment
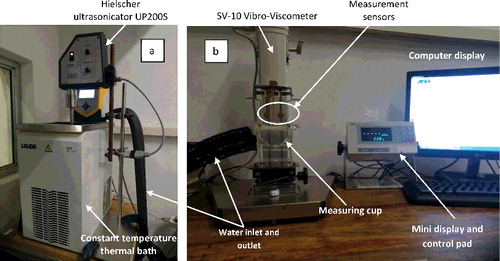
The temperature regime for the measurements was achieved using a programmable constant temperature thermal bath (LAUDA ECO RE1225 Silver). The bath was programmed with a ramp function to achieve a relatively uniform and steady control of the temperature of samples throughout the experiments. A digital Highland HCB1002 (max: 1000 g and precision: 0.01 g) weighing balance was used to measure the mass of the samples during preparation. Ultrasonic vibration was achieved with a 200 W, 24 kHz Hielscher ultrasonic processor (UP200S). Finally, the viscometry was accomplished using a constant shear rate vibro-viscometer (SV-10) from A&D, Japan. shows the experimental setup.
Figure 1. Experimental set-up (a) constant temperature thermal bath with ultrasonication device in use and (b) viscometer set-up.
2.3. Nanoparticle characterisation and nanofluid synthesis
Samples for transmission electron microscope (TEM) characterisation were prepared by dispersing 0.1% volume fraction of each nanoparticle type in acetone so that rapid drying method could be employed for the captures.[Citation28] Heavier base fluids such as glycerol, ethylene glycol, propylene glycol and engine oil cannot be used for this purpose because they will cause irreparable damage to the TEM vacuum column. Therefore, the nanoparticles were sonicated for 5 min in acetone and were characterised using the JEOL JEM-2100F microscope operated at 20 KV, to determine the morphology of the nanoparticles used. An XPERT-PRO diffractometer (PANalytical BV, The Netherlands) with theta/theta geometry, operating a cobalt tube (λ = 0.1789 nm) at 35 kV and 50 mA was used to obtain the X-ray diffraction (XRD) pattern. The XRD patterns of all the alumina nanoparticle samples were recorded in 10°–90° range (2 theta position) with a scanning step size of 0.001° and a counting time of 12.705 s per step. The nanofluid samples were also characterised using the UV–visible spectrophotometer (Model 7315, Jenway Scientific Equipment, UK) and Zetasizer Nano ZS (Malvern Instrument, UK) to measure the absorbance of the nanofluid, zeta potential and in situ nanoparticle size in glycerol.
In order to synthesise the nanofluid samples used in this work, the well-known two-step technique was applied.[Citation9] The volume fraction (φ) of the nanoparticles was determined by calculating the equivalent mass of nanoparticles, using the mass of the base fluid and the densities of both nanoparticles and base fluid as follows:
(1) where φ, m and ρ are the volume fraction, mass and density, respectively. The dispersion of the Al2O3 nanoparticles was accompanied by direct method of ultrasonication [Citation29] using ultra-intensity sonication probe device (Hielscher ultrasonic processor, UP200S). The nanoparticles of known weight were initially mixed with the base fluid using manual stirring so that ultrasonic force does not splatter the nanoparticle materials around. The sample is placed in a sample holder in the constant temperature thermal bath which is kept at a temperature of 15 °C. This is necessary to ensure that the high temperature due to the ultrasonic vibration does not affect the sample state vis à vis change in the volume of the sample and sample degradation. In the present experiment, the ultrasonication was carried out in a 100-mL beaker using a 12-mm (S14) stainless steel sonotrode, the amplitude of ultrasonication was set at 75% and the pulse–pulse setting was set at 0.8 s (i.e. 0.8 s continuous sonication and 0.2 s sonication static). The pulsed operation mode has been suggested as part of the dispersion guidelines [Citation29] in order to effectively control the dispersion temperature in addition to use constant temperature thermal bath. Based on the above-mentioned settings, the energy density applied to the ultrasonication process was between 5.0 × 10⁶ and 4.0 × 10⁷ kJ/m3, which was calculated based on the maximum power delivered by the ultrasonicator and the period in which the sonication was carried out. A brief description on how the ultrasonication process does the breaking down of nanoparticle agglomerates in suspension is given in Section 3.7.
2.4. Viscometry
The viscometer (SV-10 vibro-viscometer) uses the turning fork vibration method at a constant resonating frequency of 30 Hz to determine the resistance to flow of the fluid sample, based on power differentials that maintain the resonating frequency. The viscometer measures in the range of 0.3–10,000 mPa.s with 5% uncertainty at full range and 1% repeatability error, if measurements are made under the same experimental condition. This has been previously confirmed by Ghadimi and Metselaar [Citation30] and Lee et al.[Citation31] The temperature of the samples at the measurement site was controlled employing a water jacket measuring cup connected to the programmable thermal bath. The two vibrating forks keep the temperature at the measurement site uniform and this is monitored with a temperature probe affixed equidistance in between the two forks. The viscometer was calibrated using glycerol of known viscosity at 20 °C, and the viscosity data were measured in the temperature range of 20–70 °C.
3. Results and discussion
3.1. Nanoparticle and nanofluid characterisation
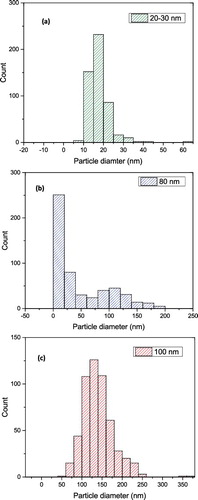
shows the TEM images of Al2O3 nanoparticle samples for 20–30, 80 and 100 nm. a) shows that the nanoparticles are spherical and have a narrow size distribution and representative of manufacturer's quoted size as shown in a). In b), the 80-nm alumina nanoparticles show a wide size distribution which some particles are bigger as well as many smaller than the manufacturer's quoted value. The size analysis in b) accentuates the observation as presented in b). However, in c), the 100-nm alumina nanoparticles are within the manufacturer's specified value with the majority of the particle size at around 130 nm.
Figure 2. TEM image of Al2O3: (a) 20–30 nm, (b) 80 nm, (c) 100 nm.
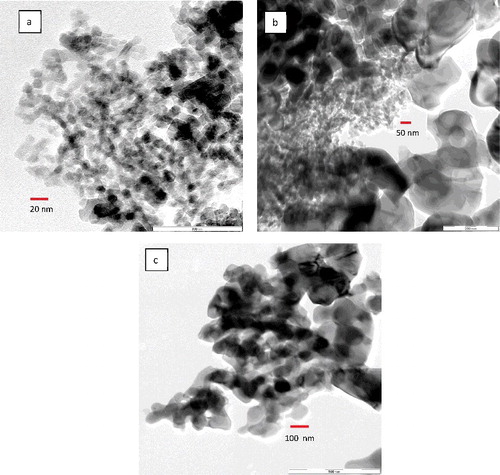
Figure 3. Size distribution of Al2O3 nanoparticles: (a) 20–30 nm, (b) 80 nm, (c) 100 nm.
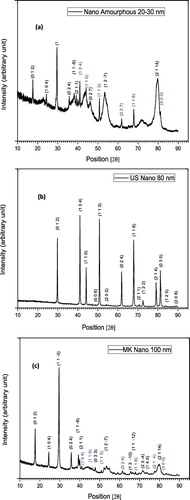
depicts the XRD patterns of all the alumina nanoparticles used in the present work. For the 20–30 nm particles (a)), the pattern peaks correspond to corundum (Al2O3) and millosevichite (Al2[SO4]3) with joint committee on powder diffraction standards (JCPDS) file number 01-083-2080 and 01-077-0385, respectively. The 80-nm particle (b)) pattern peaks correspond to corundum only with JCPDS file number 90-008-8029. The JCPDS file numbers for the 100-nm particle (c)) are 01-081-2267 and 01-077-0066 corresponding to corundum and millosevichite, respectively.
Figure 4. X-ray diffraction pattern for Al2O3 nanoparticles: (a) 20–30 nm, (b) 80 nm, (c) 100 nm. The black font represents corundum and the blue font represents millosevichite.
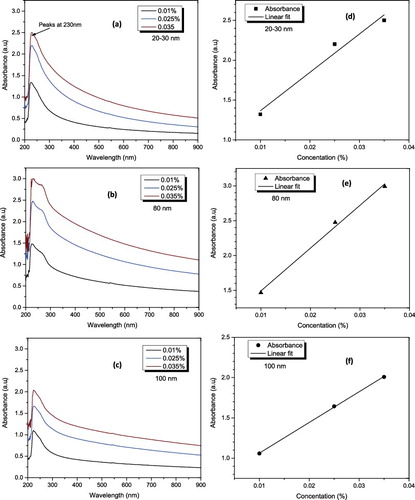
The UV–visible spectrophotometry analyses of the Al2O3–glycerol nanofluids were carried out at volume fraction 0.01%–0.035% and the spectra results are presented in . Low volume fractions were chosen for the UV–visible experiment because at a higher volume fraction the spectrophotometer returns NaNs (i.e. beyond the equipment's range). The UV–visible analysis is one of the convenient ways to characterise the dispersion of nanofluid. Using the Beer–Lambert law (EquationEquation 2(2) ), the light absorbency ratio index of the nanofluid can be calculated as follows:
(2) In EquationEquation (2)
(2) , ϵ is the molar absorptivity, l is the optical path which is the length of test section light passes through,
is the concentration of the particles in suspension, A is the absorbance, Io is the intensity of the UV–visible light through the blank and I is the intensity of the UV–visible light through the samples. Concerning EquationEquation (2)
(2) , it can mention that for a fixed optical path length and molar absorptivity, the absorbency of a suspension is proportional to the concentration of the particles in the suspension. Therefore, a well-dispersed suspension shows a proportional relationship between the absorbance and concentration.[Citation32] Presented in a)–(c) are the UV–visible spectra of Al2O3–glycerol nanofluids for different concentrations. The spectra pattern of the nanofluid presented a strong absorption band at around 230 nm wavelength, after which the spectra pattern decreased in a monotonic manner with increasing scanning wavelength. The spectra pattern and the strongest peak wavelength correspond to the results previously presented by Piriyawong et al. [Citation33] on Al2O3 dispersed in deionised water. d)–(f) confirms that the dispersion follows the Beer's law (i.e. the absorbance increases as the nanoparticle concentration increases).
Figure 5. UV–visible spectra analysis of Al2O3–glycerol nanofluid (a, b and c) spectra pattern at different volume fractions and wavelengths for 20–30, 80 and 100 nm, respectively, and (d, e and f) absorbance of Al2O3 in glycerol at different concentrations and 230 nm wavelength for 20–30, 80 and 100 nm, respectively.
Using the method of dynamic light scattering (DLS) in the Zetasizer Nano ZS device, the in situ particle size of the Al2O3 was measured in the glycerol. The results presented in a)–(c) show that Al2O3 sizes are 59.6, 128.7 and 118 nm instead of 20–30, 80 and 100 nm, respectively. The zeta potential characterisation of the samples (which shows the level of nanofluids stability) is presented in . It should be noted that the volume fraction of the samples used for both DLS and zeta potential measurement is 0.05% because at higher volume fraction the results may not be reliable.
Figure 6. In situ nanoparticle size distribution in glycerol base fluid using DLS technique: (a) 20–30 nm, (b) 80 nm, (c) 100 nm.
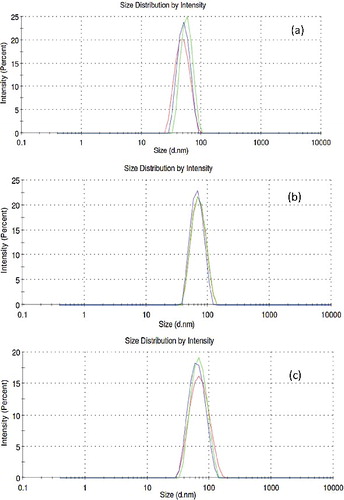
Table 2. pH and zeta potential values for the Al2O3–glycerol nanofluids at 20 °C.
3.2. Experimental validation and uncertainty analyses
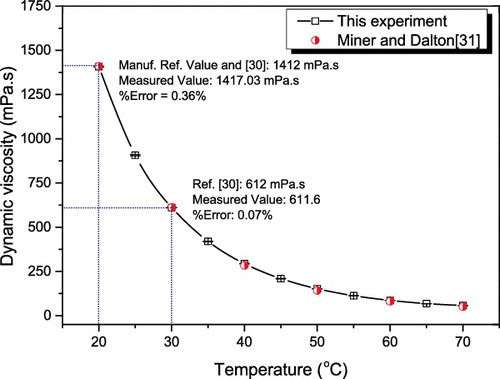
represents the result of base fluid viscosity measurement after the viscometer calibration. The measured data were compared with the manufacturer's and Oberstar and Segur’s [Citation34] reference values at 20 and 30 °C, which shows less than 1% deviation. Further comparison with Miner and Dalton [Citation35] over the temperature range of our investigations shows good agreement.
Figure 7. Comparison of measured viscosity values of glycerol with available data. The horizontal bar shown on the experimental data point represents the standard deviation of the experimental values.
The measurement errors relating to the variables in the preparation, temperature and viscosity measurements constitute the uncertainty in this work. The weighing balance measures in the range of 0.3–70 g with ±0.01 g accuracy. The accuracy of the viscometer and the built-in thermocouple within the measurement range is ±5% and ±2 °C, respectively. The uncertainty of the experimental results could be calculated based on the procedure adopted by Kulkarni et al.[Citation36] using the following equation:
(3) where μ is the viscosity, T the temperature, m the mass and Δ stands for the accuracy of the device within measurement range. Substituting the relevant values, the combined uncertainty of the present experimental investigation is 6.7%.
3.3. Influence of ultrasonication
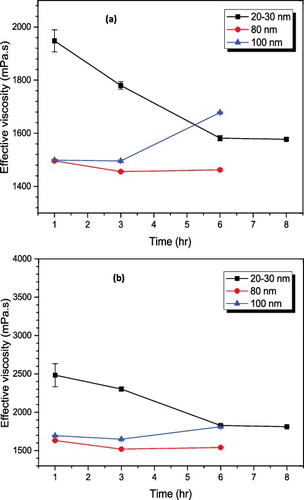
The tendency to agglomerate is very high when the nanofluids are prepared using the two-step method. At the beginning of the preparation, this tendency becomes even higher when the base fluid is highly dense and the presence of agglomerates could be seen even with the bare eyes. The use of ultrasonication probe has been proven to be effective in deagglomeration, seeing that it is not a strong bonding interaction that exists between agglomerate particles.[Citation13] According to the recent review of Meyer et al.,[Citation37] most methods used in studying both the nanofluid dispersion and stability are deficient because these methods only take very dilute volume fraction and also depend on the opacity of the nanoparticle dispersed. The volume fraction studied in this work is up to 5% of Al2O3 nanoparticles and the available DLS device takes maximum volume fraction of 0.05%. This makes it difficult to use the quantitative method of analysis (in our case) which is to measure the in situ size as ultrasonication period is changed. Since this experiment is performed on different particle sizes and all the volume fractions investigated are well higher than what the DLS device can handle, viscosity values were used to study the influence of ultrasonication on the nanofluid samples in order to determine the dispersion consistency. This will allow the determination of minimum ultrasonication energy required for proper dispersion of the nanoparticles in the base fluid.[Citation38] Good dispersion is vital to the achievement of satisfactory nanofluid stability and reduced viscosity. Increase in ultrasonication time/energy has been shown to reduce the size of agglomerates, increase in thermal conductivity and reduced viscosity as a result of uniform dispersion.[Citation24] Therefore, viscometry was used to typify the minimum ultrasonication energy density required for the preparation of the alumina–glycerol nanofluids. In , 20–30 nm particles became well dispersed in glycerol at 6-hour sonication period (corresponding to 3.0 × 10⁷ kJ/m3) and the trend was repeated for the entire volume fraction investigated on this nanoparticle. However, for the 80- and 100-nm particles, the optimised time for ultrasonication is generally around 3 hours (corresponding to 1.5 × 10⁷ kJ/m3) as prolonged ultrasonication beyond this time caused a noticeable increase in viscosity of the nanofluid samples. The prolonged ultrasonication period led to the coalescence of the particles to reform loose aggregates which allow the entrapment of fluid and causing viscosity increment. This fact has been previously reported as well.[Citation39–41] The TEM image shows that the 80-nm particles have a wide range of particle size distribution (PSD) with particles bigger and smaller than the manufacturer's stated size. Taking the average particle size as 80 nm, the reduction in viscosity of the 80-nm particles must be primarily due to the wide-range PSD.[Citation42,Citation43]
Figure 8. Effect of ultrasonication time on effective viscosity: (a) 2% volume fraction, (b) 3% volume fraction.
3.4. Influence of temperature on viscosity
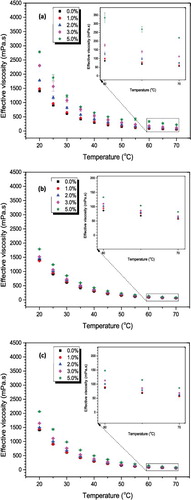
presents the effect of temperature on the viscosity of Al2O3–glycerol nanofluids with 3-hour ultrasonication time (1.5 × 10⁷ kJ/m3). All samples’ viscosity reduced exponentially with the increase in temperature which agrees with literatures for other nanofluids as well.[Citation44] The 20–30 nm particles displayed the highest resistance to flow and distinct increase in viscosity gradient along the volumetric fraction. At high temperatures (60–70 °C), the viscosity changes is less than 5% (, insets), which is mainly due to very weak intermolecular bonding caused by increased temperature. For other sonication periods, very similar trends were observed for all the samples.
Figure 9. Effect of temperature on viscosity of Al2O3–glycerol nanofluids: (a) 20–30 nm, (b) 80 nm, (c) 100 nm. Results represent the viscosity value at 3-hour ultrasonication.
3.5. Effect of Al2O3 concentration and size on the dispersion viscosity
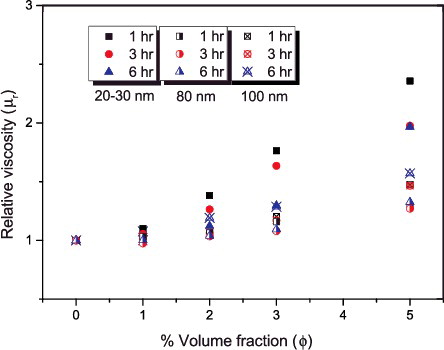
The addition of nanoparticles into base fluid and its influence on the viscosity have been previously studied.[Citation45–47] These studies have shown that, amongst other influencing parameters, the addition of particles to base fluid considerably affects the suspension viscosity. The increase in particle concentration brings about increase in suspension viscosity and the percentage increase is dependent on factors such as types of particles, base fluids and the size of particles, to mention a few. In the case of constant particle concentration in suspension, subsequent reduction in particle size increases the total number of nanoparticles present in the medium, thereby increasing the effective solid volume fraction.[Citation48] The Brownian theory also confirms that the smaller size particles may translate to increase in Brownian velocity and particle–particle interactions. This will step up the energy dissipation during the process due to the first and second electro-viscous effects that cause the increase in viscosity.[Citation49,Citation50] Therefore, in suspensions prepared with small particles, the viscosity is higher than suspensions with bigger particles.[Citation51] displays a steady increase in the relative viscosity as the volume fraction increased in all the samples of the nanofluids and the highest value was observed in the smallest particle size.
Figure 10. Relative viscosity plots showing the combined effect of particle size and increase in volume fraction at different ultrasonication periods.
3.6. Sedimentation rate
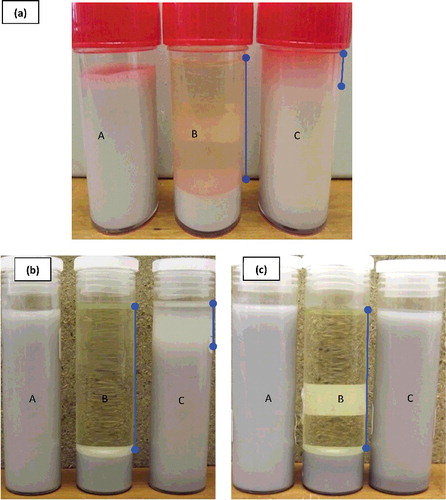
As it has been mentioned earlier that nanofluids’ uniform dispersion and kinetic stability are essential factors which will make it usable in engineering applications. Different methods have been used to stabilise nanofluids, namely steric stabilisation, electrostatic stabilisation and preparation methods. Preparation variables such as the type of assist mechanism and energy of deagglomeration are some of the basic methods of ensuring stability. In the present study, the variation of the process time/energy density on sedimentation has been qualitatively studied through observation. shows the sedimentation behaviour of the nanofluid samples at different times after preparation for different ultrasonication energy densities. Nanofluids prepared from the 80-nm nanoparticles were unstable and started showing separation few days after preparation, irrespective of the sonication energy density applied. The wide PSD could be the most probable reason for this behaviour based on the factors considered in the experiment.
Figure 11. Sedimentation rate of Al2O3–glycerol nanofluids for 5% Al2O3 concentration (a) prepared with 4.99 × 10⁶ kJ/m3, after 3 months of preparation; (b) and (c) prepared with 1.5 × 10⁷ and 3.0 × 10⁷ kJ/m3, respectively, after 12 months of preparation: (A) 20–30 nm, (B) 80 nm, (C) 100 nm.
3.7. Energy of dispersion
During the process of ultrasonication, the resultant mechanical energy from the ultrasound device is transferred into the receiving medium (nanoparticles + liquid) through ultrasound wave. This energy causes cavitation within the medium which assists to disintegrate agglomerates into individual particles via bubble implosion reaction force and the associated shearing effect created during the implosion. Aggregations of particles occur in suspension as a result of the presence of effective van der Waals force of attraction between particles compared to the force of repulsiveness. However, van der Waals influence is not solely responsible for the aggregation.[Citation52] This factor coupled with some other parameters such as temperature, volume fraction, particle size, shape, density and solvent properties. There is an energy inertial which must be overcome through the disintegration process, namely agglomerate's binding energy. Therefore, for effective dispersion to be achieved, the energy per volume delivered by ultrasonication must be higher than the binding energy of the agglomerates.
Considering the above, the non-dimensional energy density applied through ultrasonication can be written as a function of the following non-dimensional parameters (π’s):
(4) where
is the ultrasonication energy per unit volume,
is the agglomerate binding/interaction energy, V is the volume of nanofluids,
is the volume fraction,
is the particle density,
is the base fluid density,
is the ratio of the viscous diffusion to the Brownian diffusion,
is the base fluid viscosity and
is the Brownian diffusion coefficient of the nanoparticles.
and
are calculated using the following relations,[Citation53,Citation54] respectively:
(5)
(6) where kB is the Boltzmann constant, d is the particle diameter, T is the temperature, R is the radius of the particles (assumed same size), Ho is the surface distance between the particles and Ap/f/p is the Hamaker constant that is calculated based on the static dielectric constants of both the particle and base fluid using the approximation from Birdi.[Citation55] The dielectric property of the particle and base fluid used was obtained from the literature.[Citation56,Citation57]
The function f in EquationEquation (5)(5) is expressed as follows:
(7) where C,
,
and
are empirical constants determined from the present experimental data as 1.013, 0.05, 91.284 and −1.55, respectively. The model and the empirical constants have been derived for Al2O3–glycerol nanofluids using 48 data points for volume fraction up to 5%. shows the predicted energy density with the experimental energy density for all the particle sizes investigated at 3% volume fraction. A similar trend is obtainable when predicting other volume fractions investigated in the present work. Based on the predicted data, the performance of the model in predicting the energy density required for homogenous dispersion of Al2O3–glycerol nanofluids falls within 90%–99% (maximum and average relative deviation of ∼10% and 4.88%, respectively) with R2 value of 0.998. At all the volume fractions investigated in the present work, the efficiency of the model falls within the uncertainty of the ultrasonicator according to the manufacturer's specification. The model performance at all volume fractions relative to the experimental data has been plotted in for nanofluid samples formulated from 20–30 nm Al2O3 nanoparticles.
Figure 12. Model performance for prediction of the required energy density for Al2O3–glycerol nanofluids.
Figure 13. Performance of the model at different volume fractions for 20–30 nm Al2O3–glycerol nanofluid.
4. Conclusion
In this study, experimental investigations had been carried out to determine the optimum time/energy density required for the preparation of stable Al2O3–glycerol nanofluids. The study was achieved by viscometry considering the following parameters: ultrasonication energy density, volume fraction, temperature and nanoparticle size. The preparation process showed that two-step method for nanofluids preparation is always accompanied with varying degrees of agglomerations, and deagglomeration is required to complete the synthesis process. The viscometry study revealed that the nanofluid viscosities reduced as the ultrasonication energy increases up until an optimum value is reached, wherein the viscosity was minimum. The optimum energy density was found to be 3.0 × 10⁷ kJ/m3 for 20–30 nm nanofluid and 1.5 × 10⁷ kJ/m3 for 80- and 100-nm nanofluids. All samples irrespective of particle size, volume fraction and ultrasonication energy density displayed exponential reduction in viscosity to the increasing temperature. The results further showed that nanofluids formulated from small nanoparticle size have higher viscosity compared to nanofluids formulated from bigger nanoparticle size and required more energy for proper dispersion to be achieved. As the nanoparticle volume fraction increases, the viscosity increases irrespective of nanoparticle size. Based on the data of the ultrasonication energy applied for homogenous dispersion, a model for the prediction of energy density required for the preparation of initially homogenised Al2O3–glycerol nanofluids has been presented. The model has been derived based on dimensionless groups and consideration was given to the nanoparticle binding/interaction energy in base fluid, particle size, temperature, volume fraction and other base fluid properties.
Nomenclature
| Ap/f/p | = | Hamaker constant, J |
| C | = | empirical constant |
| d | = | characteristic size of the nanoparticle, m |
| Dp | = | Brownian diffusion coefficient of the particle, m2/s |
| = | ultrasonication energy per unit volume, J/m3 | |
| = | agglomerates binding/interaction energy, J | |
| Ho | = | distance between two particles, m |
| JCPDS | = | joint committee on powder diffraction standards |
| kB | = | Boltzmann constant, J/K |
| m | = | mass, kg |
| Δm | = | mass uncertainty, kg |
| PSD | = | particle size distribution |
| R | = | radius of particle, m |
| Scnf | = | ratio of the viscous diffusion to the Brownian diffusion (Schmidt number) |
| T | = | temperature, K |
| ΔT | = | temperature uncertainty, K. |
| Um | = | overall experimental uncertainty |
| V | = | volume of nanofluid, m3 |
| Greek symbols | = |
|
| α | = | empirical constant |
| β | = | empirical constant |
| γ | = | empirical constant |
| μ | = | viscosity, Pa.s |
| Δμ | = | viscosity uncertainty, Pa.s |
| ρ | = | density, kg/m3 |
| = | change in density between the nanoparticles and base fluid, kg/m3 | |
| φ | = | volume fraction |
| Subscripts | = |
|
| Al | = | aluminium oxide |
| b | = | Boltzmann |
| bf | = | base fluid |
| f | = | fluid |
| gly | = | glycerol |
| m | = | maximum |
| nf | = | nanofluid |
| p | = | particle |
Acknowledgements
The authors wish to acknowledge the assistance rendered by Antoinette of Microscopy Laboratory, University of Pretoria, during the TEM captures. Also, we acknowledge the assistance provided by Dr Rolfes of the Department of Chemical Engineering, University of Pretoria, for the zeta potential and particle size measurements.
Disclosure statement
No potential conflict of interest was reported by the authors.
Additional information
Funding
References
- Eastman JA, Choi SUS, Li S, et al. Anomalously increased effective thermal conductivities of ethylene glycol-based nanofluids containing copper nanoparticles. Appl Phys Lett. 2001;78:718–720.
- Choi SUS, Zhang ZG, Yu W, et al. Anomalous thermal conductivity enhancement in nanotube suspensions. Appl Phys Lett. 2001;79:2252–2254.
- Pastoriza-Gallego MJ, Lugo L, Legido JL, et al. Thermal conductivity and viscosity measurements of ethylene glycol-based Al2O3 nanofluids. Nanoscale Res Lett. 2011;6:221–231.
- Timofeeva EV, Gavrilov AN, Mccloskey JM, et al. Thermal conductivity and particle agglomeration in alumina nanofluids: experiment and theory. Phys Rev E. 2007;76:1–16.
- Amrollahi A, Hamidi A, Rashidi A. The effects of temperature, volume fraction and vibration time on the thermo-physical properties of a carbon nanotube suspension (carbon nanofluid). Nanotechnology. 2008;19:315701.
- Liu M, Lin MC, Huang I, et al. Enhancement of thermal conductivity with carbon nanotube for nanofluids. Int Commun Heat Mass Transf. 2005;32:1202–1210.
- Murshed SMS, Leong KC, Yang C. Investigations of thermal conductivity and viscosity of nanofluids. Int J Therm Sci. 2008;47:560–568.
- Wang X, Xu X, Choi SU. Thermal conductivity of nanoparticle–fluid mixture. J Thermophys Heat Transf. 1999;13:474–480.
- Li Y, Zhou J, Tung S, et al. A review on development of nanofluid preparation and characterization. Powder Technol. 2009;196:89–101.
- Ghadimi A, Saidur R, Metselaar HSC. A review of nanofluid stability properties and characterization in stationary conditions. Int J Heat Mass Transf. 2011;54:4051–4068.
- Hwang Y, Lee J-K, Lee J-K, et al. Production and dispersion stability of nanoparticles in nanofluids. Powder Technol. 2008;186:145–153.
- Fedele L, Colla L, Bobbo S, et al. Experimental stability analysis of different water-based nanofluids. Nanoscale Res Lett. 2011;6:300–307.
- Chung SJJ, Leonard JPP, Nettleship I, et al. Characterization of ZnO nanoparticle suspension in water: effectiveness of ultrasonic dispersion. Powder Technol. 2009;194:75–80.
- Amrollahi A, Rashidi AM, Emami Meibodi M, et al. Conduction heat transfer characteristics and dispersion behaviour of carbon nanofluids as a function of different parameters. J Exp Nanosci. 2009;4:347–363.
- Abareshi M, Sajjadi SH, Zebarjad SM, et al. Fabrication, characterization, and measurement of viscosity of α-Fe2O3–glycerol nanofluids. J Mol Liq. 2011;163:27–32.
- Lee J-H, Hwang KS, Jang SP, et al. Effective viscosities and thermal conductivities of aqueous nanofluids containing low volume concentrations of Al2O3 nanoparticles. Int J Heat Mass Transf. 2008;51:2651–2656.
- Sahoo BC, Vajjha RS, Ganguli R, et al. Determination of rheological behaviour of aluminium oxide nanofluid and development of new viscosity correlations. Pet Sci Technol. 2009;27:1757–1770.
- Kole M, Dey TK. Effect of aggregation on the viscosity of copper oxide-gear oil nanofluids. Int J Therm Sci. 2011;50:1741–1747.
- Duangthongsuk W, Wongwises S. Measurement of temperature-dependent thermal conductivity and viscosity of TiO2–water nanofluids. Exp Therm Fluid Sci. 2009;33:706–714.
- Karthikeyan NR, Philip J, Raj B. Effect of clustering on the thermal conductivity of nanofluids. Mater Chem Phys. 2008;109:50–55.
- Hong TT-K, Yang HH-S, Choi CJ. Study of the enhanced thermal conductivity of Fe nanofluids. J Appl Phys. 2005;97:064311.
- Yu W, Xie H, Chen L, et al. Investigation of thermal conductivity and viscosity of ethylene glycol based ZnO nanofluid. Thermochim Acta. 2009;491:92–96.
- Hong KS, Hong T-K, Yang H-S. Thermal conductivity of Fe nanofluids depending on the cluster size of nanoparticles. Appl Phys Lett. 2006;88:031901.
- Suganthi K, Anusha N, Rajan K. Low viscous ZnO–propylene glycol nanofluid: a potential coolant candidate. J Nanopart Res. 2013. doi:10.1007/s11051-013-1986-6.
- Garg P, Alvarado JL, Marsh C, et al. An experimental study on the effect of ultrasonication on viscosity and heat transfer performance of multi-wall carbon nanotube-based aqueous nanofluids. Int J Heat Mass Transf. 2009;52:5090–5101.
- Yu W, Xie H. A review on nanofluids: preparation, stability mechanisms, and applications. J Nanomater. 2012;2012:1–17.
- Song YS, Youn JR. Influence of dispersion states of carbon nanotubes on physical properties of epoxy nanocomposites. Carbon NY. 2005;43:1378–1385.
- Wamkam CT, Opoku MK, Hong H, et al. Effects of pH on heat transfer nanofluids containing ZrO2 and TiO2 nanoparticles. J Appl Phys. 2011;109:024305.
- Taurozzi, JS, Hackley VA, Wiesner MR. Ceint/nist protocol for preparation of nanoparticle dispersions from powdered material using ultrasonic disruption. Gaithersburg (MD): National Institute of Standards and Technology and Durham (NC): Department of Civil and Environmental Engineering; 2010.
- Ghadimi A, Metselaar I. The influence of surfactant and ultrasonic processing on improvement of stability, thermal conductivity and viscosity of titania nanofluid. Exp Therm Fluid Sci. 2013;51:1–9.
- Lee SW, Park SD, Kang S, et al. Investigation of viscosity and thermal conductivity of SiC nanofluids for heat transfer applications. Int J Heat Mass Transf. 2011;54:433–438.
- Mehrali M, Sadeghinezhad E, Latibari ST, et al. Investigation of thermal conductivity and rheological properties of nanofluids containing graphene nanoplatelets. Nanoscale Res Lett. 2014;9:15.
- Piriyawong V, Thongpool V, Asanithi P, et al. Preparation and characterization of alumina nanoparticles in deionized water using laser ablation technique. J Nanomater. 2012;2012:1–6.
- Segur J, Oberstar H. Viscosity of glycerol and its aqueous solutions. Ind Eng Chem. 1951;43:2117–2120.
- Miner CS, Dalton, NN. Glycerol. ACS monograph series. New York (NY): Reinhold Publishing Company; 1953.
- Kulkarni DPD, Namburu PPK, Ed Bargar H, et al. Convective heat transfer and fluid dynamic characteristics of SiO2 ethylene glycol/water nanofluid. Heat Transf Eng. 2008;29:1027–1035.
- Meyer JP, Adio SA, Sharifpur M, et al. The viscosity of nanofluids: a review of the theoretical, empirical and numerical models. Heat Transf Eng. 2016; 37:387–421.
- Garg J, Poudel B, Chiesa M, et al. Enhanced thermal conductivity and viscosity of copper nanoparticles in ethylene glycol nanofluid. J Appl Phys. 2008;103:074301.
- Enomoto N, Maruyama S, Nakagawa Z. Agglomeration of silica spheres under ultrasonication. J Mater Res. 1997:1410–1415.
- Suganthi KS, Rajan KS. Temperature induced changes in ZnO–water nanofluid: zeta potential, size distribution and viscosity profiles. Int J Heat Mass Transf. 2012;55:7969–7980.
- Kole M, Dey TK. Thermophysical and pool boiling characteristics of ZnO–ethylene glycol nanofluids. Int J Therm Sci. 2012;62:61–70.
- Chong J, Christiansen E, Baer A. Rheology of concentrated suspensions. J Appl Polym Sci. 1971;15:2007–2021.
- Dames B, Morrison BR, Willenbacher N. An empirical model predicting the viscosity of highly concentrated, bimodal dispersions with colloidal interactions. Rheol Acta. 2001;40:434–440.
- Bobbo S, Fedele L, Benetti A, et al. Viscosity of water based SWCNH and TiO2 nanofluids. Exp Therm Fluid Sci. 2012;36:65–71.
- Ghazvini M, Akhavan-Behabadi Ma, Rasouli E, et al. Heat transfer properties of nanodiamond–engine oil nanofluid in laminar flow. Heat Transf Eng. 2012;33:525–532.
- Xie H, Yu W, Chen W. MgO nanofluids: higher thermal conductivity and lower viscosity among ethylene glycol-based nanofluids containing oxide nanoparticles. J Exp Nanosci. 2010;5:463–472.
- Hemmat Esfe M, Saedodin S. An experimental investigation and new correlation of viscosity of ZnO–EG nanofluid at various temperatures and different solid volume fractions. Exp Therm Fluid Sci. 2014;55:1–5.
- Horri BA, Ranganathan P, Selomulya C, et al. A new empirical viscosity model for ceramic suspensions. Chem Eng Sci. 2011;66:2798–2806.
- Anoop KB, Kabelac S, Sundararajan T, et al. Rheological and flow characteristics of nanofluids: influence of electro-viscous effects and particle agglomeration. J Appl Phys. 2009;106:034909.
- Timofeeva EV, Smith DS, Yu W, et al. Particle size and interfacial effects on thermo-physical and heat transfer characteristics of water-based alpha-SiC nanofluids. Nanotechnology. 2010;21:215703.
- Jia-Fei Z, Zhong-Yang L. Dependence of nanofluid viscosity on particle size and pH value. Chinese Phys Lett. 2009;26:10–13.
- Cheng Q, Debnath S, Gregan E, et al. Ultrasound-assisted SWNTs dispersion: effects of sonication parameters and solvent properties. J Phys Chem. 2010;114:8821–8827.
- Elimelech M, Gregory J, Jia X, et al. Particle deposition and aggregation. Woburn (MA): Butterworth-Heinemann; 1995.
- Cļengel Y. Heat and mass transfer: a practical approach. 3rd ed. New York (NY): McGraw-Hill; 2007.
- Birdi K, editor. Handbook of surface and colloid chemistry. 2nd ed. Boca Raton (FL): CRC Press LLC; 2003.
- Akerlof G. Dielectric constants of some organic solvent–water mixtures at various temperatures. J Am Chem Soc. 1932;54:4125–4139.
- Young K, Frederikse H. Compilation of the static dielectric constant of inorganic solids. J Phys Chem Ref Data. 1973;2:313–409.