
ABSTRACT
Fatigue alters rearfoot kinematics on an individual basis and may offer a means of functionally grouping runners. This proof of concept study aimed to determine whether fatigue related changes in rearfoot eversion could be used to functionally group runners. Sixteen male recreational runners had their frontal plane rearfoot kinematics recorded by a three-dimensional motion capture system before and after a 5km run. The magnitude of change in frontal plane rearfoot kinematics pre- to post-fatigue was calculated and K-means clustering used to identify functional groups based upon these changes. T-tests with statistical parametric mapping were used to compare fatigue related changes both within and between clusters. Two clusters or functional groups were evident within the data set. Nine participants were allocated to cluster 1 and displayed small and insignificant changes in frontal plane rearfoot motion post-fatigue. In contrast, the remaining seven participants were assigned to cluster 2 and displayed significant increases in rearfoot eversion between 3 and 84% of the stance phase post-fatigue. These findings prove the concept that fatigue related changes in rearfoot eversion can be used to functionally group participants. Additionally, the differing fatigue related changes reported by each group may alter the injury risk, training and footwear needs of each group.
Fatigue related changes in frontal plane rearfoot motion can be used to functionally group individuals.
Cluster 1 display small and insignificant fatigue related changes, which suggests they can maintain their habitual movement pathway.
Cluster 2 displayed significant increases in rearfoot eversion for the majority of the stance phase, suggesting an inability to maintain their habitual movement pathway, which may increase injury risk.
Highlights
Introduction
Recreational running is a popular sport, with an estimated 2.9 million people globally running a 5km race in 2018 (Andersen, Citation2019) and 350,000 running park runs (typically 5km distance) each week (Jefferys, Citation2021). While running has many known health benefits (Hulteen et al., Citation2017; Lee et al., Citation2014), at a recreational level running is associated with high injury rates (Hulteen et al., Citation2017). Specifically, it has been estimated that between 19.4% and 79.3% of runners are injured annually (Van Gent et al., Citation2007). The majority of running-related injuries are overuse injuries, which are a result of a mechanical overload of structures within the body without sufficient recovery (Ferber, Hreljac, & Kendall, Citation2009; Hreljac, Citation2004). Traditional paradigms linked excessive pronation, typically quantified using rearfoot (RF) eversion, and/or impact forces to the development of overuse running injuries (Nigg, Baltich, Hoerzer, & Enders, Citation2015; Nigg, Mohr, & Nigg, Citation2017; Trudeau et al., Citation2019). However, due to a lack of empirical support these traditional running injury models have become increasingly challenged and more contemporary paradigms proposed (Nigg et al., Citation2015; Nigg et al., Citation2017; Trudeau et al., Citation2019).
The habitual movement pathway, a development of the preferred movement pathway (Nigg et al., Citation2015; Nigg et al., Citation2017), has been proposed as an alternative running injury model (Trudeau et al., Citation2019; Willwacher et al., Citation2020). The habitual movement pathway assumes that each individual has a single optimal movement pattern which the body naturally selects based upon the joints path of least resistance (Trudeau et al., Citation2019; Willwacher et al., Citation2020). In contrast, the preferred movement pathway is condition or situation-specific and an individual may have different preferred movement pathways depending upon internal (muscular fatigue) or external (footwear or running surface) factors (Nigg et al., Citation2017; Trudeau et al., Citation2019). The assumption within both of these models is that deviations away from the habitual or preferred movement pathway will increase injury risk due to alterations in the tissues loaded and/or increased magnitudes of musculoskeletal load (Trudeau et al., Citation2019; Willwacher et al., Citation2020). In addition to the development of more contemporary injury models, the importance of identifying functional groups or people who respond to certain interventions in a similar manner has been highlighted, with a view to enabling the mass individualisation of training or rehabilitative practices, and footwear provision (Maurer et al., Citation2012; Nigg et al., Citation2017).
Fatigue is a factor that would influence running injury risk due to altered motion patterns and force generating capabilities of the musculoskeletal system (Willwacher, Sanno, & Brüggemann, Citation2020). A plethora of literature (Christina, White, & Gilchrist, Citation2001; Derrick, Dereu, & McLean, Citation2002; Dierks, Davis, & Hamill, Citation2010; Weir et al., Citation2018; Willwacher, Sanno, et al., Citation2020) exists which highlights fatigue related changes in lower limb kinematics. Of specific relevance to this study, RF eversion has been shown to significantly increase when running in a fatigued state (Christina et al., Citation2001; Derrick et al., Citation2002; Dierks et al., Citation2010; Weir et al., Citation2018; Willwacher, Sanno, et al., Citation2020), which would be suggested to increase injury risk in line with both traditional and contemporary injury models. While the fatigue related changes in RF eversion reported previously are relatively consistent (Christina et al., Citation2001; Derrick et al., Citation2002; Dierks et al., Citation2010; Weir et al., Citation2018; Willwacher, Sanno, et al., Citation2020), inter-individual differences in the magnitude of change are evident (Weir et al., Citation2018; Willwacher et al., Citation2020). These individual fatigue related changes may offer a means of functionally grouping participants. As such, the aim of this proof of concept study was to determine whether fatigue related changes in RF motion over the stance phase could be used to functionally group individuals. The hypothesis tested within this study was that distinct functional groups with different fatigue related changes in frontal plane RF motion would exist. Identification of such groups may have implications for injury risk and footwear recommendation.
Methods
Sixteen recreational male runners, who ran on average three times per week, participated in this study (mean ± SD; age: 24 ± 5 years; height: 1.78 ± 0.05 m; mass: 77 ± 7 kg). While no formal power calculation was undertaken, the sample size is comparable with previous studies that have either explored the influence of fatigue upon RF eversion (Weir et al., Citation2018) or looked to identify functional groups based on kinematic parameters (Maurer et al., Citation2012). Inclusion criteria for the study were as follows; male to enable the standardisation of footwear within the study as only male footwear in the UK sizes 8–12 were available, 18–45 years old, experience running on a treadmill, running at least once a week for a minimum of 5km, capable of running 5km in under 25 min, injury free at the time of testing with no known musculoskeletal conditions. Ethical approval for the study was provided by the Sport and Physical Activity Departmental Research Ethics Sub-Committee (SPA-REC-2018-206). All participants provided written informed consent prior to testing.
Participants attended a single testing session within which they ran overground along a 20m runway, at a self-selected pace (14.3 ± 1.1 km·hr−1), before and after completing a 5km time trial. The 5km time trial was used to elicit fatigue and was undertaken on a motorised H/P/Cosmos Pulsar 4.0 treadmill (H/P/Cosmos Sports and Medical GmbH, Germany), set at a 1% incline to replicate the energetic demands of overground running (Jones & Doust, Citation1996). Participants were informed to run the 5km time trial as fast as possible and were able to manipulate the treadmill velocity at will. A 5km time trial was utilised within the study as this is the most popular race distance1 and was assumed likely to elicit a fatigue response. Rating of perceived exertion (RPE) and blood lactate was measured immediately before and after the 5km time trial to estimate perceptual and peripheral fatigue. RPE was quantified using Borg’s 6–20 point scale (Borg, Citation1998). Blood lactate samples were taken using a fingertip blood sample and analysed using a portable blood lactate analyser (LactatePro 2, Arkray, JP).
Kinematic and kinetic data were collected during overground running trials before and after the 5km time trial using a 10-camera motion capture system (Qualisys, Gothenburg, Sweden) and two synchronised force platforms (Kistler, Winterthur, Switzerland), sampling at 200Hz and 2000Hz, respectively. Running velocity was monitored during overground running trials using timing gates (Fusion Sport, Brisbane, Australia), set up 5m either side of the centre of the force platforms, and only trials within ± 5% of the target velocity were accepted for data processing. The target velocity was set based upon the velocity selected by participants during a five-minute familiarisation period on the treadmill at the beginning of the testing session. Participants were also provided with time to familiarise themselves to running within the laboratory environment at the required velocity prior to testing commencing. A total of 12 good trials were recorded, within a single recording as participants ran up and down the laboratory continuously at the required velocity, before and after the 5km time trial. A good trial defined as one in which the left foot made contact with the force platforms, without visibly altering their movement patterns (changes in stride length) to successful land on the platforms. The post-fatigue trials were undertaken within 2–3 min of completing the 5km run to enable time to check all markers were secure but to minimise recovery.
RF kinematics were calculated using a two-segment rigid body model of the shank and calcaneus. Ten-millimetre retroreflective markers were attached to the medial and lateral femoral epicondyles, and malleoli to define the proximal and distal aspects of the shank, respectively. The shank was tracked during dynamic trials using four non-colinear markers attached to a rigid plastic base, located on the lateral-distal aspect of the segment. The calcaneus was defined and tracked using markers located on the medial, lateral and central posterior aspect of the segment. To facilitate direct tracking of the calcaneus within the shoe, 25-millimetre circular incisions were made within standardised neutral/cushioned running shoes (ASICS Gel Cumulus 18) in-line with the literature (Bishop et al., Citation2015; Langley et al., Citation2015). Markers were secured using a mixture of double sided and kinesiology tape (Rock Tape, Essex, UK), with the shank marker cluster secured using elasticated Velcro straps. Prior to dynamic data capture a short static trial was recorded to define the relevant segmental coordinate systems which were orientated as follows; X axis = medial-lateral, Y axis = anterior-posterior and Z axis = vertical.
Marker trajectories were reconstructed and labelled for ten trials within Qualisys Track Manager (Qualisys, Gothenburg, Sweden) and exported to Visual 3D (C Motion, MD, USA) for biomechanical modelling. Kinematic and kinetic data were filtered using 10Hz and 100Hz low pass filters, respectively. RF motion was calculated using Euler angles and an XYZ sequence of rotations. RF motion was cropped to the stance phase, using 10N threshold applied to the vertical ground reaction force data, normalised to 100% stance duration and averaged across all ten trials. Frontal plane RF kinematics were referenced to static posture and exported for analysis. To aid in the cluster analysis the magnitude of fatigue related changes in frontal plane RF kinematics were calculated over the entire stance phase for each participant by subtracting pre-fatigue values from post-fatigue values, as such negative values denote a more everted position post-fatigue.
K-means cluster analysis was undertaken in Python utilising the Sci-kit-learn module (Pedregosa et al., Citation2011) and the k-means++ algorithm. A 16×101 matrix consisting of the magnitude of change in frontal plane RF motion due to fatigue over the stance phase for each participant was constructed and used as the input for the K-means cluster analysis. To identify the optimal number of clusters (k), functional groups, within the data set K-means cluster analysis was initially ran for k = 2–4, with silhouette and Calinski–Harabasz scores calculated. Two clusters were determined as being optimal based upon larger silhouette (k2 = 0.39; k3 = 0.35; k4 = 0.28) and Calinski–Harabasz (k2 = 17.22; k3 = 16.88; k4 = 14.46) scores. K-means clustering is an unsupervised classification technique that can at times return local rather than global optimum groupings, and as such the classification procedure was repeated ten times to explore consistency in group allocation, in line with previous work using this technique (Clermont et al., Citation2019). Due to the small sample size a leave-one-out cross-validation was undertaken to determine the classification accuracy. The clustering and validation approaches are consistent with previous work (Clermont et al., Citation2019; Hoerzer et al., Citation2015) within sports biomechanics and also aligned with the recommendations of Halilaj et al. (Citation2018).
An independent samples t-test with one dimensional statistical parametric mapping (SPM) was used to compare the magnitude of fatigue related change in frontal plane RF motion between clusters. Paired samples t-tests with one dimensional statistical parametric mapping were also used to compare frontal plane RF motion pre- and post-fatigue within each cluster. SPM analysis was undertaken within Python and using publicly available scripts developed by Pataky (Citation2019). A mixed model analysis of variance (ANOVA) was used to compare time*cluster interactions for blood lactate and RPE. Additionally, a Mann Whitney U test was used to compare running velocity between groups, as the data were not normally distributed. ANOVA and Mann Whitney U tests were undertaken within SPSS 23 (IBM, Armonk, NY, USA).
Hedge’s g, corrected for a small sample size, was calculated as an estimate of the effect size where t test and Mann Whitney U analysis was undertaken (Lakens, Citation2013). For time-series data Hedge’s g was calculated on a point-by-point basis. Hedge’s g was interpreted as follows; small < .5, medium ≥ .5 and < .8, large ≥ .8 (Halilaj et al., Citation2018). Partial eta squared (pη2) was calculated as an estimate of the effect size where ANOVA analysis was undertaken and interpreted as follows; small < .06, medium ≥ .06 and < .14, large ≥ .14 (Lakens, Citation2013). The alpha level for the study was set at p < .05.
Results
Cluster assignments for each participant were 100% repeatable across all 10 iterations of the K-means analysis using k = 2. Nine participants were allocated to cluster 1, with the remaining seven participants assigned to cluster 2. Classification accuracy was 95% ± 8% during the leave-one-out cross-validation.
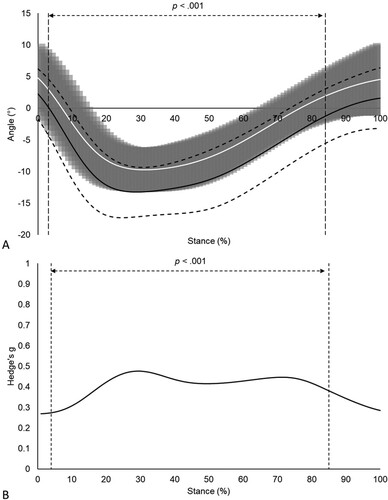
Cluster 2 displayed significantly (p < .001) greater changes in frontal plane RF motion from 3 to 92% of the stance phase compared to cluster 1 (A). Large effect sizes (g ≥ 0.8) were reported over the entire stance phase when comparing fatigue related changes in frontal plane RF motion between clusters (B). No significant (p > .05) differences in frontal plane RF motion were reported between pre- and post-fatigue measurements for cluster 1, with trivial effect sizes (g < .01) reported over the entire stance phase (). In contrast, cluster 2 displayed significantly (p < .001) increased RF eversion post-fatigue from 3 to 84% of the stance phase compared to their pre-fatigue measurements, with moderate effect sizes (g ≥ 0.5) reported between 22 and 35% of the stance phase ().
Figure 1. (A) Magnitude of fatigue related change in frontal plane RF motion for cluster 1 (mean: solid white line; SD: dark grey shaded region) and cluster 2 (mean: solid black line; SD: light grey shaded region), with positive and negative values denoting more inverted and everted positions post-fatigue respectively, and (B) Hedge’s g effect size comparing the magnitude of fatigue related change between clusters. Vertical dashed lines denote the beginning and end of the period of statistical significance as identified by SPM independent samples t-tests (p < .001).
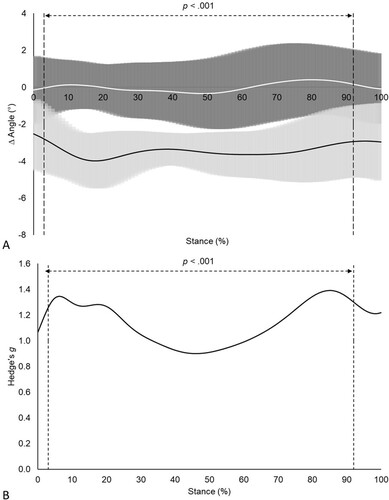
Figure 2. (A) Frontal plane RF kinematics pre- (mean = solid white line; ± 1 SD = shaded grey region) and post-fatigue (mean = solid black line; ± 1 SD = dashed black lines), (B) and associated effect sizes for cluster 1 (n = 9).
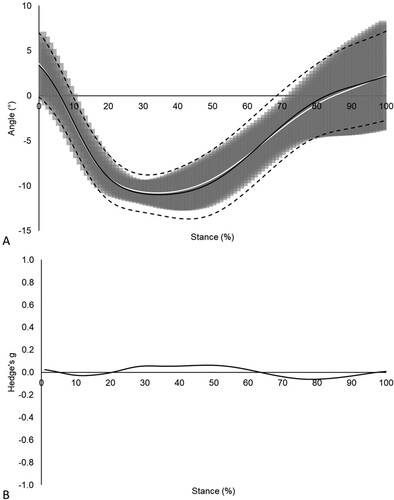
Figure 3. (A) Frontal plane RF kinematics pre- (mean = solid white line; ± 1 SD = shaded grey region) and post-fatigue (mean = solid black line; ± 1 SD = dashed black lines), (B) and associated effect sizes for cluster 2 (n = 7). Vertical dashed lines denote the beginning and end of the period of statistical significance as identified by SPM independent samples t-tests (p < .001).
No significant (p ≥ .945; pη2 < .001) time*cluster interactions were reported for either RPE or blood lactate. However, both RPE (pre = 6 ± 0; post = 17 ± 1) and blood lactate (pre = 1.3 ± 0.4; post = 7.5 ± 2.5 mmol·l−1) significantly (p < .001) increased post-fatigue, with the increases associated with large effect sizes (pη2 ≥ .986). Additionally, no significant (p = .606; g = 0.24) difference in running velocity was reported between clusters (cluster 1 = 13.3 ± 1.2 km/hr [range = 12.1–15.5 km/hr]; cluster 2 = 13.7 ± 1.2 km/hr [range = 12.5–15.5 km/hr]).
Discussion
The aim of this proof of concept study was to determine whether fatigue related changes in frontal plane RF motion over the stance phase could be used to functionally group individuals. Two clusters or functional groups were identified within the data set by K-means cluster analysis, with the fatigue related changes for each group significantly differing for the majority of the stance phase (). These findings support the hypotheses tested and prove the concept that fatigue related changes in frontal plane RF motion can be used to functionally group recreational runners.
The significant increases in RPE and blood lactate suggest that the 5km time trial successfully elicited perceptual and peripheral fatigue. The RPE values reported post-fatigue (17 ± 1) were consistent with those used to indicate a fatigued state previously (Dierks et al., Citation2010; Willwacher, Sanno, et al., Citation2020) and are indicative of perceptions of working “very hard” (Borg, Citation1998). The blood lactate values reported post-fatigue (7.5 ± 2.5 mmol·l−1) were above the threshold (4.0 mmol·l−1) for the onset of blood lactate accumulation (OBLA) and suggest participants were working above their critical threshold or fatigue threshold (Jones et al., Citation2008). RPE and lactate responses to the 5km run were consistent across participants, with those reporting higher RPE scores also reporting higher lactate values. RPE and lactate responses did not significantly differ between clusters demonstrating consistent perceptual and peripheral fatigue responses, despite the differing fatigue related changes in frontal plane RF motion.
The two clusters or functional groups identified within the study are linked to participants ability to maintain their pre-fatigue movement pattern or not. Cluster 1 displayed no significant changes in their frontal plane RF motion patterns and as such appear to be able to maintain their pre-fatigue movement pattern post-fatigue ( and ). In contrast, cluster 2 could not maintain their pre-fatigue movement pattern, with significantly increased RF eversion reported for the majority of the stance phase ( and ). The magnitude of change in RF motion post-fatigue demonstrated by cluster 2 is slightly larger than the fatigue related changes in peak RF eversion (1.3°–2.6°) reported previously (Christina et al., Citation2001; Derrick et al., Citation2002; Dierks et al., Citation2010; Willwacher, Sanno, et al., Citation2020). Previous work (Weir et al., Citation2018) also using SPM reported significant increases in RF eversion between 16 and 69% of the stance phase post-fatigue. The larger magnitude of change in frontal plane RF motion and the increased duration over which this increase is significant reported within this study for cluster 2 is likely due to greater heterogeneity in fatigue responses within this functional group compared to the groups assessed previously (Christina et al., Citation2001; Derrick et al., Citation2002; Dierks et al., Citation2010; Weir et al., Citation2018; Willwacher, Sanno, et al., Citation2020).
The presence of the two distinct clusters within the participant population assessed highlights that fatigue responses are not consistent across individuals. Elucidating the factor(s) that influence the extent to which an individual can maintain their habitual movement pathway once they enter a fatigued state would aid in the development of training interventions or extrinsic aids such as footwear. Interestingly running velocity, RPE and blood lactate were all comparable between the two clusters within this study. Running experience, lower limb or more specifically in this instance ankle invertor and evertor strength and endurance may be factors that influence an individual’s ability to maintain their habitual movement pathway once fatigued; however, these variables were not assessed within this study. Alternatively, the findings may suggest a disconnect between perceptual or peripheral and biomechanical fatigue responses in some individuals, specifically those within cluster 1 within this study.
Assuming that the pre-fatigue movement patterns displayed by participants are representative of their habitual movement pathway the findings of this work may potentially have implications for injury risk. In line with the habitual movement pathway paradigm, cluster 2 would be expected to have a greater injury risk than cluster 1 as they displayed significant deviations away from their habitual movement patterns post-fatigue. The significant increase in RF eversion post-fatigue displayed by cluster 2 would be expected to reduce the propulsive efficiency of the foot relative to the pre-fatigued state, altering both the magnitude of loading and structures loaded within the body potentially increasing injury risk (Nigg et al., Citation2015; Nigg et al., Citation2017; Trudeau et al., Citation2019; Willwacher et al., Citation2020). As such individuals within cluster 2 may require different footwear interventions compared to those in cluster 1. Neutral/cushioned running shoes were used by all participants within this study and these types of running shoes contain few motion control features. Speculatively, those in cluster 2 may benefit from motion control running shoes, which have previously been shown to reduce RF eversion in both pre- and post-fatigued states (Cheung & Ng, Citation2007; Lilley, Stiles, & Dixon, Citation2013). While the findings of this study have been interpreted in light of the habitual movement pathway paradigm further work is required to determine the efficacy of the habitual movement pathway injury paradigm and other contemporary models.
The individual responses to prolonged running used to cluster participants within this study have been reported previously (Weir et al., Citation2018; Willwacher, Sanno, et al., Citation2020). Willwacher, Sanno, et al. (Citation2020) suggested that the kinematic adaptations to prolonged running at relatively high intensities are likely due to both habituation and fatigue effects. Habituation effects are likely to occur sooner as the runner adapts to their running environment, with fatigue effects occurring in a more linear manner later in the run (Willwacher, Sanno, et al., Citation2020). The experimental design of the current study does not enable habituation and fatigue effects to be differentiated as kinematic data were only collected pre- and post-5 km run. As such it is possible that the findings reported are related to habituation rather than fatigue effects. However, the data have been interpreted throughout the discussion as being fatigue related due to the large changes in markers of central and peripheral fatigue reported by both clusters and the time course of habituation reported by others (Brüggeman, Citation1996; Willwacher, Sanno, et al., Citation2020). Visual exploration of the change in average and peak RF eversion over the course of a 10 km run reported by Willwacher, Sanno, et al. (Citation2020) appears to show inflection points within the curves between 1 and 2 km, after which the changes reported become more linear which were proposed to denote fatigue effects.
The findings of this study need to be interpreted in light of its limitations. K-means cluster analysis is an unsupervised machine learning technique which randomly allocates its initial seed locations for cluster identification (Clermont et al., Citation2019). As such the cluster centres for the two clusters identified within this study are liable to change if alternative data sets are utilised. Additionally, the silhouette and Calinski–Harabasz scores for the two and three cluster solutions were similar and with a larger data set a third functional group may become evident. Another limitation of the study is that the work focused solely on frontal plane RF motion. Frontal plane RF motion was selected as the input for the K-means cluster analysis within this study as this variable has been studied extensively in both the running biomechanics and footwear literature (Christina et al., Citation2001; Derrick et al., Citation2002; Dierks et al., Citation2010; Jones et al., Citation2008; Lakens, Citation2013; Weir et al., Citation2018; Willwacher et al., Citation2020). Additionally, frontal plane RF motion has been shown to be influenced by fatigue (Christina et al., Citation2001; Derrick et al., Citation2002; Dierks et al., Citation2010; Weir et al., Citation2018; Willwacher, Sanno, et al., Citation2020) and has links to footwear design (Cheung & Ng, Citation2007; Lilley et al., Citation2013). It would be feasible to utilise a larger number of variables, such as triplanar RF or lower limb kinematics, within the cluster analysis or to use principal component analysis for data mining prior to undertaking cluster analysis. However, larger sample sizes would be required to facilitate this analysis. Finally, the decision to report frontal plane RF kinematics alone within the study means that fatigue related changes at other joints or in other planes within the kinematic chain are not reported. Differences in fatigue responses may be evident between the two clusters identified within the study at other joints and may have further implications for injury risk.
In summary, fatigue related changes in frontal plane RF kinematics offer a means of functionally grouping participants. Two distinct clusters or functional groups were evident within the data set, who displayed significant differences in fatigue related changes in frontal plane RF motion over most of the stance phase. One group displayed small and insignificant changes due to fatigue, which suggests they could maintain their habitual movement pathway. In contrast, the other group displayed significant fatigue related changes over most of the stance phase, suggesting deviation away from their habitual movement pathway. These two distinct functional groups may have differing injury risks, training and footwear requirements.
Acknowledgements
Footwear for the study was provided by ASICS.
Disclosure statement
No potential conflict of interest was reported by the author(s).
Additional information
Funding
References
- Andersen, J. J. (2019). The State of Running 2019. Retrieved 28 June 2021, from https://runrepeat.com/state-of-running.
- Bishop, C., Arnold, J. B., Fraysse, F., Thewlis, D. (2015). A method to investigate the effect of shoe-hole size on surface marker movement when describing in-shoe joint kinematics using a multi-segmental foot model. Gait & Posture, 41, 295–299.
- Borg, G. (1998). Borg’s perceived exertion and pain scales. Human Kinetics: Champaign, IL, USA.
- Brüggeman, G.-P. (1996). Influence of fatigue on lower extremity function. ISBS Conference Proceedings Archie 1. https://ojs.ub.uni-konstanz.de/cpa/article/view/2666.
- Cheung, R. T. H., & Ng, G. Y. F. (2007). Efficacy of motion control shoes for reducing excessive rearfoot motion in fatigued runners. Physical Therapy in Sport, 8, 75–81.
- Christina, K., White, S., & Gilchrist, L. (2001). Effect of localized muscle fatigue on vertical ground reaction forces and ankle joint motion during running. Human Movement Science, 20, 257–276.
- Clermont, C. A., Benson, L. C., Edwards, W. B., Hettinga, B.A., & Ferber, R. (2019). New considerations for wearable technology data: Changes in running biomechanics during a marathon. Journal of Applied Biomechanics, 35, 401–409.
- Derrick, T., Dereu, D., & McLean, S. (2002). Impacts and kinematic adjustments during an exhaustive run. Medicine & Science in Sports & Exercise, 34, 998–1002.
- Dierks, T., Davis, I., & Hamill, J. (2010). The effects of running in an exerted state on lower extremity kinematics and joint timing. Journal of Biomechanics, 43, 2993–2998.
- Ferber, R., Hreljac, A., & Kendall, K. (2009). Suspected mechanisms in the cause of overuse running injuries. Sports Health, 1, 242–246.
- Halilaj, E., Rajagopal, A., Fiterau, M., Hicks, J.L., Hastie, T.J., & Delp, S.L. (2018). Machine learning in human movement biomechanics: Best practices, common pitfalls and new opportunities. Journal of Biomechanics, 81, 1–11.
- Hoerzer, S., von Tascharner, V., Jacob, C., & Nigg, B.M. (2015). Defining functional groups based on running kinematics using self-organizing maps and support vector machines. Journal of Biomechanics, 48, 2072–2079.
- Hreljac, A. (2004). Impact and overuse injuries in runners. Medicine & Science in Sports & Exercise, 36, 845–849.
- Hulteen, R. M., Smith, J. J., Morgan, P. J., Barnett, L.M., Hallal, P.C., Colyvas, K., & Lubans, D.R. (2017). Global participation in sport and leisure-time physical activities: A systematic review and meta-analysis. Preventive Medicine, 95, 14–25.
- Jefferys, R. (2021). New partnership with world athletics. Retrieved 28 June 2021, https://www.parkrun.com/blog/news/2020/06/29/new-partnership-with-world-athletics/.
- Jones, A. M., & Doust, J. H. (1996). A 1% treadmill grade most accurately reflects the energetic cost of outdoor running. Journal of Sports Sciences, 14, 321–327.
- Jones, A. M., Wilkerson, D. P., DiMenna, F., Fulford, J., & Poole, D.C. (2008). Muscle metabolic responses to exercise above and below the “critical power” assessed using 31P-MRS. American Journal of Physiology. Regulatory, Integrative and Comparative Physiology, 294, R585–R593.
- Lakens, D. (2013). Calculating and reporting effect sizes to facilitate cumulative science: A practical primer for t tests and ANOVAs. Frontiers in Psychology, 24, 863.
- Langley, B., Cramp, M., Morisasu, K., Nishiwaki, T., & Morrison, S.C. (2015). Multi-segmental foot modelling during shod activity: Study of running shoe integrity. Footwear Science, 7, S144–S145.
- Lee, D.-C., Pate, R. R., Lavie, C. J., Sui, X., Church, T. S., & Blair, S.N. (2014). Leisure-time running reduces all-cause and cardiovascular mortality risk. Journal of the American College of Cardiology, 64, 472–481.
- Lilley, K., Stiles, V., & Dixon, S. (2013). The influence of motion control shoes on the running gait of mature and young females. Gait & Posture, 37, 331–335.
- Maurer, C., Federolf, P., von Tscharner, V., Stirling, L., & Nigg, B.M. (2012). Discrimination of gender-, speed-, and shoe-dependent movement patterns in runners using full-body kinematics. Gait & Posture, 36, 40–45.
- Nigg, B. M., Baltich, J., Hoerzer, S., & Enders, H. (2015). Running shoes and running injuries: Mythbusting and a proposal for two new paradigms: ‘preferred movement path’ and ‘comfort filter’. British Journal of Sports Medicine, 49, 1290–1294.
- Nigg, B. M., Mohr, M., & Nigg, S. R. (2017). Muscle tuning and preferred movement path – a paradigm shift. Current Issues in Sport Science, 2, 1-12.
- Pataky, T. (2019). SPM1D One- and two-sample tests. http://www.spm1d.org/doc/Stats1D/onetwosample.html.
- Pedregosa, F., Varpquaux, G., Gramfort, A., Michel, V., Thirion, B., Grisel, O., ... Duchesnay, É. (2011). Scikit-learn: Machine learning in python. Journal of Machine Learning Research, 2011(12), 28825–22830.
- Trudeau, M. B., Willwacher, S., Weir, G., Rohr, E., Ertel, C., Brüggemann, G.P., & Hamill, J. (2019). A novel method for estimating an individual’s deviation from their habitual motion path when running. Footwear Science, 11, 135–145.
- Van Gent, R. N., Siem, D., Van Middeloop, M., van Os, A., Bierma-Zeinstra, S.M.A., & Koes, B.W. (2007). Incidence and determinants of lower extremity running injuries in long distance runners: A systematic review. British Journal of Sports Medicine, 41, 469–480.
- Weir, G., Jewell, C., Wyatt, H., Trudeau, M.B., Rohr, E., Brüggemann, G.P., & Hamill, J. (2018). The influence of prolonged running and footwear on lower extremity biomechanics. Footwear Science, 11, 1–11.
- Willwacher, S., Mählich, D., Trudeau, M. B., Hamill, J., Weir, G., Brüggemann, G.P., & Bratke, G. (2020). The habitual motion path theory: Evidence from cartilage volume reductions in the knee joint after 75 min of running. Scientific Reports, 10, 1363.
- Willwacher, S., Sanno, M., & Brüggemann, G. P. (2020). Fatigue matters: An intense 10 km run alters frontal and transverse plane joint kinematics in competitive and recreational adult runners. Gait & Posture, 76, 277–283.