
Abstract
We apply a principal component analysis to characterize the dimensions of spatio-temporal change in agriculture within the Brazilian Legal Amazon for the period 1996–2006. Around 80% of spatio-temporal variation across a broad set of descriptors could be explained by four trajectories well observed in the region: large-scale ranching, inactive forested property, small-scale farming, and mechanized agriculture. Spatial clustering based on these trajectories reveals a shift in the characteristics of the agricultural frontier, and provides quantitative method for distinguishing functional sub-regions previously suggested in the literature. Our analysis suggests a marked growth in agriculture over the decade between 1996 and 2006, with agricultural development encroaching toward the interior of the Brazilian Amazon not only from the south and southeast, but also from the west.
1. Introduction
Research on the factors driving land-use and land-cover change in the Amazon Basin has grown considerably since the late 1990s and 2000s, leading to significant advances in understanding the causes and drivers of change (Asner et al., Citation2006; Foley et al., Citation2007; Kaimowitz & Angelsen, Citation1998; Lambin et al., Citation2001; Laurance, Albernaz, Fearnside, Vasconcelos, & Ferreira, Citation2004; Nelson & Hellerstein, Citation1997; Pfaff, Citation1999). Much of this literature can be divided into one of two groups: (1) case studies which most often rely on field- and household-level data, and (2) aggregate studies which make use of census and/or remotely sensed data to draw inferences about the larger Amazon. The inherent limitations of these different research approaches are well documented as the individualistic and ecological fallacies. On the one hand, case-study research is limited in the extent to which results can be extrapolated to draw inferences about the broader Amazon (Seligson, Citation2008; Subramanian, Jones, Kaddour, & Krieger, Citation2009). If the sample is relatively small and not representative of the true population these projections can be largely erroneous. On the other hand, regional studies run the risk of committing the ‘ecological fallacy’ (Rindfuss, Walsh, Mishra, Fox, & Dolcemascolo, Citation2003) – attributing regional-scale characteristics to the communities that make up the larger system. The current study contributes to bridging the gap between these two lines of research by applying a common data framework based on principal components analysis (PCA) to view and compare federal units (states) and functional sub-regions within the Brazilian Legal Amazon region, as well as characterize the dimensions of spatio-temporal change in agriculture for the period 1996–2006. This approach provides a quantitative method for distinguishing functional sub-regions previously suggested in the literature, including the ‘arc of deforestation’ (Aldrich, Walker, Simmons, Caldas, & Perz, Citation2012; Cochrane et al., Citation1999; De Espindola, De Aguiar, Pebesma, Câmara, & Fonseca, Citation2012).
1.1. Research in Amazonia
Much of our knowledge on the causes and drivers of spatio-temporal landscape change in the Amazon has resulted from the wealth of published field research and analysis case studies that have been conducted, particularly in the Brazilian states of Rondônia, Pará, and Mato Grosso or the ‘arc of deforestation’. Particular attention has been focused on the chosen land-use systems and their impact on landscape change and forest fragmentation (e.g., Arvor, Meirelles, Dubreuil, Bégué, & Shimabukuro, Citation2012; Batistella, Robeson, & Moran, Citation2003; Michalski, Peres, & Lake, Citation2008), such as agroforestry (Alfaia, Ribeiro, Nobre, Luizão, & Luizão, Citation2004; Browder & Pedlowski, Citation2000; Yamada & Gholz, Citation2002), silviculture (Summers, Browder, & Pedlowski, Citation2004), ranching systems (Merry, Sheikh, & Mcgrath, Citation2004; Sheikh, Merry, & McGrath, Citation2006; Siegmund-Schultze, Rischkowsky, Da Veiga, & King, Citation2007), and the rise of soy agriculture (Macedo et al., Citation2012; Scheffler, Neill, Krusche, & Elsenbeer, Citation2011). Even when these case studies benefit from more expansive remote-sensing data (e.g., Batistella & Moran, Citation2005; De Barros Ferraz, Vettorazzi, Theobald, & Ballester, Citation2005), key limitations resonate in their inherent small size and the difficulty in correctly extrapolating case-study findings across multiple sites, regions, and time periods, along with the difficulty in tracking heterogeneity across space and time.
In contrast to case-study analysis, basin-wide analysis has identified the determinants of land-cover change (Arima, Simmons, Walker, & Cochrane, Citation2007; Chomitz & Gray, Citation1996; Pfaff, Citation1999; Walker et al., Citation2009; Weinhold & Reis, Citation2008), including the impacts of agricultural crop production and cattle ranching (Bowman et al., Citation2012; Cardille, Citation2003; Carreiras, Pereira, Campagnolo, & Shimabukuro, Citation2006; Chomitz & Thomas, Citation2003; Faminow, Citation1997; Simon & Garagorry, Citation2006; Weinhold, Citation1999); population density, soils, and climate (Laurance et al., Citation2002); and boom-bust cycles of development (Rodrigues et al., Citation2009). One limitation of these studies is the tendency to present summative analysis at the scale of the Amazon Basin (Brondizio & Moran, Citation2012) that does not recognize or account for spatial heterogeneity, leaving the conclusion that policy – no matter what the objective – will impact the Brazilian Amazon uniformly.
Several recent papers stand out as bridging these approaches by either linking municipal-level agricultural census data to deforestation estimates or using regression analyses to make comparisons of land use and change across states (Aguiar, Câmara, & Escada, Citation2007; Barona, Ramankutty, Hyman, & Coomes, Citation2010; De Espindola et al., Citation2012; Taylor et al., Citation2011). However, while regression analysis provides clear insight into how variation in particular outcomes (like deforestation) is explained by sets of raw predictors, it does not inform or identify the underlying dimensions of change these raw predictors may be reflecting. Here we propose that PCA, a widely used statistical method adapted to achieve dimension reduction of multivariate data, can be used to identify the underlying dimensions of land use and their relationship to the raw predictors, allowing identification of both temporal and spatial patterns and heterogeneity (Jolliffe, Citation2002).
1.2. Principal component analysis
Developed over a century ago (Hotelling, Citation1933; Pearson, Citation1901), PCA has been applied across a wide range of disciplines as a tool for characterizing and modeling data (Jobson, Citation2002; Jolliffe, Citation2002; Jongman, Ter Braak, & Van Tongren, Citation1995; Legendre & Legendre, Citation1998); and more particularly for classifying biophysical factors of the environment (Cochard-Picon et al., Citation2012; Jayawardana, Ishiga, & Pitawala, Citation2012; Richards, Rosas, Banta, Bhambhra, & Purugganan, Citation2012), food chemistry (Bernaert et al., Citation2012; Fraser et al., Citation2012), and markets (Huynh & Jacho-Chavez, Citation2011; Huynh, Jacho-Chavez, Petrunia, & Voia, Citation2011). Within the social sciences, PCA is most often used to create composite indices to represent socioeconomic status (SES), health, and well-being (Lordan, Soto, Brown, & Correa-Valez, Citation2012) that are based on measurements similar to the Human Development Index (HDI) (Essa & Nieuwoudt, Citation2003), food security indices (Nyaga & Doppler, Citation2009), and poverty mapping (Fujii, Citation2008).
The PCA process can be thought of as a form of serial linear regressions. A vector line is drawn through an n-dimensional dataset such that the sum-of-squares (n-dimensional) distances from the line to all the points in the dataset are minimized. This vector becomes the first principal component (PC), with the projection of the dataset onto this component explaining some fraction of the overall variation in the dataset in the same way as in a simple linear regression. A second line, orthogonal to the first line (and thus not explaining any of the same variation as the first line) is drawn in a similar way, minimizing sum-of-squares distances subject to the constraint of orthogonality to the first vector, and becomes the second PC. This process is repeated to generate n orthogonal vectors (Jolliffe, Citation2002), a linear combination of which will explain all variation in the dataset (i.e., they form a set of eigenvectors for the n-dimensional dataset). This set of orthogonal PCs can be thought of as a rotation of the original n-dimensional space, such that all of the original n variables will have a ‘loading’ along each of the n orthogonal PCs, with high loadings indicating high correlation between the original variable and the PC. By design, the projection of the dataset along the nth PC will explain a greater fraction of the dataset than that along the n + 1th PC (i.e., the nth eigenvalue is greater than the n + 1th eigenvalue), and in many cases much of the overall variation in the dataset can be explained using the first few PCs. This can allow significant reduction in the number of dimensions needed to characterize the dataset and to undertake further analysis. The choice of how many components to retain has been guided by several approaches, including the scree (or broken-stick) test, Kaiser’s rule (that eigenvalues should be greater than 1), and the principle that components should explain at least 70–80% of the retained variance (Jackson, Citation1993).
Similar to other estimation techniques and statistical methods, PCA has limitations and caveats. First, because PCA is a linear data reduction technique, it can be affected by variable scaling. As a result, data normalizing, such as converting data to Z-scores, is often needed (Abdi & Williams, Citation2010). Second, PCA is particularly prone to misleading conclusions in the presence of outliers (Sapra, Citation2010). Finally, when a large number of variables are available some initial reduction in dimensionality is desirable before applying any PCA-type search for principal modes, such as the proposed method by Johnstone and Lu (Citation2009) of sparse PCA. These limitations notwithstanding, the PCA framework can provide considerable clarity, beyond conventional regression analyses, in outlining key dimensions of variation in a dataset.
We develop a PCA framework to characterize the underlying dimensions of land-use change, identify trajectories over time, and draw comparisons across states in the Brazilian Legal Amazon. With this framework, we are able to contextualize existing case-study research and characterize areas outside of recent research focus that appear critical for understanding the broader notion of change across the Amazon Basin. We draw from a broad set of variables from the 1996 and 2006 agricultural censuses to describe the principal dimensions of change in farming trajectories across space and time. Specifically, we assess how these dimensions change through time within spatially defined administrative groupings (i.e., municipalities and states of the Brazilian Legal Amazon) and more broadly across functional groupings of these units.
2. Data, area of study, and methods
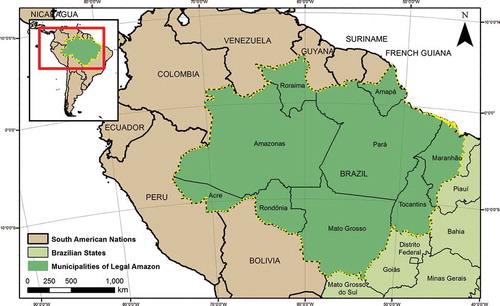
The focus of our study is the set of municipalities (n = 626 in 1996, n = 760 in 2006) grouped by the Brazilian Institute for Geography and Statistics (IBGE) as the Brazilian Legal Amazon, a region spanning nine federal units (states) and encompassing the Brazilian share of the Amazon biome (Map 1). In this analysis, we used municipality-level observations for each member of this set from the Brazilian Agricultural Census for the years 1996 and 2006, available through an IBGE online database (www.sidra.ibge.gov.br). The first agricultural census in Brazil was conducted in 1920 and to date a total of nine (1920, 1950, 1960, 1970, 1975, 1980, 1985, 1996, and 2006) have been completed. The survey is extensive in nature including questions on crop production, animal stocks and production, machinery, workforce and labor characteristics, property holdings, and land use. These data are provided in raw form and summarized on the IBGE website at the municipality, state, and national levels approximately 2 years after the completion of each project.
Due to changes in the agricultural census and inconsistencies between data collected in different years, we focused on the subset of data that were consistently reported for 1996 and 2006, constructing 12 variables that are comparable between these periods and provide signals of municipal-level farming characteristics (i.e., property size and distribution, production of crops and livestock, and the use of land, labor, and capital) (calculations shown in ; mean values reported in ). These variables were normalized into z-scores. Any municipalities having one or more z-scores greater than five across the 12 variables were considered outliers and removed (n = 24) (Figure S1). The value of five was chosen such that removal of outliers eliminated artifactual arch effects in ordination plots of the resulting PCAs (Figures S2 and S3).
Table 1. Derivation of municipal-level variables included
Table 2. Descriptive statistics for municipal-level variables included
We first performed PCAs on the full dataset including normalized observations for 1996 and 2006, and for each component examined the variable loadings and spatial distribution across the Amazon landscape. We restricted our analyses to the PCs explaining a greater fraction of variance than 10% – in this case, the first four components, which explain 80% of the total variance across the 12 selected variables. As described below, the addition of a fifth component (PC 5) only added 8% to the overall explained variance and was not included (). Based on the interpretation of the loadings of each of the original 12 variables, we linked each of these four components to a predominant type of land-use/land-cover scenario or farming trajectory. (For PCAs that analyze the 1996 and 2006 datasets separately, i.e., showing changes strictly occurring across space, see Online Supplemental Material Figures S4–S7.) Next, to examine heterogeneity within predefined administrative spatial units or groupings, we plotted the change in each PC across the 10-year period between censuses for the subset of municipalities conserved between the two census years (n = 566), grouped by state. Lastly, to observe functional patterns of change across the basin and how well such characterizations fit, we separated the PCA into the 1996 and 2006 subsets, and mapped two types of cluster analysis using the four components: k-means clustering (Lloyd, Citation1982) and fuzzy c-means clustering (Bezdek, Ehrlich, & Full, Citation1984). A number of cluster combinations were tested using k-means clustering (n = 2 through 6), though all combinations resulted in cluster members with low silhouette values, indicating similarities to neighboring clusters (Online Supplemental Material Figures S8–S12). To accommodate these smoother transitions among clusters, we employed fuzzy c-means clustering in which each municipality was assigned a fractional membership across all of the n clusters in the analysis. To characterize each cluster according to the PC loadings represented within them, we calculated a weighted average PC score for the kth cluster (of n clusters) using the following equation:
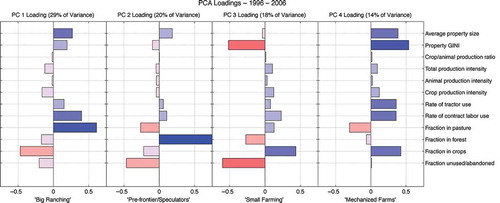
Figure 1. Variable loadings in the first four PCs for the combined 1996–2006 agricultural census dataset. Shade intensity represents the strength of the PC loadings, with bolder shades representing stronger loadings. Loadings to the left of the central axis in each PC are negative; loadings to the right of the central axis are positive.
3. Results
3.1. PCA to assess dimensions of land use
PC 1 (29% of variance) had strong loadings for pastureland and contract labor, as well as for low amounts of land in crops, and weak loadings for larger property sizes and unequal property size distributions (). We identified this dimension to be analogous to ‘Big Ranching’ or the patterns in land use, labor contracts, and property size that are consistent with this commercial type of industry. PC 2 (20% of variance) was loaded most strongly with land that was part of farms enumerated in the census but that remained in forest. We identified this dimension to represent ‘Pre-frontier/Speculation’, or municipalities with large amounts of allocated agricultural land not yet in production. Some of this land may reflect agroforestry, though loadings for the value of crop production along this dimension are low. PC 3 (18% of variance) was strongly loaded with high amounts of cropland, little amounts of abandoned or unused land, and more equitably distributed property sizes, with weaker loadings of intensive production and the use of labor and tractors. We identified this dimension to represent ‘Small Farming’. Finally, PC 4 (14% of variance) was strongly loaded with larger, unequally distributed property sizes with significant cropland, and with use of tractors and contract labor. We identified this dimension to represent ‘Mechanized Farming’, most likely capturing the larger soy or coffee production systems found in the region (though our data do not disaggregate by crop).
We also examined the change in PC scores between 1996 and 2006 for each municipality present in the dataset for both years. Mapping these changes provides a view of how these farming trajectories have manifested across the region (). Maps of these individual scores (whose difference is shown in ) are included in the Online Supplemental Material (Figure S13).
Figure 2. Changes in the first four PCs for conserved municipalities from 1996 to 2006.
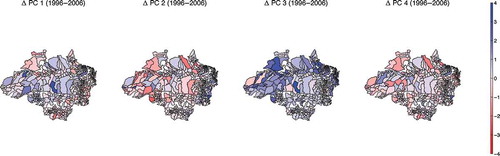
The positive change in PC 1 indicated growth in large-scale ranching across the region over this period, particularly in Rondônia, southwestern Amazonas, parts of Mato Grosso and southwestern Pará (or much of the old frontier or ‘arc of deforestation’), while PC 2 showed significant reduction in the ‘Pre-frontier/Speculation’, or forested, category in the areas along the arc of deforestation that have moved away from land held in forest. Additionally, this PC highlighted a number of areas in the interior ‘pre-frontier’ with increased amounts of forested land allocated to agriculture, along with areas of coastal Maranhão, Tocantins, and southern Mato Grosso that were at or outside the fringe of the Amazon biome, suggesting that a new frontier may be developing just inside the older established settlement zone. The positive change in PC 3 (‘Small Farming’) indicated growth in this type of land use across the region, with particular growth in interior regions such as Amazonas. Finally, the positive change in PC 4 (‘Mechanized Farming’) showed growth in this type of land use in the interior as well, with some decline in areas close to the deforestation arc.
3.2. Change in administrative groupings – federal units (states)
Next we turn to the calculation of changes in PCA loadings grouped by state (). Scores from 1996 are drawn with a small circle and are connected by a straight line to scores from 2006 drawn with a large circle. Positive changes are thus represented by large circles above the line of 1996 scores, declining trends are represented by circles below this line, and congregation along this line represents stability. In the figure, the bordering states of Tocantins and Maranhão are grouped together (these two states border the Legal Amazon with only a fraction of their municipalities both in this zone and with tropical forest); the arc of deforestation (or post-frontier) includes Acre, Pará, Rondônia, and Mato Grosso; and what we call the Amazon interior includes Amapá, Amazonas, and Roraima.
Figure 3. Changes in first four PCs in municipalities, organized by state. In each graph, a municipality’s PC score in 1996 is represented as a small circle, with the 2006 score represented by a large circle, connected to the 1996 score by a black vertical line. Municipalities are ordered from lowest to greatest 1996 PC score.
We begin with the states bordering the Amazon. Likely due to proximity and similarities in topography, Tocantins and Maranhão both found increases in small farming and land speculation (changes in PC2 and PC3) and relative stability in terms of ranching and mechanized farming (with increases that are outweighed by decreases). Next the states within the arc of deforestation exhibit two distinct patterns. Rondônia and Acre saw growth in large-scale ranching (PC1) and small-scale farming (PC3) over most of the state during the period 1996–2006 (as evidenced by the consistent, positive change in PC scores from 2006 to 1996 for these metrics), while at the same time experiencing a decline in forest on agricultural properties (i.e., the reverse trend) (PC2) and very muted shifts in mechanized agriculture (PC4). Pará and Mato Grosso as well saw growth in small-scale farming, but there appeared to be an equalizing shift in the level of forest cover, ranching, and speculation on farms – those that lacked these land-use patterns in 1996 generally rose, while those that had much in 1996 generally fell.
Second, looking along the rows in allowed us to assess variance in the PCs among and across the states. Much more of the variation in PC 2 – forest cover on farms – was in the interior states of Amazonas and Pará than in Rondônia or Mato Grosso, for which much more of the forest cover change occurred prior to 1996. In general, the changes observed for Rondônia over the period were low in magnitude compared with the other states shown.
3.3. Change across administrative groupings – clusters or functional groupings
In our last empirical step, we used two types of cluster analysis (k-means and fuzzy c-means clustering) of our four dimensions to verify how well such characterizations fit patterns of change across the basin. Several authors have undertaken the task of defining functional sub-regions for the Amazon – such as Aguiar et al.’s (Citation2007) classes of ‘Occidental’, ‘Central’, and ‘Densely Populated Arch’. To test for fit within these commonly referenced classes, these cluster analyses were performed on each subset of our combined census dataset separately (i.e., one subset for the PC scores corresponding to 1996 and one for those corresponding to 2006).
PCA and k-means clustering are related techniques as the set of PCs describes the cluster centroids of a relaxed solution to the k-means clustering algorithm (Ding & He, Citation2004). A corollary to this is that in datasets where most points have strong loadings along only one of the PC dimensions, distinct clusters may be more easily found using the k-means algorithm. This is not true for most points in our dataset – most municipalities have characteristics matching loadings along several of the first PCs (Figure S3), and not surprisingly we found that the municipalities in the dataset did not in general cluster ‘cleanly’ (Figures S8–S12). As an alternative approach, we applied the fuzzy c-means clustering algorithm, which assigns fractional membership across clusters for each municipality.
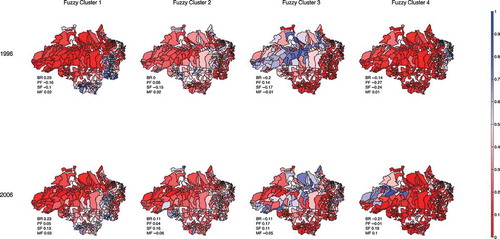
While we tested several different numbers of clusters (n = 2, 3 are shown as Figures S14 and S15), we found that n = 4 clusters provided the greatest amount of information for us to distinguish clear sub-regions and patterns of change over the study period (). In mapping out the results of the fuzzy clustering to the Brazilian Legal Amazon area, we found that the 1996 Fuzzy Cluster (FC) 1 showed a clear outer frontier dominated by ranching, while FC 2 showed an inner frontier of forested plots mixed with some ranching and mechanized agriculture. FC 3 indicated the presence of a core of largely forested properties within the Brazilian Legal Amazon, while FC 4 showed a weak development in the occidental Amazon (that clusters closely with stronger development along the eastern coast) of mechanized agriculture.
Figure 4. Fuzzy c-means clusters for n = 4 for the PC scores resulting from the combined 1996–2006 dataset, with clustering applied separátely to the 1996 and 2006 subsets. Each municipality has a fractional membership in each of the four clusters, with a fraction near 1 indicating near-complete membership in the cluster, a fraction near 0 indicating near-complete membership in other clusters, and fractions near 0.5 indicating weak membership in the cluster. PC loading fractions for each cluster are identified as BR (‘Big Ranching’), PF (‘Pre-frontier’), SF (‘Small Farming’), and MF (‘Mechanized Farming’).
Map 1. Municipalities in the Brazilian Legal Amazon Region. Note that the Legal Amazon is bounded to the east by the 44th Meridian; our analysis includes municipalities in their entirety that have some share to the west of this line, and are included in the set of IBGE-defined Legal Amazon municipalities.
The results from mapping fuzzy clusters for 2006 highlighted clear changes across the basin over the intervening decade. The sharp distinction of inner and outer frontier in the 1996 dataset yielded to two overlapping clusters (FC 1 and 2, 2006) that differed in terms of higher (FC 1) versus lower (FC 2) loadings of both ranching and mechanized agriculture. What was a strong core of forested land in 1996 became more strongly characterized by the presence of smallholder agriculture in 2006. Finally, the agricultural push from the Occident in FC 4 appeared to increase, with strong expansion of smallholder and mechanized agriculture.
4. Discussion and conclusions
Our analysis demonstrated that 80% of spatio-temporal variation across a broad set of descriptive variables in the Brazilian Amazon area could be explained by four PCs that mapped closely onto agricultural trajectories well observed in the region – large-scale ranching, under-utilized forested property (possibly in the hands of speculators), small-scale farming, and mechanized agriculture. We have been able to use these four dimensions of change to observe spatial patterns across the basin and, importantly, differences in the agricultural trajectories of the different federal units in the Legal Amazon. Importantly, the ordering of these PCs gives some insight into the relative roles these trajectories have played in observed changes over the period. Large-scale ranching accounted for the greatest share of variance – that is, explained the greatest share of change over space and time from 1996 to 2006 – in our analysis, followed immediately by growth in the amount of under-utilized forested property being registered on agricultural lands. Expansion of small-holder farming came third, explaining a greater share of spatio-temporal change than shifts in mechanized agriculture.
The PCA technique we have applied here as a means of identifying patterns of change should, in theory, be applicable to the large-n datasets more commonly evaluated via linear regression, and may prove to be of value in analyzing some of the larger intra-regional panel datasets that have been produced (e.g., Brondizio & Moran, Citation2012; Browder et al., Citation2008; Caviglia-Harris et al., Citation2009). Importantly, the PCA technique provides an additional tool for analyzing land-use change, allowing for data dimension reduction that can be used to identify patterns of different land-use types over space and time (that may not be recognized otherwise), and may complement existing tools such as random forest regression (e.g., Aide et al., Citation2013) which incorporates an attempt to measure the importance of different variables in explaining change.
It is well documented that in-migration to the Amazonia settlements, cities, and municipalities has slowed since the 1990s. At the same time, there has been a noted pattern of land conversion from small and large land owners, cattle have been expended on small and large properties (Pacheco & Poccard-Chapuis, Citation2012; Walker et al., Citation2009), all while deforestation policy has undergone changes at the state and federal levels (Brasil, Citation2012) with recent focus on REDD (Reducing Emissions from Deforestation and Forest Degradation in Developing Countries) initiatives (Gibbs, Brown, Niles, & Foley, Citation2007). These marked changes have altered both the political and physical landscape likely leading to shifts in land-use trajectories. Given the complexities of analyzing many of these concurrent drivers of change, it is difficult to summarize the resulting effects over space and time without tools like PCA.
4.1. Comparing our results to case studies: Rondônia
One of the goals in this analysis was to provide a means of comparing agricultural development across the different federal units of the Amazon region, and doing so credibly requires us to examine how well the results of the PCA analysis map onto existing case-study research. The large body of case-study literature for Rondônia provides a convenient point for comparison to the state-level analysis in the current study.
A first point of comparison is our earlier observation that changes in Rondônia over the period is muted relative to other states. This result is consistent with the idea of Rondônia as a ‘post-frontier’ state (Browder et al., Citation2008), while states such as Amazonas have been more recently accessed. Furthermore, Browder et al. (Citation2008) find expansion of pasture (between 1992–2002), massive growth in production value for farmers that had maintained or expanded the size of their lots, significantly less on-farm consumption and a shift toward more marketed product. While ranching moved toward an even bigger share overall, they found an increase in the production of cash crops. Brown, Koeppe, Coles, and Price (Citation2005) found a dramatic rise in land used for mechanized agriculture (for soybeans) in the southern Rondônia municipality of Vilhena from 1996–2001, while Caviglia-Harris (Citation2005) observed (from 1996 to 2000) significant growth in cattle, an increase in off-farm income, and an increased focus on perennials coupled with a decline in the share of crop income overall. The expansion of cattle ranching is borne out clearly in the results of the PCA analysis. While the Vilhena finding of expanded mechanized agriculture does not appear as clearly in our analysis, the general finding of a rise in the value of production and the role of cash crops, coupled with expanded opportunities for off-farm income, helps to explain the continued viability of smaller farms and the expansion observed in the PCA analysis.
4.2. Comparing our results across the Amazon: the importance of sub-regions and smaller states
As described above, we observe some consonance with the literature for areas that have been traditional foci for case-based and basin-wide studies, allowing us to draw attention to the regions in our analyses that have received comparatively less attention in the past. We observe that growth along the ‘small farming’ dimension has been coherent and positive across most states, including states outside the arc of deforestation (especially within the large interior region of Amazonas and western Pará, and eastern Tocantins). However, small farming played lesser role in Mato Grosso (a highly developed, urbanized state) and in some municipalities of Tocantins. While it would be possible to observe these patterns from more basic census variables, our analysis using PCA demonstrates how ‘small farming’ can be represented, identified, and measured as a major dimension and element of recent patterns of change.
Additionally, our PCA analysis allowed us to identify and compare the variation (or coherence) in land-use trajectories both across states and within states (i.e., regions and sub-regions). These results showed distinct patterns both in and outside the arc of deforestation. In many of the traditional ‘arc of deforestation’ areas, change was quite coherent (i.e., consistent direction of change in PCs across all municipalities in the state), indicating uniform trajectories and patterns of land use. In particular, municipalities in Rondônia showed the greatest consistency of any state in the basin in their changes over the period 1996–2006, and, thus, account for comparatively little of the overall variation. Notably, Rondônia exhibited a consistent growth in ranching across municipalities that is not observed across municipalities in any other state in the region, except possibly Acre. This may or may not be reflective of effective state-level policies and programs aimed at promoting and improving ranching activity; at its very least, it suggests that an understanding of ranching in Rondônia can tell us little about ranching impacts elsewhere. Pará exhibits a unique ‘equalizing’ pattern of change in the amount of standing forest registered in agricultural properties, reflecting its position as a large interior state straddling the arc of deforestation. Those municipalities that in 1996 had comparatively more reported forestland on farms had lost much of it by 2006; those that had much land yet to allocate to agriculture in 1996 report more (yet under-utilized land) in 2006.
In contrast, higher variation, particularly a large fraction of the overall spatio-temporal variation, was observed in areas outside of the arc of deforestation, including the state of Amazonas, and the eastern states of Maranhão and Tocantins. Patterns of land use in these areas reflect a broad diversity of land use and farming trajectories, but the overall scenario, especially shown in our cluster analyses, highlights a trend toward increased land-use change. Amazonas experienced broad growth in smallholder farming, with some growth in mechanized agriculture in the west and ranching in the south, with a loss of forested land on farmland across many municipalities in the state; this confluence of river-transport-driven development with the northward-moving arc of deforestation in this state may provide novel perspectives of land-use change within Amazonia.
Our results provide some empirical support for the functional groupings proposed by Aguiar et al. (Citation2007) – a densely populated arc, bordered by central and occidental regions. One key caveat is that the densely populated arc is functionally heterogeneous, with ranching and mechanized farming playing different roles in different municipalities (breaking down into the FC 1 and 2 of 2006 in our analysis). Aguiar et al.’s (Citation2007) analysis characterizes the density of the occidental region as being very low, outside of areas such as Manaus, and notes the importance of river rather than highway transport in predicting deforestation and development in the region. Our analysis suggests a marked growth in agriculture and a moving frontier in this region over the decade between 1996 and 2006.
These results make the case for a ‘pinch of agricultural development’, rather than simply an arc of deforestation, with development pressures also pressing inward from the west, in particular in the municipalities with upstream river access to Manaus. This development trend is intriguing, as it does not correspond tightly with historical deforestation in the region. The Brazilian Institute for Space Research (INPE) has published annual deforestation levels since 2000; up to 2011 (the most current dataset as of the time of writing); deforestation rates remained low across the state of Amazonas, with most of it attributable to growth in the environs of Manaus and the upward push of cattle ranching from the south. This fits the narrative presented by Pacheco and Poccard-Chapuis (Citation2012), who observe that deforestation became more tightly tied to pasture over the period 1996–2006 (planted pasture rose from 69% to 74% of all cleared lands). They also observed a clear pattern of land consolidation across the typically smaller holdings of the Amazon interior, in contrast to decreasing farm sizes across most of the active and post-frontier. This pattern maps well onto the surge of mechanized farming observed upstream of Manaus in our Fuzzy Cluster 4. How this growth in small (and consolidated) holdings will manifest in landscape-scale changes in the coming years is not clear from these census data alone, highlighting again the current research potential of agricultural development and change in this Amazonian interior region.
4.3. Implications for policy and future land-use strategies
Our goal in this study was to go beyond the linear regression approach (‘Which variables correlate with change?’) that has featured in several previous basin-wide studies of the Amazon with a PCA (‘What are the underlying dimensions of change?’). Using the results of the PCA, we characterize the patterns of change for different federal unit states within the Brazilian Legal Amazon region. Further, we hope to have demonstrated the comparative value of developing case studies for the underrepresented states including Amazonas, Tocantins, and Maranhão, which account for much of the overall spatio-temporal change observed across our chosen set of variables in the period 1996–2006. By characterizing the four principal dimensions of change and using them to define functional sub-regions, our analysis highlights several key points of relevance to designing environmental policy. First, our analysis shows an increased role for smallholder farming across all functional groupings in the Amazon. Second, the clear outer and inner frontiers observed in 1996 have become a broader, heterogeneous frontier where the presence of smallholder farming is consistent, but the role of mechanized agriculture and ranching varies. Finally, our analysis highlights the boom in smallholder and mechanized agriculture emerging within the riparian municipalities upstream of Manaus, the regional center of commerce and industry. This last result suggests the discourse of the deforestation ‘arc’ might soon be best replaced by a discourse of the agricultural development ‘pinch’.
It is striking in the ‘agricultural pinch’ in the Northwest Amazon (Fuzzy Cluster 4) that the loading of forested farmland jumps dramatically over the study period, while deforestation rates for the region remain low. This implies that the growing numbers of new and consolidated small-to-medium farms in the region are not yet able, or are not (yet) interested in clearing much of this land, and in turn suggests Amazonas is well positioned to develop programs (such as within a REDD+ context) that encourage farmers to preserve forested lands. Indeed, while the overall success of Brazil’s Proambiente payment-for-ecosystem-services scheme has been limited (Hall, Citation2008), progress in rewarding avoided deforestation has been greatest in Amazonas. Pioneering legislation at the state level and financial support from Bradesco Bank facilitates the Bolsa Floresta program, which pays stipends for families for leaving forested areas intact as well as makes payments to community associations for providing employment opportunities that do not produce smoke (Fundação Amazonas Sustentavel, Citation2012). The opportunities for growth that upstream access to Manaus appears to have provided over the period 1996–2006 may also now provide a solid foothold for REDD+ initiatives to develop in Brazil in the years ahead.
As a final note, the recent release of a new Forest Code for Brazil (Brasil, Citation2012) followed years of debate over the way in which rules for land cover should be applied to smallholder farmers in Brazil (defined as properties up to 4 fiscal modules in size, a unit which varies in size from state to state but in most cases is 60 ha). The Forest Code vetoed the requirement for these smallholders to restore land to forest cover in ‘legal reserve’, as larger properties are required to do, in a move that may favor equity and the smallholder at the expense of environmental outcomes such as forest cover and ecosystem services. It will likely be many years before the debate over provisions such as this in the new Forest Code settle down, and any impacts of these changes emerge. The growth of smallholder agriculture within every functional grouping in the Amazon demonstrated in our analysis suggests that this decision is more important now than it has been at any earlier point in Amazon agricultural development.
Online Supplementary Material
Download MS Word (4.9 MB)Acknowledgments
The authors are grateful to Dr. Tien Ming Lee for helpful advice on structuring the PCA analysis. Regarding Anthony Cak’s participation, any opinions, findings, and conclusions or recommendations expressed in this article are those of the authors and do not necessarily reflect the views of the National Science Foundation or the US Government.
References
- Abdi, H., & Williams, L. J. (2010). Normalizing data. In N. J. Salkind, D. M. Dougherty, & B. Frey (Eds.), Encyclopedia of research design (pp. 935–938). Thousand Oaks, CA: Sage.
- Aguiar, A. P. D., Câmara, G., & Escada, M. I. S. (2007). Spatial statistical analysis of land-use determinants in the Brazilian Amazonia: Exploring intra-regional heterogeneity. Ecological Modelling, 209(2–4), 169–188. doi:10.1016/j.ecolmodel.2007.06.019
- Aide, T. M., Clark, M. L., Grau, H. R., López-Carr, D., Levy, M. A., Redo, D., … Muñiz, M. (2013). Deforestation and reforestation of Latin America and the Caribbean (2001–2010). Biotropica, 45(2), 262–271.
- Aldrich, S., Walker, R. T., Simmons, C. S., Caldas, M. M., & Perz, S. (2012). Contentious land change in the Amazon’s arc of deforestation. Annals of the Association of American Geographers, 102(1), 103–128.
- Alfaia, S. S., Ribeiro, G. A., Nobre, A. D., Luizão, R. C., & Luizão, F. J. (2004). Evaluation of soil fertility in smallholder agroforestry systems and pastures in western Amazonia. Agriculture, Ecosystems & Environment, 102(3), 409–414. doi:10.1016/j.agee.2003.08.011
- Arima, E. Y., Simmons, C. S., Walker, R. T., & Cochrane, M. A. (2007). Fire in the Brazilian Amazon: A spatially explicit model for policy impact analysis. Journal of Regional Science, 47(3), 541–567.
- Arvor, D., Meirelles, M., Dubreuil, V., Bégué, A., & Shimabukuro, Y. E. (2012). Analyzing the agricultural transition in Mato Grosso, Brazil, using satellite-derived indices. Applied Geography, 32(2), 702–713. doi:10.1016/j.apgeog.2011.08.007
- Asner, G. P., Broadbent, E. N., Oliveira, P. J. C., Keller, M., Knapp, D. E., & Silva, J. N. M. (2006). Condition and fate of logged forests in the Brazilian Amazon. Proceedings of the National Academy of Sciences of the United States of America, 103(34), 12947–12950. doi:10.1073/pnas.0604093103
- Barona, E., Ramankutty, N., Hyman, G., & Coomes, O. T. (2010). The role of pasture and soybean in deforestation of the Brazilian Amazon. Environmental Research Letters, 5(2), 024002. doi:10.1088/1748-9326/5/2/024002
- Batistella, M., & Moran, E. F. (2005). Human dimensions of land use and land cover in the Amazon: A contribution from LBA. Acta Amazonica, 35(2), 239–247.
- Batistella, M., Robeson, S., & Moran, E. F. (2003). Settlement design, forest fragmentation, and landscape change in Rondônia, Amazônia. Photogrammetric Engineering & Remote Sensing, 69(7), 805–812.
- Bernaert, N., De Paepe, D., Bouten, C., De Clercq, H., Stewart, D., Van Bockstaele, E., … Van Droogenbroeck, B. (2012). Antioxidant capacity, total phenolic and ascorbate content as a function of the genetic diversity of leek (Allium ampeloprasum var. porrum). Food Chemistry, 134, 669–677.
- Bezdek, J. C., Ehrlich, R., & Full, W. (1984). FCM: The Fuzzy c-means clustering algorithm. Computers & Geosciences, 10(2), 191–203.
- Bowman, M. S., Soares-Filho, B. S., Merry, F. D., Nepstad, D. C., Rodrigues, H., & Almeida, O. T. (2012). Persistence of cattle ranching in the Brazilian Amazon: A spatial analysis of the rationale for beef production. Land Use Policy, 29(3), 558–568. doi:10.1016/j.landusepol.2011.09.009
- Brasil LEI No. 12.651, DE 25 DE MAIO DE 2012 (2012). Brasilia.
- Brondizio, E. S., & Moran, E. F. (2012). Level-dependent deforestation trajectories in the Brazilian Amazon from 1970 to 2001. Population and Environment, 34(1), 69–85. doi:10.1007/s11111-011-0159-8
- Browder, J. O., & Pedlowski, M. A. (2000). Agroforestry performance on small farms in Amazonia: Findings from the Rondonia Agroforestry Pilot Project. Agroforestry Systems, 49, 63–83.
- Browder, J. O., Pedlowski, M. A., Walker, R., Wynne, R. H., Summers, P. M., Abad, A., … Joao, M.-H. (2008). Revisiting theories of frontier expansion in the Brazilian Amazon: A survey of the colonist farming population in Rondônia’s Post-Frontier, 1992–2002. World Development, 36(8), 1469–1492. doi:10.1016/j.worlddev.2007.08.008
- Brown, J. C., Koeppe, M., Coles, B., & Price, K. P. (2005). Soybean production and conversion of tropical forest in the Brazilian Amazon: The case of Vilhena, Rondônia. Ambio, 34(6), 462–469.
- Cardille, J. (2003). Agricultural land-use change in Brazilian Amazônia between 1980 and 1995: Evidence from integrated satellite and census data.Remote Sensing of Environment, 87(4), 551–562. doi:10.1016/j.rse.2002.09.001
- Carreiras, J. M. B., Pereira, J. M. C., Campagnolo, M. L., & Shimabukuro, Y. E. (2006). Assessing the extent of agriculture/pasture and secondary succession forest in the Brazilian Legal Amazon using SPOT VEGETATION data. Remote Sensing of Environment, 101(3), 283–298. doi:10.1016/j.rse.2005.12.017
- Caviglia-Harris, J. L. (2005). Cattle accumulation and land use intensification by households in the Brazilian Amazon. Agricultural and Resource Economics Review, 43(2), 145–162.
- Caviglia-Harris, J. L., Sills, E. O., Jones, L., Saha, S., Harris, D., McArdle, S., … Powell, R. (2009). Modeling land use and land cover change in an Amazonian frontier settlement: Strategies for addressing population change and panel attrition. Journal of Land Use Science, 4, 275–307. doi:10.1080/17474230903222507
- Chomitz, K. M., & Gray, D. A. (1996). Roads, land use, and deforestation: A spatial model applied to Belize. The World Bank Economic Review, 10(3), 487–512.
- Chomitz, K. M., & Thomas, T. S. (2003). Determinants of land use in Amazônia: A fine-scale spatial analysis. American Journal of Agricultural Economics, 85(4), 1016–1028.
- Cochard-Picon, C., Pilon, R., Tarroux, E., Pages, L., Robertson, J., & Dawson, L. (2012). Effect of species, root branching order and season on the root traits of 13 grass species. Plant and Soil, 353, 47–57.
- Cochrane, M., Alencar, A., Schulze, M., Souza, C., Nepstad, D., Lefebvre, P., & Davidson, E. (1999). Positive feedbacks in the fire dynamic of closed canopy tropical forests. Science (New York, NY), 284(5421), 1832–1835.
- De Barros Ferraz, S. F., Vettorazzi, C. A., Theobald, D. M., & Ballester, M. V. R. (2005). Landscape dynamics of Amazonian deforestation between 1984 and 2002 in central Rondônia, Brazil: Assessment and future scenarios. Forest Ecology and Management, 204(1), 69–85. doi:10.1016/j.foreco.2004.07.073
- De Espindola, G. M., De Aguiar, A. P. D., Pebesma, E., Câmara, G., & Fonseca, L. (2012). Agricultural land use dynamics in the Brazilian Amazon based on remote sensing and census data. Applied Geography, 32(2), 240–252. doi:10.1016/j.apgeog.2011.04.003
- Ding, C., & He, X. (2004). K-means clustering via principal component analysis. In Proceedings of the Twenty-first international conference on Machine learning - ICML ’04 (p. 9). Banff: ACM Press. doi:10.1145/1015330.1015408
- Essa, J. A., & Nieuwoudt, W. L. (2003). Socio-economic dimensions of small-scale agriculture: A principal component analysis. Development Southern Africa, 20(1), 67–73. doi:10.1080/0376835032000065462
- Faminow, M. D. (1997). Spatial economics of local demand for cattle products in Amazon development. Agriculture, Ecosystems & Environment, 62(1), 1–11. doi:10.1016/S0167-8809(96)01116-4
- Foley, J. A., Asner, G. P., Costa, M. H., Coe, M. T., DeFries, R., Gibbs, H. K., … Snyder, P. (2007). Amazonia revealed: Forest degradation and loss of ecosystem goods and services in the Amazon Basin in a nutshell. Frontiers in Ecology and the Environment, 5(1), 25–32.
- Fraser, K., Harrison, S. J., Lane, G. A., Otter, D. E., Hemar, Y., Quek, S.-Y., & Rasmussen, S. (2012). Non-targeted analysis of tea by hydrophilic interaction liquid chromatography and high resolution mass spectrometry. Food Chemistry, 134, 1616–1623.
- Fujii, T. (2008). How well can we target aid with rapidly collected data? Empirical results for poverty mapping from Cambodia. World Development, 36(10), 1830–1842. doi:10.1016/j.worlddev.2007.10.013
- Fundação Amazonas Sustentavel. (2012). Bolsa Floresta Program. Retrieved March 1, 2013, from http://fas-amazonas.org/programa-bolsa-floresta/?lang=en
- Gibbs, H., Brown, S., Niles, J., & Foley, J. (2007). Monitoring and estimating tropical forest carbon stocks: Making REDD a reality. Environmental Research Letters, 2(4), 045023. doi:10.1088/1748-9326/2/4/045023
- Hall, A. (2008). Better RED than dead: Paying the people for environmental services in Amazonia. Philosophical Transactions of the Royal Society of London. Series B, Biological Sciences, 363(1498), 1925–1932. doi:10.1098/rstb.2007.0034
- Hotelling, H. (1933). Analysis of a complex of statistical variables into principal components. Journal of Educational Psychology, 24, 417–441.
- Huynh, K. P., & Jacho-Chavez, D. T. (2011). Firm size distributions through the lens of functional principal components analysis. Journal of Applied Econometrics, 25, 1211–1214.
- Huynh, K. P., Jacho-Chavez, D. T., Petrunia, R. J., & Voia, M. (2011). Functional principal component analysis of density families with categorical and continuous data on Canadian entrant manufacturing firms. Journal of the American Statistical Association, 106, 858–878.
- Jackson, D. A. (1993). Stopping rules in principal components analysis: A comparison of heuristical and statistical approaches. Ecology, 74(8), 2204–2214.
- Jayawardana, D. T., Ishiga, H., & Pitawala, H. M. T. G. A. (2012). Geochemistry of surface sediments in tsunami-affected Sri Lankan lagoons regarding environmental implications. International Journal of Environmental Science and Technology, 9, 41–55.
- Jobson, J. D. (2002). Applied multivariate data analysis. New York, NY: Springer Verlag.
- Johnstone, I. M., & Lu, A. Y. (2009). On consistency and sparsity for principal components analysis in high dimensions. Journal of the American Statistical Association, 104(486), 682–693. doi:10.1198/jasa.2009.0121
- Jolliffe, I. T. (2002). Principal component analysis (2nd ed.). Springer series in statistics. New York, NY: Springer.
- Jongman, R. H. G., Ter Braak, C. J., & Van Tongren, O. F. (1995). Data analysis in community and landscape ecology (p. 299). Cambridge: Cambridge University Press.
- Kaimowitz, D., & Angelsen, A. (1998). Economic models of tropical deforestation: A review (p. 153). Bogor: CIFOR.
- Lambin, E. F., Turner, B. L., Geist, H. J., Agbola, S. B., Angelsen, A., Bruce, J. W., … Folke, C. (2001). The causes of land-use and land-cover change: Moving beyond the myths. Global Environmental Change, 11(4), 261–269. doi:10.1016/S0959-3780(01)00007-3
- Laurance, W. F., Albernaz, A. K. M., Fearnside, P. M., Vasconcelos, H. L., & Ferreira, L. V. (2004). Deforestation in Amazonia. Science, 304(May), 1109–1111.
- Laurance, W. F., Albernaz, A. K. M., Schroth, G., Fearnside, P. M., Bergen, S., Venticinque, E. M., & Da Costa, C. (2002). Predictors of deforestation in the Brazilian Amazon. Journal of Biogeography, 29(5–6), 737–748. doi:10.1046/j.1365-2699.2002.00721.x
- Legendre, P., & Legendre, L. (1998). Numerical ecology (p. 853). Amsterdam: Elsevier.
- Lloyd, S. (1982). Least squares quantization in PCM. IEEE Transactions on Information Theory, 28(2), 129–137. doi:10.1109/TIT.1982.1056489
- Lordan, G., Soto, E. J., Brown, R. P. C., & Correa-Valez, I. (2012). Socioeconomic status and health outcomes in a developing country. Health Economics, 21, 178–186.
- Macedo, M. N., Defries, R. S., Morton, D. C., Stickler, C. M., Galford, G. L., & Shimabukuro, Y. E. (2012). Decoupling of deforestation and soy production in the southern Amazon during the late 2000s. Proceedings of the National Academy of Sciences of the United States of America, 109(4), 1341–1346. doi:10.1073/pnas.1111374109
- Merry, F. D., Sheikh, P. A., & Mcgrath, D. G. (2004). The role of informal contracts in the growth of small cattle herds on the floodplains of the Lower Amazon. Agriculture and Human Values, 21(4), 377–386. doi:10.1007/s10460-003-1246-y
- Michalski, F., Peres, C. A., & Lake, I. R. (2008). Deforestation dynamics in a fragmented region of southern Amazonia: Evaluation and future scenarios. Environmental Conservation, 35(2), 93–103. doi:10.1017/S0376892908004864
- Nelson, G. C., & Hellerstein, D. (1997). Do roads cause deforestation? Using satellite images in econometric analysis of land use. Agricultural Economics, 79(February), 80–88.
- Nyaga, E. K., & Doppler, W. (2009). Combining principal component analysis and logistic regression models to assess household level food security among smallholder cash crop producers in Kenya. Quarterly Journal of International Agriculture, 48, 5–23.
- Pacheco, P., & Poccard-Chapuis, R. (2012). The complex evolution of cattle ranching development amid market integration and policy shifts in the Brazilian Amazon. Annals of the Association of American Geographers, 102(6), 1366–1390. doi:10.1080/00045608.2012.678040
- Pearson, K. (1901). On lines and planes of closest fit to systems of points in space. Philosophical Magazine, 2, 559–572.
- Pfaff, A. S. P. (1999). What drives deforestation in the Brazilian Amazon? Journal of Environmental Economics and Management, 37, 26–43.
- Richards, C. L., Rosas, U., Banta, J., Bhambhra, N., & Purugganan, M. D. (2012). Genome-wide patterns of arabidopsis gene expression in nature. PLoS Genetics, 8, 482–495.
- Rindfuss, R. R., Walsh, S. J., Mishra, V., Fox, J., & Dolcemascolo, G. P. (2003). Linking household and remotely sensed data: Methodological and practical problems. In J. Fox, R. R. Rindfuss, S. J. Walsha, & V. Mishra (Eds.), People and the environment: Approaches for linking household and community surveys to remote sensing and GIS (p. 338). Dordrecht: Kluwer Academic Publishing Group.
- Rodrigues, A. S. L., Ewers, R. M., Parry, L., Souza, C., Veríssimo, A., & Balmford, A. (2009). Boom-and-bust development patterns across the Amazon deforestation frontier. Science (New York, NY), 324(5933), 1435–1437. doi:10.1126/science.1174002
- Sapra, S. K. (2010). Robust vs. classical principal component analysis in the presence of outliers. Applied Economics Letters, 17, 519–523. doi:10.1080/13504850802046989
- Scheffler, R., Neill, C., Krusche, A. V., & Elsenbeer, H. (2011). Soil hydraulic response to land-use change associated with the recent soybean expansion at the Amazon agricultural frontier. Agriculture, Ecosystems & Environment, 144(1), 281–289. doi:10.1016/j.agee.2011.08.016
- Seligson, M. (2008). The renaissance of political culture or the renaissance of the ecological fallacy? Comparative Politics, 34(3), 273–292.
- Sheikh, P. A., Merry, F. D., & McGrath, D. G. (2006). Water buffalo and cattle ranching in the Lower Amazon Basin: Comparisons and conflicts. Agricultural Systems, 87(3), 313–330. doi:10.1016/j.agsy.2005.02.003
- Siegmund-Schultze, M., Rischkowsky, B., Da Veiga, J. B., & King, J. M. (2007). Cattle are cash generating assets for mixed smallholder farms in the Eastern Amazon. Agricultural Systems, 94(3), 738–749. doi:10.1016/j.agsy.2007.03.005
- Simon, M. F., & Garagorry, F. L. (2006). The expansion of agriculture in the Brazilian Amazon. Environmental Conservation, 32(3), 203. doi:10.1017/S0376892905002201
- Subramanian, S. V., Jones, K., Kaddour, A., & Krieger, N. (2009). Revisiting Robinson: The perils of individualistic and ecologic fallacy. International Journal of Epidemiology, 38(2), 342–360, author reply 370–373. doi:10.1093/ije/dyn359
- Summers, P. M., Browder, J. O., & Pedlowski, M. A. (2004). Tropical forest management and silvicultural practices by small farmers in the Brazilian Amazon: Recent farm-level evidence from Rondônia. Forest Ecology and Management, 192(2–3), 161–177. doi:10.1016/j.foreco.2003.12.016
- Taylor, P., Leite, C. C., Costa, M. H., de Lima, C. A., Ribeiro, C. A. A. S., & Sediyama, G. C. (2011). Historical reconstruction of land use in the Brazilian Amazon (1940–1995). Journal of Land Use Science, 6(1), 33–52. doi:10.1080/1747423X.2010.501157
- Walker, R., Browder, J., Arima, E., Simmons, C., Pereira, R., Caldas, M., … Zen, S. D. (2009). Ranching and the new global range: Amazônia in the 21st century. Geoforum, 40(5), 732–745. doi:10.1016/j.geoforum.2008.10.009
- Weinhold, D. (1999). Estimating the loss of agricultural productivity in the Amazon. Ecological Economics, 31(1), 63–76. doi:10.1016/S0921-8009(99)00055-5
- Weinhold, D., & Reis, E. (2008). Transportation costs and the spatial distribution of land use in the Brazilian Amazon. Global Environmental Change, 18(1), 54–68. doi:10.1016/j.gloenvcha.2007.06.004
- Yamada, M., & Gholz, H. L. (2002). An evaluation of agroforestry systems as a rural development option for the Brazilian Amazon. Agroforestry Systems, 55, 81–87.