
Abstract
Forest transitions cannot be separated from the overall changes in land uses and land cover patterns. On a local scale, these changes relate closely to values and preferences which people set on different land use strategies. We have analysed the dynamics of forested land cover over the last 50 years in Zanzibar, Tanzania, in relation to farmers’ material and non-material place-based forest benefits. Our results show that forest change patterns are emerging from the adaptations of farmers’ traditional land use practices to prevailing physical site conditions and accessibility and availability of resources. External forces, such as government intervention in the form of planting and gazetting, have had a substantial influence on the increase in forest cover during the last couple of decades but also challenged farmers to adapt to changing land use regimes. Our study implies that forest management and land use planning efforts, such as community forest management processes implementing REDD+, would substantially benefit from a place-sensitive interpretation of forest transitions on a local scale. This would enhance genuine participation of the locals in producing place-based forest benefit maps and expressing their values and preferences in terms of land use planning.
Introduction
Forests are complex socio-ecological systems, which are extensively overused throughout the globe, especially in the tropical regions. It has been estimated that about 6 million hectares of primary forest is lost globally each year due to agriculture, logging, and other human activities (FAO, Citation2010; Lambin et al., Citation1999). For many decades, governments and the global community have tried to tackle the issue of forest deterioration, but the mechanisms leading to forest degradation relate to complex dynamics of physical, social, economic, and cultural factors (Brink & Eva, Citation2009; Lambin et al., Citation2001; Paré, Söderberg, Sandewall, & Ouadba, Citation2008). While poverty and reliance on wood-based energy are globally recognised bottlenecks (FAO, Citation2008), extensive conversion of forests into agricultural land is one of the main causes of forest losses in the tropics (Barbier, Citation2004). External socio-economic changes drive and influence forest transitions on broader scales, but the interlinked socio-ecological processes are the ones which trigger land use changes on local scales. These dynamics materialise as various land use and land cover transitions and cause temporary and permanent forest losses in the landscape (Lambin & Meyfroidt, Citation2010).
Forest cover and land use transitions can be studied retrospectively with geographical data sets over the decades, and many practical efforts have shown the power of change detection in the argumentation of forest losses and their sustainable management (Cabral, Vasconcelos, Oom, & Sardinha, Citation2010; Hartter, Lucas, Gaughan, & Aranda, Citation2008; Kennedy, Cohen, & Schroeder, Citation2007; Mertens & Lambin, Citation2000). The advantage of detailed, historically extensive land cover change analyses is that they may reveal those socio-ecological feedback mechanisms, which explain land use and forest changes (Brink & Eva, Citation2009; Lambin, Helmut, Geist, & Lepers, Citation2003). As forest cover changes are rarely just simple conversions from one cover type to another but rather continuous transition of land characteristics through cyclical, linear, secular, and reversible processes with variable time lags (Antrop, Citation1998; Bürgi & Russell, Citation2001; Käyhkö, Fagerholm, Asseid, & Mzee, Citation2011), establishing meaningful information about forest changes is not a straightforward process. Automated change detection tools often fail to see the cyclical, rapid and subtle changes that are typical to forests with shifting land uses due to overgeneralised classifications or imprecise sampling designs (Serneels, Linderman, & Lambin, Citation2007; Southworth, Citation2004). Furthermore, mapping and measurement of forests can be carried out on different scales, over varying time periods, and based on very controversial classification schemes (Hett, Castella, Heinimann, Messerli, & Pfund, Citation2012). For example, conversion of indigenous forests to domestic forests (e.g. agroforests) is not necessarily visible in the change statistics (Lambin & Meyfroidt, Citation2010). Identifying forest loss simply as deforestation would be misleading since the dynamic land use regimes of domestic forests create gradual patterns of regrowth and clearance. Eventually, what may improve the value of change detection is the success of identifying what type of forest change patterns are typical to a particular site or area, how do these patterns vary explicitly in space and time, and what internal and external mechanisms may drive these changes.
It has been stated that forest transitions cannot be separated from the overall changes in land uses and land cover patterns. It has also been acknowledged that land use changes relate closely to values and preferences people set on different land use choices and strategies (Barbier, Burgess, & Grainger, Citation2010). As land cover transitions occur on various spatial and temporal scales, interpretations of these dynamics are always sensitive to site characteristics and level of detail (Rudel et al., Citation2005). For example, shifting agriculture, which is extensively practised around the world as a highly variable cropping/fallow system, creates dramatically different consequences to local forest conditions (Hett et al., Citation2012; Mertz, Citation2009). On local scales, forest change patterns are manifestations of underlying land valuation processes, which communities generate and produce over many generations. Dependency on forest resources and everyday experiences of different places have gradually evolved into commonly approved values and meanings attached to forests and resulted in various forest use practices (Ingold, Citation1993; Pickels, Citation1985; Relph, Citation1976; Stephenson, Citation2008; Tuan, Citation1977; Williams & Patterson, Citation1996).
One way of investigating the interplay between people and forests is to consider forests as providing various goods and services for people (Haines-Young & Potschin, Citation2013; MEA, Citation2003). Forests offer valuable commodities, such as timber, firewood, and wild fruits, and support several intangible benefits for most of the subsistence-based communities in the tropics (FAO, Citation2010; Hartter et al., Citation2008; MEA, Citation2003; Solomon et al., Citation2007; UNEP, Citation2007). Forests also form the foundation for many supporting services, such as water circulation, on which human systems depend (Rudel et al., Citation2005). These ecosystem functions and their realisation as services to people can be can be modelled on coarser scales using, for example, land cover data sets (e.g. FAO land cover classification), various forest and land transition models, and economic projections (Brink & Eva, Citation2009; Verburg, Neumann, & Nol, Citation2011). However, most of the models and hypotheses of forest changes have been made at national and regional levels and there is a lack of local-scale studies (Lambin & Meyfroidt, Citation2010). To interpret such an amalgamated socio-ecological system, models of both forest cover transitions and forest services to people are needed. On a local scale, it is possible to study explicitly how forest cover or stock retrospectively changes in space and time (Hayes & Sader, Citation2001; Lambin et al., Citation2003; Mapedza, Wright, & Fawcett, Citation2003; Mertens & Lambin, Citation2000; Verburg, Overmars, Huigen, de Groot, & Veldkamp, Citation2006). It is also possible to collect place-specific information about how local farmers obtain different material and non-material benefits from forests for their daily needs.
It has been successfully shown that community stakeholders are able to identify and map different place-based ecosystem services (Bernard, Barbosa, & Carvalho, Citation2011; Black & Liljeblad, Citation2006; Brown, Citation2005; Brown, Reed, & Harris, Citation2002; Bryan, Raymond, Neville, & Hatton MacDonald, Citation2010; Carver et al., Citation2009; Raymond et al., Citation2009; Sherrouse, Clement, & Semmens, Citation2011). These sites can be interpreted as providing benefits which people obtain from forests and ecosystems in general (Fagerholm, Käyhkö, Ndumbaro, & Khamis, Citation2012). Interpretation of place-based landscape services is rewarding, as it opens access to direct knowledge about forest land uses and related values. Participatory mapping provides richer and more straightforward means of interpretation of human systems compared to, for example, non-spatial participatory approaches, statistical data, or expert interviews (Corbett et al., Citation2006). The strength of empirical mapping methods is that they are based on the true local knowledge of the distribution of landscape benefits. Stakeholder involvement has also the potential to deepen the assessment and appreciation of the non-material, intangible benefits that the landscape and ecosystems provide to humans (Fagerholm et al., Citation2012; Vejre, Søndergaard Jensen, & Jellesmark Thorsen, Citation2010). These cultural landscape services have quite often been limited to mapping few indicators, such as recreation and tourism (O’Farrell et al., Citation2010; Willemen, Hein, van Mensvoort, & Verburg, Citation2010).
We aim to interpret spatio-temporal dynamics of forested land cover over the last 50 years in relation to place-based individual and collective services which local farmers have identified and mapped over the landscape. We work under the assumption that these place-based landscape benefits in a rural subsistence community are cumulative reflections of the direct and indirect values which humans place on the land and the forests. First, we aim to identify what type of forest transitions and change trajectories are typical in the study area over the last 50 years. Then, we analyse the mapped place-based landscape services spatially and aim to interpret how they interact with the identified forest changes. Finally, we discuss how our spatial approach contributes to the improved understanding and management of the local scale forest transitions and land cover changes and farmers’ associated land use preferences.
Materials and methods
Community forests of Zanzibar Island in Eastern Africa
The Coastal Forests of Eastern Africa extend from southern Somalia to southern Mozambique, and are part of the Swahilian regional centre of endemism (Burgess & Clarke, Citation2000). These forests are extensively threatened by agricultural expansion and extraction of forest materials. According to FAO (Citation2010), Tanzania is one of the Eastern African countries facing severe deforestation. Due to human influences, once extensive coastal forest landscape has fragmented, and old-growth forest patches can only be found scattered along the coastal region. Today, indigenous mature forests are estimated to cover less than 20% of the Zanzibar Islands, and these remnants concentrate mainly to forest reserves and national parks (Department of Commercial Crops, Fruits and Forestry [DCCFF], Citation2008). The contemporary Zanzibar landscape is characterised by a mosaic of cultivated and managed forest land. Roughly speaking, the western part of the island is dominated by a mixture of urban, semi-urban, and agroforest landscapes, while the eastern part hosts vast areas of coral rag forests and thickets, which are managed through traditional community-based land use regimes (Kombo and Kitwana, Citation1997; Törhönen, Citation2004).
Forestry, together with agriculture and hunting, contributes to the national economy of Tanzania with approximately 30% of the gross domestic product (MFEA, Citation2010). However, the socio-economic importance of the forest products associated with both native and planted vegetation is relatively much higher for the subsistence-based economies in the country’s rural population (Tamrini, Citation2009). Forests form the fundamental basis for the agricultural and silvicultural practices and livelihoods of the local farmers. In addition to material benefits, forests host a diversity of intangible benefits in the form of practising traditional beliefs, aesthetic and intrinsic values, and social communication, all contributing significantly to the well-being of the rural forest-dependent communities (Fagerholm & Käyhkö, Citation2009; Fagerholm et al., Citation2012; Sitari, Citation2005).
The Zanzibarian authorities, and also the local communities, have expressed concern over the long-term sustainability of their forest resources. The first forest reserve was established by the government in the 1960s, and since then, forest deterioration has been slowed down by extensive plantations of mainly exotic forest trees and by establishment of several gazetted indigenous and planted forest reserves (DCCFF, Citation2008). Foreign donors, especially the Government of Finland, have actively been collaborating with the Revolutionary Government of Zanzibar since the 1980s to establish forest-sector activities in Zanzibar (ZFDP, Citation1997). These interventions have not only involved supporting extensive plantations but also included establishment of forest administration and training of foresters to work for the Zanzibar Government. Participation of the local communities in forest management was taken into active agenda during the 1990s through Resource Use Management Agreements (RUMA). Currently such activities are strongly promoted in conjunction with REDD+ piloting (Reducing Emissions from Deforestation and Forest Degradation; UN-REDD Programme, Citation2009) and implementation of Community Forest Management Agreements(CoFMA) (MANR, Citation2011). Despite extensive plantations and community involvement in setting up their own plantations, forests are deteriorating due to intensive population growth (annual increase 3.1%; OCGS, Citation2010), poverty of the rural population, and increasing land use pressures driven both by internal and by external factors (DCCFF, Citation2008).
The present study is conducted in two neighbouring administrative regions of Cheju (pop. 1800) and Unguja Ukuu Kaebona (pop. 1320) (). These communities are, for large part, subsistence-based, and approximately half of the population (54%) live below the basic needs poverty line (OCGS, Citation2010). The tangible and intangible values and benefits provided by the forests are manifold. The western part of Cheju, with lowland, deep fertile soil, hosts permanent cultivation, but otherwise local land use regimes are highly diverse mixtures of agroforestry and forest management on porous but fertile coral rag soils. The landscape is dominated by semi-open grasslands, encroached evergreen, and semi-deciduous bushes, as well as high forests and natural thickets (Williams, Basha, Mtumwa, & Mussa, Citation1997). The study site lies partly within the Jozani–Chwaka Bay National Park (JCBNP, 5000 ha), which was established in its full extent in 2004 from the Jozani Forest Reserve, Unguja Ukuu Forest Plantation Reserve, and Chwaka Bay mangrove forest (CNR, Citation1997; Tamrini, Citation2009). At present, the National Park restricts the use of its resources by local communities. To compensate the effects on the surrounding communities, a revenue generation mechanism from visitor profits has been implemented (Tamrini, Citation2009). Collaborative forest management in Zanzibar has the longest history in Cheju, where in cooperation with the Government, the Cheju Shehia Forest Management Plan was first drawn up in 1997 (Williams et al., Citation1997).
Figure 1. The tropical island of Unguja (1700 km2, population 700,000, OCGS, Citation2010) is the largest of the Zanzibar Islands in Tanzania. The population is highly concentrated in the western urban area, while the rest of the island remains rural. The case study area is located in the south-central part of the island.
Land cover data and retrospective forest transitions
Land cover data were compiled from four sets of vertical aerial photographs of the study area from 1952–1953, 1977–1978, 1989–1990, and 2004–2005. These materials were obtained from the Department of Urban and Rural Planning (DoURP, formerly DoSUP) in Zanzibar town. The contemporary panchromatic normal-colour images were combined with historical panchromatic black-and-white photographs, which we processed into digital stereo-models and orthoimages for land cover interpretation using Leica Photogrammetric Suite in ERDAS IMAGINE (9.0; Intergraph Corporation 2012, Essen, Germany). All images were georectified and mosaicked into the UTM 37 South map coordinate system (Datum Arc1960, spheroid Clarke 1880).
Land cover information was created through a visual interpretation of the orthoimages on the scale of 1:8000. Forest land cover data were delineated from the digital four-sequence aerial photograph data (T1–T2–T3–T4) into vector-based map data using ArcGIS 10 (ESRI, 2011). A simple land cover classification consisting of three classes (open land, semi-open land, and closed land) was used. This structural classification was based on the use of within-patch tree/scrub density as a criteria for class separation (open land <25% scrub/tree cover, closed land >75%). Such a classification illustrates the horizontal gradient from open to closed forest covers typical to coral rag landscapes and shifting agriculture (Käyhkö et al., Citation2011), but it does not specify any other types of land cover parameters (e.g. forest height and species). Individual vector layers were converted into 10 m × 10 m resolution cell data, which was sufficient to sustain the minimum mapping unit of the digitised polygons. Each time layer was transformed into a shared point lattice database, which had the same point frequency as the original cells.
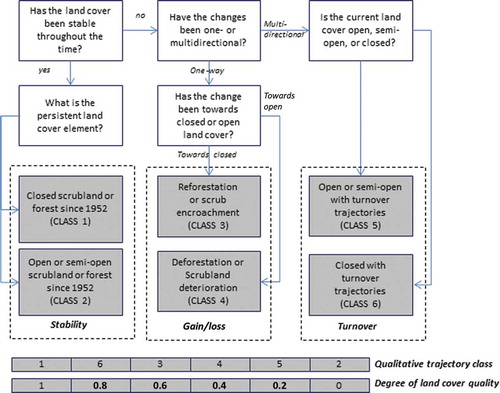
Retrospective change trajectories describing forest cover changes were calculated for each cell from 2004 to 1953, resulting with 81 individual combinations of change trajectories. These individual trajectories were classified into six different qualitative change trajectory classes using a decision tree shown in . These classes reflected stability, gain, loss, and turnover transitions of land (forest) cover from 1953 to 2004. These classes were further scaled into a continuous variable indicating the degree of land cover quality in the area. This variable ranges from closed stable land cover areas (value 1) to open stable sites (value 0) following the idea that the more forested or scrub-covered the landscape has been over the decades, the higher the quality is.
Figure 2. Individual land cover change trajectories (n = 81) were classified into six different qualitative change trajectory classes using a decision tree. These trajectories reflect stability, gain, loss, and turnover patterns of land cover changes. These trajectories were further scaled into degree of land cover quality following the idea that the more forested or scrub-covered landscape has been over the decades, the higher is the quality of the land cover.
Place-based landscape services as generalised patterns of land uses and community benefits
Place-based landscape service data, describing the material and non-material benefits of the local communities, were collected during a participatory mapping campaign organised in Cheju and Unguja Ukuu Kaebona in 2010–2011. During this campaign, 218 community members (8% of the adult population) participated in individual semi-structured interviews mapping indicators for landscape services (Haines-Young & Potschin, Citation2010; Termorshuizen & Opdam, Citation2009) on an aerial image map. A detailed description of the community mapping campaign and data processing is given in Fagerholm et al. (Citation2012). For the purpose of this study, individual farmer landscape services were produced into generalised spatial data of land use patterns to reflect interactions of the communities with the forests. Based on the spatial distribution, intensity, diversity, relationships, and descriptive attributes of the 18 mapped landscape service indicators, four data layers, namely community-based dominant land use and resources (a), community-based non-material landscape benefits (b), richness (c), and intensity (d), were established ().
Figure 3. The process of creating generalised spatial data of land use patterns into four layers (a–d) based on the participatory mapping of 18 landscape services by local farmers.
The dominant land use and resources layer (a) was interpreted from the 13 material landscape service indicators together with contemporary land cover and land use (LC/LU) data. First, a map of seven different LC/LU classes based on a visual interpretation of the 2004–2005 orthoimages was established. This map was used to assist in the interpretation of the mapped service indicators and their geographical patterns, which were then generalised into four consistent dominant land use and resource classes (1–4). The non-material landscape benefits layer (b) was interpreted from the five non-material landscape service indicators and was also reflected with the contemporary LC/LU information to establish a spatial generalisation into four classes (1–4). Layers a and b were manually delineated and classified into spatial generalisations.
The spatial intensity layer (c) was calculated through the density of landscape service points (points/ha) within 200 m × 200 m and 600 m × 600 m cell area, and by using a threshold distance of 200 and 600 m, respectively. These reflected the local scale of data collection and the broader landscape level clustering of the services. After comparing previously applied methods for creating density and abundance surfaces of landscape value points, the quadratic Kernel function (Silverman, Citation1986), creating a smoothly curved circular surface of point density for each point and summing the values in a raster cell, was selected as the method of analysis (Alessa, Kliskey, & Brown, Citation2008; Brown, Citation2005; Bryan et al., Citation2010; Sherrouse et al., Citation2011). The richness layer (d) was calculated from the original mapped service points by summing the variety of service hits in each 200 m cell (potential max. 18). Richness is a simple measurement of how many different service types are found within each cell, and as such, it indicates spatial variability of different landscape services (Farina, Citation2006). Land use patterns in layers a–d were visualised, analysed, and interpreted for their general spatial and statistical characteristics with ArcGIS. Reflection was also made to the descriptive attributes related to the landscape services.
Spatial analysis
The qualitative land cover change classes were analysed with ArcGIS and Fragstats 3.4 (McGarigal, Cushman, Neel, & Ene, 2002). Three aggregated variables describing land cover changes at the spatial resolution of 200 m × 200 m cells (4 ha) were calculated for further analysis. First, variety statistics describing the number of different change trajectories for each aggregated cell (hypothetical maximum 81) was calculated. Second, the classified qualitative change trajectories (classes 1–6) as well as the scaled land cover quality variable (0–1) were converted into aggregated cells through majority rule so that each cell expressed the most common class values.
In order to spatially compare land cover change data and generalised place-based land use pattern data, GIS overlay statistics (percentage cover of each change class within each land use class) between qualitative change trajectories and selected material and non-material land use layers having sufficient spatial coverage were calculated. Furthermore, mean and standard deviation of land cover quality (0–1) and landscape variety (1–26) were calculated within each dominant land use layer class.
Straight-line Euclidean distance from the village centres was calculated from the building data, which were visually interpreted, digitised, and delineated as areas based on the 2004–2005 orthoimages. In landscape service data, the distance from home is usually a significant variable explaining the spatial arrangement and valuation of different services (see also Brown et al., Citation2002; Fagerholm & Käyhkö, Citation2009). It was also expected to play an important role when comparing distance to potential pressures of land cover changes.
Finally, using SPSS19 (IBM Corporation, 2010), the spatial correlation between landscape change trajectory diversity, scaled degree of land cover quality, distance from settlement, landscape service richness (c), and intensity (d) were calculated. For the intensity, the correlation was calculated for both 200 and 600 m Kernel density for the whole data set and separately for material and non-material services. In addition, the data were split according to the each of the dominant land use and resources (a) and non-material landscape benefits (b) classes and the correlation was run between the same variables. The correlation was calculated as bivariate Spearman’s rho (ρ), considered suitable for the data as it allows outliers and does not require normal distribution (Ebdon, Citation1985).
Results
Land cover and forest transitions during the last 50 years
Approximately one fourth of the land area of Cheju and Unguja Ukuu Kaebona is characterised by long-term continuity of closed forest or scrubland (, class 1). The largest of these areas are the high forests towards the edge of the Chwaka Bay, around Mapopwe village, and on the northern side of Kaebona, located inside the National Park. On the contrary to these forested land areas, large open and semi-open cultivated and grassland areas (class 2) form one third of the total land area and concentrate to the northern and western part of the study area. These stability classes cover nearly 60% of the land area and have relatively low number of patches (104–180) and patch density (1.7–2.9) in the landscape. Also, the mean patch size is the highest: 7.98 ha for class 1 and 19.81 ha for class 2.
Figure 4. Qualitative land cover change classes based on the change trajectory analysis show that the largest change classes are indicating either forest/scrubland (class 1) or open and semi-open land cover stability (class 2). Gains and losses of forest cover (classes 3 and 4) through reforestation and deforestation are typically small and spatially dispersed areas in the landscape. Around 20% of the land has changed between open and closed conditions with different turnover trajectories (classes 5 and 6). The figure represents also the boundary of the Jozani–Chwaka Bay National Park, covering the eastern part of the study area.
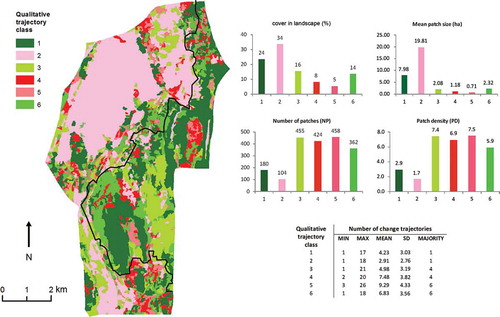
Reforestation (class 3) is most extensive in the south-eastern part of the study area (inside the National Park), and is altogether more common than deforestation (class 4), which is scattered in the landscape and covers less than 10% of the land area. However, turnover trajectories (classes 5 and 6) are quite abundant in the landscape (19%), depicting continuous transformation of land cover between open, semi-open, and closed land cover conditions. These areas are subject to rapid changes and describe consecutive deforestation and reforestation phases. Number of patches and patch density are highest for the gain, loss, and turnover trajectories, and vary between 362 to 458 patches and 5.9–7.5 patch density, respectively. On the contrary to classes 1 and 2, these change classes have the lowest mean patch sizes.
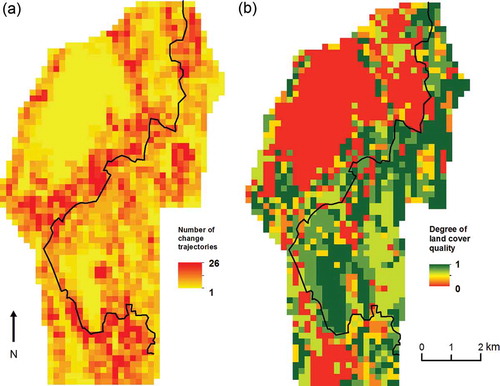
Highest number of change trajectories are found within the turnover trajectory classes 5 and 6 and within the deforestation trajectory class 4 (). Naturally, change trajectories are less abundant within the stable open and semi-open areas (class 2). Higher number of trajectories () matches with the areas of heterogeneous land cover quality (). Spatially, over 60% of the cells are characterised by less than six different change trajectories (). The degree of land cover quality shows the transition from high-quality forested areas (value close to 1) to those which have not been forested over the last 50 years (values close to 0) (). Areas of low land cover quality are large extensive areas which cover over 30% of the landscape. Both the areas of low and high quality coincide with the sites of long-term continuity of either open or closed land cover conditions (), and thus few land cover changes (). Between these extremes, land cover quality is highly variable and forms a fragmented pattern in the landscape ().
Figure 5. Two aggregated variables describing land cover changes at the spatial resolution of 200 m × 200 m cells (4 ha). The number of change trajectories (a) was calculated for each aggregated cell (hypothetical maximum 81). The degree of land cover quality (b) ranges from closed stable land cover areas (value 1) to open stable sites (value 0). Both figures represent also the boundary of the Jozani–Chwaka Bay National Park, covering the eastern part of the study area.
Land use patterns and community forest benefits
The dominant land use and resources layer (a) indicates four typical forms of land use based on the material landscape benefits. These are core benefits in village environments (1), multifunctional subsistence zone (2), permanent agriculture (3), and forest resource reserve and gathering (4) (). Examples in illustrate the nature of these material benefits as initially mapped points. Many of the material landscape benefits, especially home garden cultivation and livestock keeping, can be seen to cluster in the village environments with a relatively restricted spatial extent (class 1, 3% spatial coverage). These core areas of settlement are surrounded by an approximately a kilometre wide zone (class 2) of co-existing material benefits covering nearly half (43%) of the study area. This zone is particularly important for the subsistence activities of the local communities, the most important of which are agroforestry, shifting cultivation, and livestock keeping, followed by tree planting, collection of wild fruits, medicinal species, handicraft materials, and the extraction of coral rock and soil. Another class having primary subsistence significance is the north-western area (class 3, 19% spatial coverage), which arises as a distinctive entity in the classification with rice cultivation combined with livestock keeping and wild fruits collection. The remaining areas (35%) have a fundamental role as the forest resource reserve and gathering. These forested areas face the pressure of scattered pattern of fuel wood and construction material extraction, collection of handicraft materials, and medicinal species, answering to the subsistence needs by nearly every household.
Figure 6. Community benefits as generalised land use patterns (200 m cell size): community-based dominant land use and resources (a), community-based non-material landscape benefits (b), intensity of all mapped landscape service points as Kernel density surface as points/ha (c), and richness of all mapped landscape service points (d). For layers a and b, figures in parentheses indicate the relative (%) spatial coverage. Each figure represents also the boundary of the Jozani–Chwaka Bay National Park, covering the eastern part of the study area.
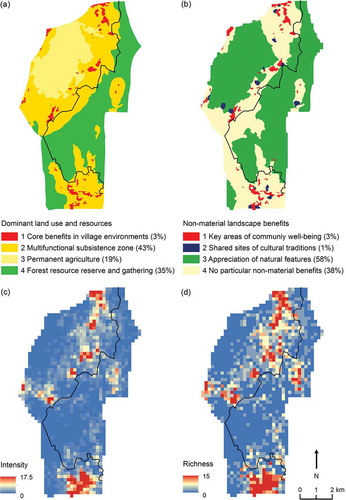
The non-material benefits layer (b) consists of four classes: key areas of community well-being (1), shared sites of cultural traditions (2), appreciation of natural features (3), and no particular non-material benefits (4) (). Examples in illustrate the nature of these non-material benefits as initially mapped points. The key areas contributing to the overall community well-being (class 1) are found in the settlement areas with sites for social interaction, possibilities for shopping, government services, and local culture cluster (class 1, 3% spatial coverage). The spatial extent is similar to that of class 1 in layer a, because the spatial generalisation followed the patterns of the settlement areas. The most significant non-material landscape benefits relate to graveyards and sites for practicing traditional beliefs, which are typically located nearby the settlement areas and shared between several families. These religious and sacred sites in nature were delineated as a distinctive class (class 2) regardless of the limited spatial coverage of 1% of the studied landscape. Over half (58%) of the landscape belongs to class 3, indicating the appreciation of natural features through aesthetic and intrinsic landscape values. These are often related to high forest areas, forest plantations, individual trees, other subjectively meaningful natural features, or to the valuation of good and deep soil properties. The fourth class (38% spatial coverage) consists of those areas that do not express any particular non-material benefits that would allow their generalisation as collective spatial patterns.
Figure 7. Spatial distribution of selected material and non-material landscape services mapped by 218 farmers during the participatory GIS campaign. Figures in parentheses indicate the absolute amount of mapped points. The boundary of the Jozani–Chwaka Bay National Park, covering the eastern part of the study area, is visualised on all maps.
When considering all 18 landscape services, the most intensive occurrence shows clustering in the settlement areas, particularly in the northern and southern sub-villages (intensity max. 17.5 points/ha, ). This pattern reflects not only the densest settlement and multiple material benefits provided by the nearby village landscape but also more significantly the tendency for people to gather to these core areas for available services, for social interaction, and for transportation to markets and urban areas. When looking at the intensity layers for material and non-material benefits separately, the non-material benefits tend to cluster more strongly in the villages (highest intensities 9.58 points/ha) compared to material benefits (highest intensities 8.83 points/ha). The richness layer (), indicating the co-existence of different landscape services, follows the same pattern with the highest richness of 15 co-existing landscape services found in the northern settlement areas. When viewing the landscape as a whole, the general tendency for spatial clustering within and nearby the settlement areas seen in and d is also indicated by the low mean values and high standard deviations of intensity (mean, 0.58; SD, 1.42) and richness (mean, 1.37; SD, 2.26).
The forest stability trajectory (1) is relatively more common within the forest resource use reserve (A4) (). While on average, the share of forest stability is around 23% (all land areas) and 19% within the subsistence zone (A2), over 40% of the land within the forest reserve areas (A4) is indicated with forest continuity from the 1950s to 2005. On the contrary to these forested areas, stability of open and semi-open land is naturally most common within the permanent agricultural area (A3, 90%). The reforestation trajectory (3) is relatively more common within the forest reserve zone (A4, 22%) compared to average 16% within the whole landscape. There is less deforestation (4) than on average (8%) within the permanent agricultural zone (A3, 4%), which is obvious since these areas are mainly open, and also within areas of no particular non-material benefits (B4, 5%). On the other hand, deforestation seems to be a relatively more common feature of the subsistence zone (A2, 12%) and within the areas of appreciation of natural features (B3, 15%). Turnover trajectories (5 and 6), which comprise 19% of the whole landscape, are especially characteristic to the subsistence zone (A2, 26%), the areas where natural features are appreciated (21%), and the forest resource reserve zone (B3, 20%). Overlay statistics show that the forest resource reserve (A4) and the subsistence zone (A2) have the highest mean values of both the degree of land cover quality and the number of change trajectories (), while the permanent agricultural zone has the lowest values.
Figure 8. Share (%) of different qualitative land cover change trajectories (1–6) within selected dominant land use (a) and non-material landscape benefit (b) classes and within the total land area (All).
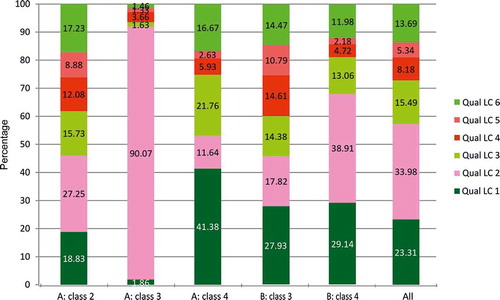
Figure 9. Mean and standard deviation of the degree of land cover quality (left) and number of change trajectories (right) in each dominant land use zone.
The spatial relationship between the landscape change data (trajectory diversity, scaled qualitative trajectories) and the existence of landscape services (richness, material, non-material) shows rather weak correlation (). High landscape change trajectory diversity and qualitative trajectories are related to high intensity of landscape services only at the resolution of 600 m, showing a weak positive correlation (0.166* and 0.159**). This trend is due to the material landscape services, which show the spatial relationship also at the 200 m resolution of intensity. The result indicates that increased land dynamics is weakly related to the occurrence of material landscape benefits. Landscape service intensity also shows a weak spatial correlation to land cover openness for the 600 m material landscape service data (–0.108**).
When the distance from settlement is compared to the landscape change data, there is a moderate negative spatial relationship to trajectory diversity (–0.339**), meaning that high trajectory diversity is associated with the settlement areas. In general, the distance to settlement correlates negatively with landscape service richness (moderately) and intensity (strongly), meaning that the most intensive clustering and richness of landscape benefits is found within and nearby the settlement areas. This especially applies to the intensity of material benefits (–0.544** for 200 m and –0.642** for 600 m material intensity compared to –0.343** and –0.505** non-material intensities, respectively).
Table 1. Spatial relationship between the landscape change trajectory diversity, degree of land cover quality, distance from settlement, landscape service richness, and intensity calculated as Spearman’s rho correlation.
Discussion
Forest dynamics and interlinked place-based benefits
This study showed that there are different types of local-scale forest transitions, which arise from the overall land use choices and associated activities of the local farmers. Due to multiple farming strategies of the families, these emerging forest change patterns are either spatially clustered or highly fragmented in the landscape. The overall patterns of forest dynamics seem to be long-term socio-ecological adaptations to prevailing physical site conditions and accessibility and availability of resources. Thus, they also reflect adaptations to practical realities of poor infrastructure and non-mechanical subsistence farming, where most of the activities associate spatially to closeness of farmers’ homes and villages (see also Fagerholm et al., Citation2012). Our results also indicate that external government intervention in the form of planting and gazetting forests have had a substantial influence on the increase in forest cover during the last couple of decades. However, these same interventions have weakened farmers’ accessibility and rights to land and limited the diversity of their forest benefits.
Site-specific continuity (stability) of forested environments is an indication of substantially lower land use pressure on the land or use of farming practices which do not remove forest cover. In practice, such areas can be found only within remote, old-growth indigenous forests or amongst the core areas of agroforestry activities. The mechanisms which sustain forest cover in these two example areas are therefore different. While the abundance of fruit trees and multistory agroforestry sustain forest cover in the vicinity of the farmlands, old-growth indigenous forests have sustained, since their edaphic site conditions are unsuitable for farming (Käyhkö, Orjala, & Mustelin, Citation2008; Kombo & Kitwana, Citation1997). Forest areas in general are an important reserve for material benefits such as fuel wood and collection of various forest materials (poles, handicrafts, medicinal species, etc.), but especially old-growth forest remnants are appreciated for their aesthetic and intrinsic values and because they form an important source of non-material benefits to local farmers.
Permanent cultivation and associated smallholder farming and forest management have generated stability of open and semi-open land covers for the study area. Since there is an extensive good quality farming area, the deep alluvial plain, in the north-western part of the study area, it allows the establishment and maintenance of permanent farming and provides valuable alternative for swidden cultivation practices. It most likely decreases the pressures to clear forests to farmlands in the subsistence zone and also within the forest reserve. However, maintenance of swidden and permanent farming practices in different edaphic site conditions secures availability of food for the poor farmers (Eilola, Käyhkö, & Fagerholm, in press). These well-established farming strategies are able to support different crop varieties, and as long as these communities depend strongly on subsistence economies, we do not foresee any major changes of these farming patterns and consequently forests.
Semi-permanent cultivation (crop rotation mixed with grazing and tree plantations) on grassland/scrubland dominates areas in the north and south-east of the study area. This type of a land use strategy clearly diversifies forest and tree cover transitions on open and semi-open land and may explain why there are less evident forest losses within the subsistence zone. More likely, scrublands are gradually converted into semi-open domestic forests (Michon, De Foresta, Levang, & Verdeaux, Citation2007; Wiersum, Citation2004). These areas manifest multiple co-existing material benefits, having interestingly hardly any non-material benefits for the farmers.
Reforestation is a constantly occurring process through natural regeneration of coral rag forest. It is especially evident amidst shifting cultivation, where low-lying scrubland occupies the land soon after ceased swidden and rotating cultivation (Hett et al., Citation2012). It is also typical within the tree-based farmland, where scrubs grow amongst planted trees. However, due to a relatively rapid rotation between the plots (usually 1 to 5 years), regenerated forest hardly ever grows to mature stands (Käyhkö et al., Citation2011). Substantial amount of reforestation is related to either family- or group-based afforestation activities or large government-run afforestation schemes, which have taken place since the 1980s (Käyhkö et al., Citation2008; Omar, Citation1994; Sitari, Citation2005; ZFDP, Citation1997). These plantations of exotic species, mainly Acacia auriculiformis and Casurina equisetifolia, have been successful in the sense that a large area in the south-west has been converted from once completely open and extensive grassland area into forested land. Family- and group-based afforestation activities have diversified the forest-related benefits and brought monetary economies into local farmers’ lives. They have also provided an alternative source of energy for cooking, but the locals seem to prefer indigenous wood for cooking and grow trees mainly for selling (Käyhkö et al., Citation2011; Sitari, Citation2005).
Deforestation is primarily caused by clearing forested land for different agricultural uses. However, usually transitions into open land are less evident, since most of the clearings are temporary due to slashing and burning or gradual modification of the indigenous vegetation into tree-based farmland. Both of these land use practices are typical to multifunctional subsistence zone and forest areas in the vicinity of the villages. As shifting cultivation comprises consecutive phases of deforestation and reforestation, the sites of deforestation in our analysis are mainly recent clearings of forested land likely to swap back into closed land. Deforestation is also evident within the government forest plantations, which are constantly harvested and replanted under the government forest plantation schemes. Permanent deforestation does not seem to be a major dilemma in the study area, but the cyclic pattern of land management obviously degrades forested environments ecologically and eventually also socially.
Turnover trajectories are typical patterns of forest transitions related largely to swidden cultivation practices. These are usually family-run activities on small plots of land, and thus generate heterogeneous and dynamic forest/open/semi-open/forest transition patterns. Shifting cultivation is characteristic throughout the subsistence zone and in some parts of the forest resource zone (mainly in the north-eastern and southern part). Some patches of turnover trajectories are created through conversion of forest through clearing back into small-holder farmland. This is typical to areas in the vicinity of the villages. On the other hand, gazetting the extension of the Jozani–Chwaka Bay National Park stopped shifting cultivation, and some of these areas were naturally regenerated into scrublands. In addition, some areas were afforested by local communities and the government soon after the establishment of the conservation area.
When observing the collective contribution of the farmers’ values and preferences on the land and the forests, one can say that material landscape benefits have a spatially scattered influence on forest patterns. This is primarily due to family-level preferences and dominance of subsistence economies. Non-material benefits, on the other hand, tend to have more spatially clustered patterns indicating shared place-based values, especially within and nearby the villages. These key areas of community well-being manifest shared cultural traditions and social interaction in combination with home gardening and keeping of domestic animals (Eilola et al., in press). The subsistence zone contributes essentially to family livelihoods, and it simultaneously creates high pressure on natural resources, particularly forests and semi-open grasslands. This is also seen as the high trajectory diversity of land cover. Deforestation is not necessarily the main threat here, since forests are gradually converted into permanent, family-run, tree-based farmland with mixtures of planted and indigenous trees and crops, thus sustaining closed and semi-open domestic forest patterns over the decades to come (Michon et al., Citation2007).
Government intervention has created an interesting interplay between internal and external forces behind forest transitions in the study area. First, government intervention through large plantations has had a clearly positive influence on the total forest stock in the area over the last decades. While generally speaking Zanzibar seems to be losing its forest cover (DCCFF, Citation2008), here the forest cover has substantially increased. Small-scale plantations do not have as evident role in forest recovery, but they have had an important role in engaging local farmers and groups of women and men in tree planting and income generation activities. In general, they also raise farmers’ awareness about forest management issues (Tamrini, Citation2009).
The National Park regulations restrict the use of forest benefits among the area’s inhabitants. However, while local farmers are allowed to collect dry wood from some of the National Park’s zones, they are also partially forced to cut and log forest materials simply due to limited resource base in the vicinity of their homes. At the same time, intangible cultural and social values attached to these forests work towards the appreciation of forest resources. While material uses are the ones which caused a direct threat of forest losses and degradation, non-material benefits are creating indirect circumstances for forest maintenance and conservation arising from the communities.
Forest areas within the established National Park reflect quite an interesting community–forest–government interplay. Many of the outcomes of these interactions are still to be seen, since the recent CoFM agreements and their follow-ups may bring forth new land use issues to discuss, especially in how land uses within forested and non-forested areas are planned. For the local farmers, all land is potential ‘forest land’ since it may be subject to regeneration of trees any day. This local interpretation of what constitutes a forest differs drastically from how forested land is defined in physical terms and interpreted as an entity in spatial planning. As Zanzibar is lacking local-level land use planning practice, it seems that CoFM is used as a surrogate. This is rather peculiar, as CoFM gives legislative and institutional entitlement only to forest management (MANR, Citation2011), but in practice it is used by authorities to execute overall land use planning on community-managed land. This will surely challenge endeavours towards local- and district-level land use planning, where forest management would be subordinate to overall land use plans, which do not exist. Perhaps it concretely draws the government’s and other stakeholders’ attention towards the critical issue of long-term forest sustainability. In this type of highly diverse and multifunctional human–forest systems, explicit measurements of forest stock today will be outdated in some years’ time.
Retrospective change analysis combined with place-based mapping of forest benefits
This study demonstrated that retrospective land use and land cover change analysis combined with place-based mapping of forest services has potential in enriching the interpretation of local-level human–forest interactions. One of the advantages is that it draws our attention to functional interactions of stakeholders and forests and links these specifically to places and forest areas in the landscape. It also directs forest interpretation towards mapping and explaining forest change processes rather than measuring forest stock and cover at one moment in time. However, both of these models of forest cover change and place-based services are generalised models of human–forest interactions, and thus have limited capability of explaining complex socio-ecological interactions behind forest dynamics.
The land cover change trajectories used in this study were based on spatio-temporal cartographic models of forest transitions. In our study, we chose to work towards meaningful trajectories, and thus used a semi-qualitative method in the initial establishment of the trajectories (e.g. Käyhkö & Skånes, Citation2008). We also established quantitative indicators, such as the number of trajectories, and used both of these to interpret key transitions which had taken place in the landscape and the qualities thereof. Our results are artefacts of the used land cover classification and change detection methods, and naturally do not represent the only possible models of forest transitions. For example, ‘stability’ of closed forest cover does not necessarily mean that there have been no changes in the land cover during the analysis period, since temporal sampling is rather sparse and changes may have happened unnoticed. However, it does indicate that the capacity of the forested land to sustain and renew is better within these stability trajectories than in some other areas. Furthermore, the fact that the correlations between the change trajectories and diversity of services were weak may simply demonstrate that the increased number of benefits does not need to lead into fragmentation and dynamics of land cover as not all benefits transform or lead into harsh land conversions. It may tell, however, that simple quantitative indicators of land cover dynamics are weak representations of the nature of changes that have taken place. Altogether, we believe that qualitative transitions were able to show the most characteristic directions of change in a subsistence-based community forest area, and most importantly, they were able to show where such changes occurred in the landscape. This spatial perspective is fundamental since it allows a genuine local-level, spatially specific discussion regarding farmer–forest–government interactions.
Our study has shown that similarities in forest change patterns do not necessarily imply that causes to transitions are the same (Lambin & Meyfroidt, Citation2010). Therefore, we may state that our landscape service or benefit mapping approach was very useful in linking the site-specific transitions to their potential causes and, even more interestingly, to their possible consequences. Instead of using individual mapped points, we chose to work at the landscape level and established collective and spatially generalised interpretations of mapped service points through their spatial patterns and descriptive attributes. These generalised patterns reflected concentrations of both material and non-material human benefits and were able to indicate benefit characteristics in a map form as well as capture the sensitivity related to the benefits. As an example, aesthetic values mean different things when indicated for the forest areas compared to village areas. Although there are different, even fully automated, ways of establishing generalisations from mapped services and physical land patterns (Sherrouse et al., Citation2011), we feel that simple quantification of the service points in relation to land covers would have limited our interpretations of their meaning and significance. We considered this interpretative delineation to reflect the actual spatial characteristics of the landscape services and their respective land cover and land use dynamics.
Long-term viability of community and government-managed forests on local scales
This study implies that forest management and land use planning on local scales would substantially benefit from a place-sensitive interpretation of forest transitions and genuine participation of the locals to produce their place-specific forest benefit maps (Guariguata, Sist, & Nasi, Citation2012; Termorshuizen & Opdam, Citation2009). We have shown that community forests possess multidimensional values to local farmers and that these values have distinctive spatial order and structure, which interact with the dynamics of the physical land patterns. Some of these benefits can be translated into direct land use pressures, which lead to either permanent or temporary forest losses and simultaneously to establishment of new semi-open and closed land conditions (Sloan, Citation2008). However, to most extent, they just simply reflect well-established customs and shared values of the local communities and demonstrate a complex human system adapted to socio-ecological realities over the generations (Lambin & Meyfroidt, Citation2010). As there is large variability in the actual transitions and their realisations, their significance depends on what land cover conditions prevailed before the changes and what forest conditions are expected to prevail afterwards and how these are associated to human benefits (Farley, Ojeda-Revah, Atkinson, & Eaton-González, Citation2012).
The efforts to tackle forest loss and degradation have insufficiently addressed the role of human–forest interactions and human values behind land use strategies and especially their spatial connotations on local scales. REDD+ has been one of the latest interventions of the global community and governments to tackle the tropical forest management challenges (Parker, Mitchell, Trivedi, & Mardas, Citation2009). REDD is expected to address human–forest interactions especially on local scales and to build operative ways to compensate countries and farmers for the prevention of forest losses (Parker et al., Citation2009). There are high hopes that participation of local actors in forest management would be able to implement the REDD+ mechanisms. It may provide income from forest protection to local communities, but these co-benefits are not guaranteed due to lack of participation of the locals in the process and due to underestimating subsistence communities’ values regarding forests (Mertz, Citation2009; Mustalahti, Bolin, Boyd, & Paavola, Citation2012). However, the success of REDD, or any other local-level forest intervention to that matter, is dependent on whether our understanding of the forest–farmer interactions is well established, and whether we are able to truly engage people into forest management. As Zanzibar is acting as one of the pilot sites for the REDD+ implementation, we foresee that the current structures of participation embedded in the CoFM process will not be able to solve how local values could genuinely be incorporated into the socially justified forest management practices (MANR, Citation2011).
Our interpretation of the soundness and sustainability of human–forest systems are often directed by the external notions and expectations of what constitutes a better environment and what drives sustainable development. These notions are driven by global concerns over the losses of tropical forests and its consequences to climate change and further to human well-being. Although we may clearly see the linkages between forest overuse, poverty, and prevalence of subsistence economies, we know that the main broad-scale threats to forest losses are related to commercialisation of forestry and agriculture (Barbier, Citation2004). While such broad-scale land conversions often lead to permanent forest losses, realities on local scales are much more dynamic and adaptable to changing social, economic and environmental conditions (Wiersum, Citation2004).
Acknowledgements
We would like to thank the Government of Zanzibar, Department of Forestry, and Non-Renewable Natural Resources (DFNR) for their guidance, facilitation, and assistance of this research in Zanzibar. The work was financially supported by the Academy of Finland (SA 8109210), University of Turku, Department of Geography and Geology, and the Laboratory of Computer Cartography (UTU-LCC).
References
- Alessa, L. N., Kliskey, A. A., & Brown, G. (2008). Socio-ecological hotspots mapping: A spatial approach for identifying coupled social-ecological space. Landscape and Urban Planning, 85, 27–39.
- Antrop, M. (1998). Landscape change: Plan or chaos? Landscape and Urban Planning, 41, 155–161.
- Barbier, E. B. (2004). Explaining agricultural land expansion and deforestation in developing countries. American Journal of Agricultural Economics, 86, 1347–1353.
- Barbier, E. B., Burgess, J. C., & Grainger, A. (2010). The forest transition: Towards a more comprehensive theoretical framework. Land Use Policy, 27, 98–107.
- Bernard, E., Barbosa, L., & Carvalho, R. (2011). Participatory GIS in a sustainable use reserve in Brazilian Amazonia. Applied Geography, 31, 564–572.
- Black, A., & Liljeblad, A. (2006). Integrating social values in vegetation models via GIS: The missing link for the Bitterroot National Forest (Final report JFSP project no. 04-2-1-114). Missoula, MT: Aldo Leopold Wilderness Institute.
- Brink, A. B., & Eva, H. D. (2009). Monitoring 25 years of land cover change dynamics in Africa: A sample based remote sensing approach. Applied Geography, 29, 501–512.
- Brown, G. (2005). Mapping spatial attributes in survey research for natural research management: Methods and applications. Society and Natural Resources, 18, 17–39.
- Brown, G. G., Reed, P., & Harris, C. C. (2002). Testing a place-based theory for environmental evaluation: An Alaska case study. Applied Geography, 22, 49–76.
- Bryan, B. A., Raymond, C. M., Neville, D. C., & Hatton MacDonald, D. (2010). Targeting the management of ecosystem services based on social values: Where, what and how? Landscape and Urban Planning, 97, 111–122.
- Burgess, N. D. and Clarke, G. P. (Eds.). (2000). Coastal forests of Eastern Africa. Gland: IUCN – The World Conservation Union.
- Bürgi, M., & Russell, E. W. B. (2001). Integrative methods to study landscape changes. Land Use Policy, 18, 9–16.
- Cabral, A. I. R., Vasconcelos, M. J., Oom, D., & Sardinha, R. (2010). Spatial dynamics and quantification of deforestation in the central-plateau woodlands of Angola. Applied Geography, 31, 1185–1193.
- Carver, S., Watson, A., Waters, T., Matt, R., Gunderson, K., & Davis, B. (2009). Developing computer-based participatory approaches to mapping landscape values for landscape and resource management. In S. Geertman & J. Stilwell (Eds.), Planning support systems best practices and new methods. Berlin: Springer Science + Business Media B.V.
- CNR (Commission for Natural Resources). (1997). A submission regarding the creation of the Jozani–Chwaka Bay National Park to replace areas of Jozani forest reserve and Unguja Ukuu forest plantation reserve. Zanzibar Town: Revolutionary Government of Zanzibar.
- Corbett, J., Rambaldi, G., Kyem, P., Weiner, D., Olson, R., Muchemi, J., … Chambers, R. (2006). Overview: Mapping for change − The emergence of a new practice. Participatory Learning and Action, 54, 13–19.
- DCCFF (Department of Commercial Crops, Fruits and Forestry). (2008). Zanzibar National Forest Resources Management Plan (2008–2020). Zanzibar: Author.
- Ebdon, D. (1985). Statistics in geography. Oxford: Basil Blackwell.
- Eilola, S., Käyhkö, N., & Fagerholm, N. (in press). Linking farmers’ knowledge, farming strategies and consequent cultivation patterns into the identification of healthy agroecosystem characteristics at local scales. Agroecology and Sustainable Food Systems.
- ESRI (Environmental Systems Research Institute). (2011). ArcGIS desktop: Release 10. Redlands, CA: Author.
- Fagerholm, N., & Käyhkö, N. (2009). Participatory mapping and geographical patterns of the social landscape values of rural communities in coastal Zanzibar, Tanzania. Fennia, 187, 43–60.
- Fagerholm, N., Käyhkö, N., Ndumbaro, F., & Khamis, M. (2012). Community stakeholders’ knowledge in landscape assessments – Mapping indicators for landscape services. Ecological Indicators, 18, 421–433.
- FAO (Food and Agriculture Organization of the United Nations). (2008). Forests and Energy, Key Issues (FAO Forestry Paper 154). Rome: Author.
- FAO (Food and Agriculture Organization of the United Nations). (2010). Global Forest Resources Assessment 2010, Main Report (FAO Forestry Paper 163). Rome: Author.
- Farina, A. (2006). Principles and methods in landscape ecology. Dordrecht: Springer.
- Farley, K. A., Ojeda-Revah, L., Atkinson, E. E., & Eaton-González, B. R. (2012). Changes in land use, land tenure, and landscape fragmentation in the Tijuana River Watershed following reform of the ejido sector. Land Use Policy, 29, 187–197.
- Guariguata, M. R., Sist, P., & Nasi, R. (2012). Multiple use management of tropical production forests: How can we move from concept to reality? Forest Ecology and Management, 268, 1–5.
- Haines-Young, R., & Potschin, M. (2010). The links between biodiversity, ecosystem services and human well-being. In D. G. Raffaelli & C. L. J. Frid (Eds.), Ecosystem ecology: A new synthesis. Cambridge: Cambridge University Press.
- Haines-Young, R., & Potschin, M. (2013). Common international classification of Ecosystem Services (CICES): Consultation on version 4, August–December 2012 (EEA Framework Contract No EEA/IEA/09/003). Retrieved from www.cices.eu or www.nottingham.ac.uk/cem
- Hartter, J., Lucas, C., Gaughan, A. E., & Aranda, L. L. (2008). Detecting tropical dry forest succession in a shifting cultivation mosaic of the Yucatán Peninsula, Mexico. Applied Geography, 28, 134–149.
- Hayes, D. J., & Sader, S. A. (2001). Comparison of change detection techniques for monitoring tropical forest clearing and vegetation regrowth in a time series. Photogrammetric Engineering and Remote Sensing, 67, 1067–1075.
- Hett, C., Castella, J.-C., Heinimann, A., Messerli, P., & Pfund, J.-L. (2012). A landscape mosaics approach for characterizing swidden systems from a REDD+ perspective. Applied Geography, 32, 608–618.
- IBM Corporation. (International Business Machines Corporation). (2010). IBM SPSS Statistics for Windows, Version 19.0. Armonk, NY: Author.
- Ingold, T. (1993). The temporality of the landscape. World Archaeology, 25, 152–174.
- Käyhkö, N., Fagerholm, N., Asseid, B. S., & Mzee, A. J. (2011). Dynamic land use and land cover changes and their effect on forest resources in a coastal village of Matemwe, Zanzibar, Tanzania. Land Use Policy, 28, 26–37.
- Käyhkö, N., Orjala, M., & Mustelin, J. (Eds.). (2008). Sustainable Landscapes in Zanzibar. Publicationes Instituti Geographici Universitatis Turkuensis AII 172.
- Käyhkö, N., & Skånes, H. (2008). Retrospective land cover/land use change trajectories as drivers behind the local distribution and abundance patterns of oaks in south-western Finland. Landscape and Urban Planning, 88, 12–22.
- Kennedy, R. E., Cohen, W. B., & Schroeder, T. A. (2007). Trajectory-based change detection for automated characterization of forest disturbance dynamics. Remote Sensing of Environment, 110, 370–386.
- Kombo, Y. H., & Kitwana, M. M. (1997). Coral rag soil fertility improvement. Farmers’ indigenous knowledge and practices (Forestry Technical Paper No. 72). Zanzibar: Commission of Natural Resources.
- Lambin, E. F., Baulies, X., Bockstael, N., Fischer, G., Krug, T., Leemans, R., … Vogel, C.(1999). Land-use and land-cover change (LUCC): Implementation strategy (IGBP Rep. 48, IHDP Report 10). Stockholm: International Geosphere–Biosphere Program and International Human Dimensions Programme on Global Environmental Change.
- Lambin, E. F., Helmut, J., Geist, H. J., & Lepers, E. (2003). Dynamics of land-use and land-cover change in tropical regions. Annual Review of Environmental Resources, 28, 205–241.
- Lambin, E. F., & Meyfroidt, P. (2010). Land use transitions: Socio-ecological feedback versus socio-economic change. Land Use Policy, 27, 108–118.
- Lambin, E. F., Turner, B. L., Geist, H. J., Agbola, S. B., Angelsen, A., Bruce, J. W., … Xu, J. (2001). The causes of land-use and land-cover change: Moving beyond the myths. Global Environmental Change, 11, 261–269.
- MANR (Ministry of Agriculture and Natural Resources). (2011). Community forest management guidelines for the development of community forest agreements. Zanzibar Town: Revolutionary Government of Zanzibar.
- Mapedza, E., Wright, J., & Fawcett, R. (2003). An investigation of land cover change in Mafungautsi Forest, Zimbabwe, using GIS and participatory mapping. Applied Geography, 23, 1–21.
- McGarigal, K., Cushman, S. A., Neel, M. C., & Ene, E.. (2002). FRAGSTATS v3: Spatial pattern analysis program for categorical maps. Amherst. Retrieved from http://www.umass.edu/landeco/research/fragstats/fragstats.html
- MEA (Millennium Ecosystem Assessment). (2003). Ecosystems and human well-being: A framework assessment. Washington, DC: Island Press.
- Mertens, B., & Lambin, E. F. (2000). Land-cover-change trajectories in Southern Cameroon. Annals of the Association of American Geographers, 90, 467–494.
- Mertz, O. (2009). Trends in shifting cultivation and the REDD mechanism. Current Opinion in Environmental Sustainability, 1, 156–160.
- MFEA (Ministry of Finance and Economic Affairs). (2010). The Economic Survey 2009. The United Republic of Tanzania. Dar es Salaam: Kiuta.
- Michon, G., De Foresta, H., Levang, P., & Verdeaux, F. (2007). Domestic forests: A new paradigm for integrating local communities’ forestry into tropical forest science. Ecology and Society, 12, 1.
- Mustalahti, I., Bolin, A., Boyd, E., & Paavola, J. (2012). Can REDD+ reconcile local priorities and needs with global mitigation benefits? Lessons from Angai forest, Tanzania. Ecology and Society, 17, 16.
- OCGS (Office of Chief Government Statistician). (2010). Zanzibar statistical abstract 2009. Zanzibar: Author.
- O’Farrell, P. J., Reyers, B., Le Maitre, D. C., Milton, S. J., Egoh, B., Maherry, A., … Cowling, R. M. (2010). Multi-functional landscapes in semi-arid environments: Implications for biodiversity and ecosystem services. Landscape Ecology, 25, 1231–1246.
- Omar, A. B. (1994). Forest management plan for Unguja Ukuu forest plantation 1996–2000. Zanzibar: Commission of Natural Resources Sub-commission for Forestry.
- Paré, S., Söderberg, U., Sandewall, M., & Ouadba, J. M. (2008). Land use analysis from spatial and field data capture in southern Burkina Faso, West Africa. Agriculture, Ecosystems and Environment, 127, 277–285.
- Parker, C., Mitchell, A., Trivedi, M., & Mardas, N. (2009). The Little REDD+ Book, Global Canopy Foundation. Retrieved from http://www.theredddesk.org/redd_book
- Pickels, J. (1985). Phenomenology, science and geography. Cambridge: Cambridge University Press.
- Raymond, C. M., Bryan, B. A., MacDonald, D. H., Cast, A., Strathearn, S., Grandgirard, A., & Kalivas, T. (2009). Mapping community values for natural capital and ecosystem services. Ecological Economics, 68, 1301–1315.
- Relph, E. (1976). Place and placelessness. London: Pion.
- Rudel, T. K., Coomes, O. T., Moran, E., Achard, F., Angelsen, A., Xu, J., & Lambin, E. (2005). Forest transitions: Towards a global understanding of land use change. Global Environmental Change, 15, 23–31.
- Serneels, S., Linderman, M., & Lambin, E. F. (2007). A multilevel analysis of the impact of land use on interannual land-cover change in East Africa. Ecosystems, 10, 402–418.
- Sherrouse, B. C., Clement, J. M., & Semmens, D. J. (2011). A GIS application for assessing, mapping, and quantifying the social values of ecosystem services. Applied Geography, 31, 748–760.
- Silverman, B. W. (1986). Density estimation for statistics and data analysis. New York, NY: Chapman and Hall.
- Sitari, T. (2005). Forestry in the community lifeworld in Unguja island, Zanzibar. In T. Sitari (Ed.), Forestry, community and biodiversity in Zanzibar, 37–58, vol. 3. Turku: Turku University Department of Geography Publications B.
- Sloan, S. (2008). Reforestation amidst deforestation: Simultaneity and succession. Global Environmental Change, 18, 425–441.
- Solomon, S., Quin, D., Manning, M., Marquis, M., Averyt, K., Tignor, M. M. B., … Chen, Z. (Eds.). (2007). Climate change 2007 – The physical science basis. Contribution of the working group I to the fourth assessment report of the Intergovernmental Panel on Climate Change. Cambridge: Cambridge University Press.
- Southworth, J. (2004). An assessment of Landsat TM band 6 thermal data for analysing land cover in tropical dry forest regions. International Journal of Remote Sensing, 25, 689–706.
- Stephenson, J. (2008). The cultural values model: An integrated approach to values in landscapes. Landscape and Urban Planning, 84, 127–139.
- Tamrini, A. S. (2009). The impact of integrated conservation and development projects (ICDPs) on local community livelihood and biodiversity conservation. Zanzibar: WWF & Department of Commercial Crops, Fruits and Forestry.
- Termorshuizen, J. W., & Opdam, P. (2009). Landscape services as a bridge between landscape ecology and sustainable development. Landscape Ecology, 24, 1037–1052.
- Törhönen, M. (2004). Sustainable land tenure and land registration in developing countries, including a historical comparison with an industrialised country. Computers, Environment and Urban Systems, 28, 545–586.
- Tuan, Y.-F. (1977). Space and place: The perspective of experience. Minneapolis: University of Minnesota Press.
- UNEP (United Nations Environment Program). (2007). Global environment outlook, GEO 4, environment and development. Malta: Progress Press.
- UN-REDD Programme. (2009). Tanzania Quick Start initiative. Retrieved from http://www.un-redd.org/UNREDDProgramme/CountryActions/Tanzania/tabid/1028/language/en-US/Default.aspx
- Vejre, H., Søndergaard Jensen, F., & Jellesmark Thorsen, B. (2010). Demonstrating the importance of intangible ecosystem services from peri-urban landscapes. Ecological Complexity, 7, 338–348.
- Verburg, P. H., Neumann, K., & Nol, L. (2011). Challenges in using land use and land cover data for global change studies. Global Change Biology, 17, 974–989.
- Verburg, P. H., Overmars, K. P., Huigen, M. G. A., de Groot, W. T., & Veldkamp, A. (2006). Analysis of the effects of land use change on protected areas in the Philippines. Applied Geography, 26, 153–173.
- Wiersum, K. F. (2004). Forest gardens as an ‘intermediate’ land-use system in the nature-culture continuum: Characteristics and future potential. Agroforestry Systems, 61, 123–134.
- Willemen, L., Hein, L., van Mensvoort, M. E. F., & Verburg, P. H. (2010). Space for people, plants and livestock? Quantifying interactions among multiple landscape functions in a Dutch rural region. Ecological Indicators, 10, 62–73.
- Williams, A. J., Basha, A. U., Mtumwa, S. S., & Mussa, J. M. (1997). Cheju shehia forest management plan (Forestry Technical Paper No. 95). Zanzibar: Commission for Natural Resources.
- Williams, D. R., & Patterson, M. E. (1996). Environmental meaning and ecosystem management: Perspectives from environmental psychology and human geography. Society and Natural Resources, 9, 507–521.
- ZFDP (Zanzibar Forestry Development Project). (1997). Zanzibar long-term forestry plan 1997–2006 (Technical Paper No. 72). Vantaa: Oy Edita Ab.