
 ?Mathematical formulae have been encoded as MathML and are displayed in this HTML version using MathJax in order to improve their display. Uncheck the box to turn MathJax off. This feature requires Javascript. Click on a formula to zoom.
ABSTRACT
Static bending tests to measure modulus of elasticity (MOEST) or wood stiffness provide an indicator of the structural performance of a finished product. These tests are however, slow and expensive. Tests to measure MOE using non-destructive testing (NDT) provide alternatives to MOEST tests; however, relationships between the different modes of measurement need to be established. Non-destructive testing MOE measured by two methods (SilviScan [MOESS] and time of flight [MOETOF]) have been compared with MOEST for lodgepole pine and white spruce. The relationships between stress wave speed (SWS) and MOEST have also been evaluated. Simple linear regressions of MOESS, MOETOF, and SWS had greater explanatory power (higher coefficients of determination (R2)) than did multiple linear regressions including growth rate or other wood fibre attributes. Simple linear regression from MOETOF and MOESS on MOEST had lower R2 for lodgepole pine than for white spruce; however, the converse was true for SWS. SWS had the highest R2 (89%) and MOESS the lowest R2 (47%) when regressed on MOEST in lodgepole pine. The results were tool and species specific, suggesting that R2 between MOEST and non-destructive testing MOE values must be validated separately for each commercial tree species and for each measurement technique.
1. Introduction
The mechanical properties of wood are among the most important wood and fibre attributes (WFA) for many end products. With the emergence of multistory timber-building systems (Cecobois Citation2013) for which precise knowledge of the performance of wood products is required, it has become essential to have up-to-date information on the variation of wood products mechanical properties in general, and their stiffness or modulus of elasticity (MOE) in particular. This information should take into account the differences between juvenile wood (JW) and mature wood (MW) (Zobel and Sprague Citation1998) and the impact of growth rate (Vincent et al. Citation2011). This assessment is necessary because to date, quality control of structural sawn timber has hardly considered the differences between JW and MW, and growth rate has only been considered in extreme cases of fast-grown plantations. The 3-point static bending test and the 4-point static bending test are the traditional means for measuring static modulus of elasticity (MOEST) in woody material (Brancheriau et al. Citation2002, Ross Citation2015). The main differences between these two methods are the location of the maximum bending moment and maximum axial fiber stresses which occurs directly at the specimen mid-point (i.e. below the loading nose) in three-point loading, but is spread out over the area between the loading noses in the four-point method (Chitchumnong et al. Citation1989, Ross Citation2015). For this reason, one has to apply conversion factors before comparing results from one method to another (Brancheriau et al. Citation2002, Hein and Brancheriau Citation2018). The 3-point static bending test involves submitting a wood sample of normalized length (L), width (e), and height (h) and known moisture content (MC) to a known load (P) at its mid-span (l/2). The resultant deflection (f) is measured and MOEST is computed from the linear portion of the load-deflection curve, far from the elastic limit, as described in equation 1 (Brancheriau et al. Citation2002). Measuring MOEST for wood pieces with static bending tests is an expensive, time-consuming, and destructive process, which limits the use of these tests in research and forestry operations. Therefore, many studies have focussed on developing tools and techniques for rapid, non-destructive, and cost-effective measurement of mechanical properties that could be used as substitutes for static bending tests; the speed of sound transmission and attenuation (Ross and Pellerin Citation1994; Wang et al. Citation2004) and the SilviScan technology (Evans Citation1999; Evans et al. Citation1999) are among the most promising. However, these technologies still need to be validated for many commercial tree species, including white spruce and lodgepole pine.
(1)
(1) Where L is sample length (span), e is sample width, h is sample height, k is indentation coefficient, P is applied load and f is deflection at midspan.
The measurement of the longitudinal modulus of elasticity in wood, sometimes called dynamic modulus of elasticity was carried out for the first time at the United States Department of Agriculture’s Forest Products Laboratory in Madison, Wisconsin, before World War II (Bell et al. Citation1954) and has greatly evolved since then. Acoustic resonance and acoustic time of flight (TOF) are the two methods used to measure acoustic velocity (Legg and Bradley Citation2016, Schimleck et al. Citation2019). In both cases, the longitudinal stress wave travels in a direction parallel to the grain of wood from a transmitting probe to a receiving probe. Acoustic resonance signal is reflected from each end of the sample many times and standing waves are generated and measured (Legg and Bradley Citation2016). In acoustic TOF, the stress wave is induced by a transmitting probe, travels through the wood, and is detected by a receiving probe located at a known distance (d) from the transmitter. The time taken by the stress wave to first reach the receiving probe, known as TOF (Brashaw et al. Citation2009), is then used to compute the stress wave speed (SWS), as described in equation 2. SWS is an economically feasible alternative way to estimate the mechanical properties of wood in standing trees or logs (Baillères et al. Citation1998; Jacques et al. Citation2004, Wang et al. Citation2007). It is particularly appealing because it allows users to estimate the mechanical properties of wood more quickly and at less cost than if they also measured wood density (WD). Some SWS equipment may be used in adverse environmental conditions and do not require highly qualified personnel for their operation. It has been successfully used for mechanical classification of structural hardwood (Baillères et al. Citation1998) and for genetic selection of softwood with superior mechanical properties (Jacques et al. Citation2004). SWS is also used in the one-dimensional wave equation (equation 3), which establishes the relationships among TOF modulus of elasticity (MOETOF), SWS, and WD (Wang et al. Citation2004, Mahon et al. Citation2009; Ross Citation2015).
(2)
(2)
(3)
(3) Where d is sample length (distance), TOF is time of flight, and WD id wood density.
SilviScan is a tool composed of several proven technologies, which allows assessment of a range of WFA in an automated, rapid, cost-effective, and non-destructive way (Evans Citation1999; Defo et al. Citation2010, Knowles et al. Citation2004). An advantage of SilviScan over other techniques being used to measure MOE is the determination of the pith to bark radial pattern, which can be compared with other WFA (Raymond et al. Citation2007). Physical WFA (e.g. wood density) and morphological WFA (e.g. growth ring width) are measured by means of X-ray densitometry, a well-established and widely used technology (Koubaa et al. Citation2005). Anatomical WFA (e.g. microfibril angle) are measured by means of X-ray diffraction, another well established and widely used technology (Brändström Citation2001). SilviScan MOE (MOESS) is obtained through a combination of these two technologies and image analysis (equation 4). The main disadvantage with SilviScan is that it is available in only few laboratories around the world. Therefore, samples often need to be sent away for testing (Knowles et al. Citation2004, Schimleck et al. Citation2019).
(4)
(4) Where Icv is the coefficient of variation of the intensity of the X-ray diffraction profile, ρ is the wood density obtained from X-ray densitometry, A is a scaling factor and B is an exponent to allow for curvature (Evans Citation1999, Citation2006; Evans et al. Citation1999).
Unlike acoustic TOF, acoustic resonance requires two cut ends, and cannot be used on standing trees (Legg and Bradley Citation2016). Acoustic resonance MOE and acoustic TOF MOE are not directly comparable but have a good correlation once the bias is corrected (Schimleck et al. Citation2019). Studies have found that the MOETOF is higher than both the resonance MOE and the MOEST, but strong correlation were found between resonance MOE and MOEST (Legg and Bradley Citation2016). There is also a good correlation between MOETOF and MOEST (Ide Citation1935; Wang et al. Citation2004; Liang and Fu Citation2007; Mora et al. Citation2009). MOETOF generally exceeds MOEST by 8% to 15% in many species (Wang et al. Citation2004; Jacques et al. Citation2004; Liang and Fu Citation2007). Ide (Citation1935) suggested that MOETOF exceeds MOEST because it is obtained for minute alternating stresses, far below the elastic limit, which do not give rise to complex creep effects or elastic hysteresis. Haines et al. (Citation1996) and Ouis (Citation2002) suggested that viscoelasticity is the most likely source of the differences noted between MOETOF and both MOEST and resonance MOE. However, it is not uncommon for the measurement of MOE using non-destructive testing [MOENDT] to be lower than the measurement of MOEST. A 30.6% decrease from static to MOETOF was found by Lindström et al. (Citation2004), when they compared MOETOF with axial compression MOE on 3-year-old radiata pine clones. Haines et al. (Citation1996) found an average decrease of 6%, with some samples having a 20% decrease, when they compared resonance MOE and static MOE of Norway spruce construction lumber. Due to the anisotropic nature of wood, MOETOF is highest in the longitudinal direction, followed by the radial radiation and lowest in the tangential direction (Bucur Citation2006, Wessels et al. Citation2011, Schimleck et al. Citation2019). The longitudinal MOETOF is negatively influence by knots, MC, tree height (Hsu Citation2003), branches and bark (Lasserre et al. Citation2007).
There is a good correlation between MOESS and MOEST (Defo et al. Citation2010; Raymond et al. Citation2007). Defo et al. (Citation2010) found high correlations for both small clear battens (r = 0.80–0.82) and lumber (r = 0.79) of balsam fir and black spruce. In small clear battens, MOESS exceeded MOEST by 10% in radiata pine (Raymond et al. Citation2007), by 32.8% in balsam fir, and by 47% in black spruce (Defo et al. Citation2010). In lumber sampled from the same trees, MOESS exceeded MOEST by 6.9% and 15.8% for balsam fir and black spruce, respectively (Defo et al. Citation2010). However, the results were species specific, indicating the need to validate the suitability of SilviScan for use in each species of interest (Defo et al. Citation2010).
While SilviScan (Evans Citation1999) and the 3-point static bending test (Brancheriau et al. Citation2002) are clearly designed for laboratory use, the Picus 3 TOF Tomograph was developed for field use (Brashaw et al. Citation2009, Argus Electronic GmbH Citation2017). In practice, many TOF tools are used interchangeably for field and laboratory tests. Although this is an accepted practice, the best relationships are obtained when the appropriate technique is used.Footnote1 Although a close relationship exists between MOENDT values computed using different technologies, MOENDT values do vary according to the technology used (Liang and Fu Citation2007; Raymond et al. Citation2007). Few studies have compared MOEST and MOENDT values measured from the same small clear battens (Bell et al. Citation1954; Gerhards Citation1982; Wang et al. Citation2004; Raymond et al. Citation2007). In addition, few studies have examined the variation in MOENDT values measured using different technologies on the same trees (Liang and Fu Citation2007; Bell et al. Citation1954; Raymond et al. Citation2007). White spruce (Picea Glauca (Moench) Voss) and lodgepole pine (Pinus contorta Dougl. ex. Loud.) are prominent components of the commercial forest land base in western Canada; they are principally used for lumber production and are of vital economic importance to the Canadian forestry industry (Nienstaedt and Zasada Citation1990; Lotan and Critchfield Citation1990; MFFP Citation2015). Cost-effective and validated tools for measuring the mechanical properties of wood are essential for optimizing the use of this important resource. The objective of this study was to compare MOESS and MOETOF to MOEST for both lodgepole pine and white spruce, and to compare SWS to MOEST.
2. Material and methods
2.1. Material
Ten lodgepole pine trees and 10 white spruce trees were used in this study (). The stand age, plot size, and desired codominant crown class of free of visible defects trees limited the number of trees that could be removed for testing. However, a sampling size of 10–15 trees/site resulted in marginally smaller standard errors for the mean estimate of wood density for a site (Raymond Citation2006, Jordan et al. Citation2007). The lodgepole pine trees were harvested from the MacKay thinning trial, Alberta (Stewart et al. Citation2006) in 2016. These trees were part of a fire-origin stand that was thinned at 22 years to 1680 stems/ha. White spruce trees were harvested from several long-term monitoring (buffer areas) plots in natural untreated forest stands near Calling Lake, Alberta in 2016. All trees were of the codominant social class.
Table 1. Tree-level average values of modulus of elasticity (MOE) obtained from SilviScan, time of flight (TOF), and static bending tests for lodgepole pine and white spruce, presented in decreasing order using SilviScan MOE values.
2.2. Testing methods
A 5-cm-thick disk was collected at breast height from every felled tree, air dried in the laboratory at the Northern Forestry Centre, Edmonton, Alberta, and sent to the EvaluTree laboratory of FPInnovations, Vancouver, British Columbia, for Silviscan analysis. A 12 by 12 mm (tangential by longitudinal) radial block was taken from pith to bark of each disk. These blocks were extracted with acetone to remove resins and then conditioned to 8% equilibrium moisture content. A 2 by 7 mm (tangential by longitudinal) strip was sawn from each block and used to measure WFA with SilviScan. All standard measurements available with SilviScan were performed, including wood density (RD) measured at 25 µm resolution and microfibril angle (MFA) measured at 5 mm resolution (Evans and Ilic Citation2001). MOESS was calculated from wood density and X-ray diffraction metrics as described in Eq. 4.
A 60-cm (longitudinal) bolt was cut just above the disk and used to prepare small clear battens for static bending measurement according to the guidance for secondary method specimens (25 by 25 by 410 mm) in ASTM-D-143 (ASTM Citation2014). Battens were sawn and air dried in the laboratory at the Northern Forestry Centre. One to 6 pith-free battens per bolt were collected, depending on the tree’s diameter and defects. The battens were taken from along the north and south line across the bolt, as closely as defects and branch traces would allow. These were shipped to the Université du Québec en Abitibi-Témiscamingue (UQAT) for further processing. Upon arrival in UQAT, battens were stored in a Labocon climate chamber (model LHC-103) at 20°C and 65% relative humidity for a target 12% equilibrium MC of all samples. Acoustic velocity was measured on the battens with a through transmission test method (Senalik et al. Citation2015) using the point-to-point measurement mode on a Picus 3 TOF Acoustic Tomograph developed by Argus Electronic Gmbh (Brashaw et al. Citation2009, Argus Electronic GmbH Citation2017), and mainly used to detect decay and cavities in standing trees non-invasively. The experimental setup consisted of 2 common (roofing) nails inserted (2–3 mm deep) into each end of the batten in the longitudinal direction. The tapping pin of an electronic radio hammer was bound to 1 nail, and the wave was induced by gently hitting the tapping pin with the electronic hammer. One receiving magnetic sensor was bound to the other nail. To avoid reproducibility and accuracy issues (Andrews Citation2000), the Picus TOF instrument was operated within a few days by a single user, who inserted all probes parallel to the small clear batten edges and tried to keep the same impact angle and impact strength of the hammer. The longitudinal SWS was computed automatically by the Picus and the average of 5 hits was recorded as the SWS for the batten in question. The battens were reconditioned after the speed of sound measurements to avoid MC variation before the static bending tests.
After the SWS measurement, a universal testing machine (Zwick/Roell, model Z020) with 20 kN capacity and equipped with an extensometer was used for the 3-point bending test measurement according to the guidance for secondary method specimens (25 by 25 by 410 mm) in ASTM-D-143 (ASTM Citation2014). After testing, a 25-mm cube was taken at 1 cm from the batten edge and weighed to 0.001 g precision with a Mettler Toledo scale (model XS204). These cubes were then oven dried at 103°C in a Quincy Lab drying oven (model 40 GC) to determine the batten’s MC (Reeb and Milota Citation1999). Another small sample (approximately 150 mm long) was cut from the batten and sanded. After sanding, these samples were conditioned in the Labocon at the same condition as the battens, weighed with an Ohaus Precision scale to 0.01 g precision and measured with an electronic caliper to 0.01 mm precision for gravimetric wood density (WD) determination. MOEST was computed with the Zwick equipment using Eq. 1, and MOETOF was calculated from SWS and WD as described in Eq. 3.
2.3. Statistical analyses
The first two rings from the pith represent a minor proportion of the stem volume but exhibit highly variable values for WFA. These were removed from the SilviScan database to avoid undue leverage by these values and to facilitate model fitting (Alteyrac et al. Citation2005, Chen et al. Citation2016). This process removed 2% of the whole SilviScan database. The lodgepole pine and the white spruce datasets were partitioned into JW and MW based on the MOE transition age calculated using a linear-linear segmented model (Wang and Stewart Citation2013). Linear regressions proved efficiency in converting MOE measurements from a testing method to another (Knowles et al. Citation2004, Hein and Brancheriau Citation2018), and were used to compare MOETOF, MOESS, and SWS to MOEST. Model fitting was completed with the R statistical software (R Core Team Citation2017). Analyses were performed separately for the JW and the MW zones, and by combining these two subsamples, for each wood species. Additionally, a database that included those tree rings that had MOE values obtained with all three technologies was created for each wood species. Comparisons across the different modalities of measurement were conducted at the whole disc level and at the level of the individual small clear batten. For the latter, only those SilviScan values observed for the rings that occurred in each given batten were used for comparison with the TOF and static measurements on the batten (matched-rings comparison). Whole-disc comparisons used all of the measurements made for each measurement modality.
3. Results and discussion
3.1. Tree characteristics, radial pattern and average values
Tree-level average values of diameter at breast height, trees height, MOESS transition age (TA) and corresponding juvenile wood proportion (JWP) are presented in for both lodgepole pine and white spruce. The TA and JWP variation within species and between species in this study were consistent with earlier studies (Zobel and van Buijtenen Citation1989; Mvolo et al. Citation2015a; Wang and Stewart Citation2012, 2013).
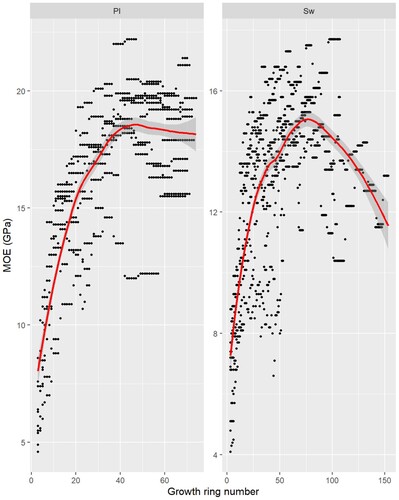
MOESS increased to about 75 and 45 growth rings from the pith for white spruce and lodgepole pine, respectively, where it started decreasing with age (). This pattern was also observed with MOETOF and MOEST (figures not shown). These MOESS radial patterns were consistent with previously described patterns in spruce (Alteyrac et al. Citation2006) and pine (Wang and Stewart Citation2013). The MOESS values were similar to those previously reported for lodgepole pine (Wang and Stewart Citation2013 [5–19 GPa]) and white spruce (Sattler and Stewart Citation2016 [4–18 GPa]). The MOETOF was lower than the previously reported value for lodgepole pine lumber (Liang and Fu Citation2007 [15 GPa]). The MOEST values were comparable to those previously reported for lodgepole pine (Jessome Citation2000 [11 GPa]; Liang and Fu Citation2007 [11.7 GPa]) and white spruce (Jessome Citation2000 [9.93 GPa]; Sattler et al. Citation2014 [4–14 GPa]). Static testing equipment usually relies on the same ASTM standard, and one can expect SilviScan equipment to be comparable across laboratories. Therefore, it is straightforward to compare MOESS and MOEST values among studies, making sure the same technique (3-points vs. 4-points) is used for MOEST, or proper conversion factors are applied (Brancheriau et al. Citation2002, Hein and Brancheriau Citation2018). It is less straightforward to compare MOE values calculated using acoustic tools (TOF or resonance) because there is no established standard used across studies (Liang and Fu Citation2007; Mahon et al. Citation2009).
Figure 1. Variation from pith to bark in modulus of elasticity (MOE) measured by SilviScan in lodgepole pine (Pl) and white spruce (Sw); standard errors are represented by the grey zones
The average MC of battens at the time of testing was 11.03%. Wood density is usually measured on samples stabilized at 12%MC. However, given the very low percent volumetric shrinkage observed from 11% to 12% MC (Glass and Zelinka Citation2010), we didn’t attempt to determine any correction factors for MC. Tree-level average values of wood density (WD) determined gravimetrically and wood density (RD) determined by SilviScan using X-ray densitometry are presented in for both lodgepole pine and white spruce. As expected, RD values were different from WD values. However, these values are not strictly comparable, because SilviScan samples were extracted radial strips, while unextracted longitudinal battens were used to determine wood density gravimetrically. The RD values that we observed in this study were similar to those previously reported for lodgepole pine (Mansfield et al. Citation2009 [275–575 kg/m3]) and white spruce (Middleton et al. Citation2000 [275–413 kg/m3]). The WD values were higher than those previously reported for lodgepole pine (412 kg/m3) and white spruce (372 kg/m3) by Jessome (Citation2000). This difference may be explained by sampling, as we used small samples collected avoiding defects and branch traces. Most of these samples were closer to the pith than to the bark. The radial pattern of pines and spruces wood density belongs to the type II as described by Panshin and de Zeuuw (Citation1980), in which the closer to the pith, the higher the wood density. The average SWS values found in this study for lodgepole pine and white spruce, respectively (), were comparable to the 3292 and 3486 m/s values reported by Wang et al. (Citation2004) for western hemlock and Sitka spruce, respectively. The faster stress wave transmission in spruce compared to pine, and the associated lower MOETOF agreed with values reviewed by Ross and Pellerin (Citation2015).
3.2. Comparisons of MOE measurement methods
SilviScan showed the largest variability among the three technologies, followed by static equipment; the lowest variation was found with the TOF equipment (, ). The largest variability found with MOESS may be explained by the fact that the SilviScan measurement was done at a finer scale, allowing a better capture of MOE variation, as one can see in . The lowest variation found with the acoustic TOF equipment may have been because the longitudinal wave in our samples travels preferentially through the earlywood, where both wood density and stiffness are lower, and SWS passes with lower velocity (Haines et al. Citation1996; Feeney et al. Citation1998; Xu et al. Citation2004). To avoid this issue, acoustic resonance tools are often preferred to acoustic TOF tools, since the wave reflects many times from the ends of the sample (Haines et al. Citation1996; Lindström et al. Citation2004, Legg and Bradley Citation2016). However, wood is known to be less attenuative in the longitudinal direction (Feeney et al. Citation1998), and the impact of the differences between earlywood and latewood on MOETOF was beyond the scope of this study.
Figure 2. Variability in modulus of elasticity (MOE) between lodgepole pine (Pl) and white spruce (Sw), and among measurement techniques
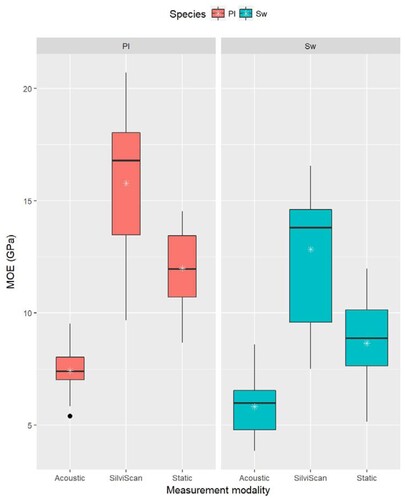
Table 2. SilviScan, acoustic time of flight (TOF), and static bending test modulus of elasticity (MOE) values obtained by wood zone for lodgepole pine and white spruce small clear battens and thin radial strip (minimum, average, and maximum MOE values in GPa).
For both lodgepole pine and white spruce, MOE values were largest with SilviScan, followed by static MOE, and the lowest MOE values were registered with the acoustic TOF equipment (, ). This higher MOESS value compared to MOEST value is consistent with findings from previous studies on black spruce and balsam fir (Defo et al. Citation2010) and on radiata pine (Raymond et al. Citation2007). The lowest MOETOF may have been because our samples were too short for the equipment used. The longitudinal acoustic velocity was found to diminish below a length/width ratio of 20 (Bucur Citation2006). The length/width ratio for secondary method specimens in ASTM-D-143 used in this study is 16.4. Acoustic TOF are usually designed for probes being inserted at about a meter of distance one from the other in field environment (Schimleck et al. Citation2019). Our probes were inserted at about 0.4 m one from the other. Even for samples having the same length/width ratio, the longitudinal acoustic velocity diminishes with shorter samples. This was explained by mode conversion phenomena in infinite solid vs. rod (Bucur et al. Citation2002, Bucur Citation2006). The shorter distance used in TOF equipment compared to resonance equipment has also been suggested as the reason for TOF measurements being more sensitive to errors resulting from local heterogeneity in the wood (Legg and Bradley Citation2016). Following this reasoning, despite the care taken in selecting our samples, one can expect branch traces and small knots to significantly reduce MOETOF (Hsu Citation2003, Bucur Citation2006, Lasserre et al. Citation2007) in these short battens than it would do in longer samples. A more appropriate setup for stress wave measurements using secondary method specimens designed for ASTM-D-143 may be using a digital oscilloscope.
Our finding that values were higher for MOEST than for MOETOF for both lodgepole pine and white spruce is consistent with findings from a previous study comparing MOETOF and axial compression MOE on 3-year-old radiata pine clones (Lindström et al. Citation2004). Despite the common observation that MOENDT exceeds MOEST (Legg and Bradley Citation2016), some studies have found a higher MOEST than MOENDT. For instance, Haines et al. (Citation1996) found higher MOEST than acoustic resonance MOE in Norway spruce construction lumber. Given that acoustic resonance methods are known to have lower MOE value than acoustic TOF methods (Legg and Bradley Citation2016), an even larger decrease could be expected if the construction lumber were tested by TOF technology. However, in the same study, an increase from MOEST to acoustic TOF MOE and acoustic resonance MOE was also found for Norway spruce and silver fir small clear battens. Despite the discrepancies among MOE values, the results obtained with all three technologies followed the expected pattern produced with MOESS (). Also, when one looks at our trees ranked according to their MOESS values (), all 3 technologies followed the same overall decreasing trend, in accordance with a previous report (Lindström et al. Citation2004). Finally, all 3 technologies produced the expected overall increasing relationships with wood density and SWS (Haines et al. Citation1996) and the expected overall decreasing relationship with MFA (Lindström et al. Citation2004).
MOE values were higher in lodgepole pine than in white spruce, independent of the measurement technique (, ) and wood zone considered (). These differences in MOE between species, and with all 3 technologies, are consistent with previous reports (Wang et al. Citation2004; Raymond et al. Citation2007; Defo et al. Citation2010). It confirms that any comparison between MOE values must take the tree species and the measurement technologies and operating conditions into account. On average, MOESS values from matched-rings subsamples were comparable to whole-disc MOESS values (). This similarity between matched-rings and mean-disc MOE values while using SilviScan suggests that one could sample only a few selected rings from pith to bark and have a representative value of mean pith-to-bark MOE, as is done with measurements of other WFA that are expensive to collect (Mvolo et al. Citation2015b, Mvolo et al. Citation2019). As expected, MOESS values were higher and less variable in MW than in JW.
3.3. Comparison between MOE values
Despite the differences in measurement modality and scale noted above, the estimations of static MOE from either of the NDT methods were linear and gave significant and useful predictions (, ). Overall, predicting MOEST from MOETOF and MOESS using linear regression produced lower coefficients of determination (R2) for lodgepole pine than for white spruce. Conversely, the linear regression from SWS had higher R2 values for lodgepole pine than for white spruce. The lodgepole pine and white spruce R2 values between the TOF and static methods presented in were in the same range as correlations previously reported in other coniferous species (Lindström et al. Citation2004; Liang and Fu Citation2007). However, these values were slightly lower than the 0.98 found by Bell et al. (Citation1954) and the 0.91 found by Wang et al. (Citation2004) using a laboratory setup with an oscilloscope. This advocate for using purposely designed experimental technique for measuring TOF MOE in laboratory environment.
Figure 3. Predicted modulus of elasticity (MOE) from non-destructive testing (NDT) techniques, SilviScan, time of flight (TOF), and stress wave speed (SWS) versus observed static MOE for matched-rings of lodgepole pine (a), matched-rings of white spruce (b), disc mean of lodgepole pine (c), and disc mean of white spruce (d); the grey line is the 1:1 regression line and standard errors are represented by the grey zones
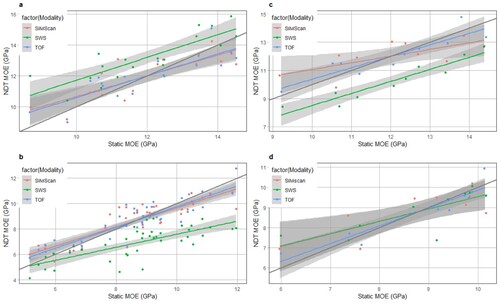
Table 3. Parameters and statistics from regression models estimating static modulus of elasticity from time of flight modulus of elasticity (MOETOF), SilviScan modulus of elasticity (MOESS) and stress wave speed (SWS).
The lodgepole pine and white spruce R2 values between the SilviScan and static methods were lower than those between the TOF and static technologies (). This was expected, because the static and TOF technologies used the same longitudinal battens, while SilviScan samples were radial strips. Similarly, we expected the R2 between MOESS and MOEST to be higher in the matched-rings database than in the mean-disc database, in part because, when we used the matched-rings, all values were the same age in comparing between the SilviScan technology and the static technology. All WFA measured with the SilviScan equipment were tested using simple linear regressions against MOEST for both mean-disc and matched-rings values. None of these variables presented a higher R2 than the MOESS, nor did these WFA (including growth rate) improve the adjusted R2 when included in multiple linear regression with MOESS (results not shown). Lodgepole pine juvenile wood MOE measured with the SilviScan equipment explained 57% (p value: 0.01) of mean tree MOE measured with the static equipment. White spruce SilviScan juvenile wood MOE failed to explain mean tree static MOE variation (R2: 29% and p value: 0.11). A dummy variable for wood zone (JW and MW) was used in multiple linear regression to test the combined effect of MOENDT and wood zone on MOEST, but these models did not improve R2 with respect to simple linear regression, except for the model including SWS and wood zone for lodgepole pine.
The R2 values between SWS and MOEST for lodgepole pine presented in were higher than both the R2 between MOETOF and MOEST and the R2 between MOESS and MOEST. This finding was surprising, given that SWS is part of the MOETOF formula, and therefore one would expect MOETOF to have higher explanatory power than SWS. However, our attempts to model MOEST as a multiple linear function of WD and SWS were unsuccessful, with SWS explaining most of the variation and WD being non-significant. SWS has been presented as a valuable and flexible way to estimate MOE non-destructively, both in standing trees (Grabianowski et al. Citation2006; Wang et al. Citation2007; Eckard et al. Citation2010; Paradis et al. Citation2013) and in lumber (Wang et al. Citation2004; Liang and Fu Citation2007). It is particularly appealing because it allows users to estimate the mechanical properties of wood more quickly and cheaply than by also measuring wood density. However, a similarly high R2 between SWS and MOEST was not found with white spruce samples. Therefore, one may conclude that the higher performance of SWS is species specific.
MOE values predicted from SilviScan and TOF equipment had a consistent pattern, and their confidence intervals largely overlapped across all databases (), supporting the use of these technologies to estimate MOEST from MOENDT. Both MOESS and MOETOF overestimated MOEST for lower MOE value and underestimated MOEST for higher MOE values, in agreement with previous findings (Mora et al. Citation2009). However, we did not attempt to determine any correction factors for MC between SilviScan and TOF samples, because MC values among sampling modalities were comparable (8% vs. 11%) and all sampling was done at close locations in the trees. MOE predicted from SWS did not show a consistent pattern across databases. It overestimated ((a)), underestimated ((b and c)), and both overestimated MOEST for lower MOE values and underestimated MOEST for higher MOE values ((d)). Except as shown in (d), the confidence intervals of MOE predicted from SWS did not overlap with the MOE calculated using the other NDT measurement modalities. The lack of consistency among MOE values predicted from SWS across sampling strategies, together with the species-specific performance discussed earlier and its distinct confidence intervals, suggests that more testing is still required with SWS, using a laboratory designed setup, before sound conclusions can be drawn.
3.4. Practical implication and limitations
The main achievements of this study were in establishing coefficients of determination between MOEST and MOENDT (using SilviScan and Picus). SWS was also found to be a relevant variable in estimating lodgepole pine MOEST. Together, these results suggest that each NDT tool can be confidently used to estimate MOEST. SWS has the advantage of being easy to measure and interpret and involves relatively affordable and non-destructive testing equipment. These tools could be used to segregate trees in terms of MOE classes earlier in the supply chain. If this were done, trees with high MOE values could be used for high-value lumber production, and trees with low MOE values could be used for pulp and paper, bioenergy/bioproducts, or other non-structural products. The results of this study were in line with previous research. However, although we believe that this study adds a significant piece of knowledge in this field, we acknowledge that a larger sampling (compared to the 59 battens of this study), inclusion of resonance tools, measurement of standing trees before felling, measurement of longer samples (together with the secondary method specimens in ASTM-D-143), and a more appropriate setup for stress wave measurements in laboratory environment will add scientific value to subsequent work.
4 Conclusion
The objective of this study was to compare measurements of the modulus of elasticity (MOE) determined with SilviScan (MOESS) and acoustic time of flight (MOETOF) equipment with measurements of standard static MOE (MOEST) for lodgepole pine and white spruce. MOESS values were highest, followed by MOEST, and MOETOF was the lowest MOE values. The high explanatory power of the regression models relating MOEST and both MOETOF and MOESS are evidence that both non-destructive testing (NDT) tools can be confidently used as alternatives to standard static bending testing. The stronger relationship between the stress wave speed (SWS) and MOEST for lodgepole pine supports the use of SWS for estimation of MOEST. However, SWS relationship with MOEST was not strong in white spruce, suggesting that more testing is required with this technology before sound conclusions can be drawn. Overall, this study confirmed that coefficients of determination between static and NDT MOE are species and tool specific. Therefore, a similar validation process must be undertaken for each individual tree species and measurement technique combination.
Compliance with Ethical Standards
Conflict of interest
The authors declare that they have no conflict of interest.
Acknowledgements
The authors thank the Canadian Wood Fibre Centre (CWFC) for funding under the Forest Innovation Program (FIP). They also acknowledge the work of Jared Salvail (CWFC) in carrying out the field work and that of William Belhadef (Université du Québec en Abitibi-Témiscamingue) in the static and TOF measurement of modulus of elasticity. The support of Sharon Meredith (Foothills Growth and Yield Association) was instrumental in carrying out this research. Comments on earlier versions of the manuscript by Isabelle Duchesne and two anonymous reviewers are greatly appreciated.
Disclosure statement
No potential conflict of interest was reported by the author(s).
Notes
1 Ross RJ, personal communication.
References
- Alteyrac, J., Cloutier, A., Ung, C. and Zhang, S. Y. (2006) Mechanical properties in relation to selected wood characteristics of black spruce. Wood Fiber Scien, 38, 229–237.
- Alteyrac, J., Zhang, S. Y., Cloutier, A. and Ruel, J. C. (2005) Influence of stand density on ring width and wood density at different sampling heights in black spruce (Picea mariana (Mill.) B.S.P.). Wood Fiber Scien, 37, 83–94.
- Andrews, M. (2000) Where are we with sonics? In Proceedings, Capturing the Benefits of Forestry Research: Putting Ideas to Work, Workshop 2000 (Christchurch, New Zealand: Wood Technology Research Center, University of Canterbury). October 18, 2000 pp 57–61
- Argus Electronic GmbH (2017) Picus Sonic Tomograph, Version 3, Hardware Manual. Last viewed May 2019. URL www.argus-electronic.de/en/content/download/394/4028/file/PiCUS+3+manual.pdf.
- ASTM (2014) ASTM D143-14, Standard Test Methods for Small Clear Specimens of Timber (West Conshohocken, PA: ASTM International).
- Bailleres, H., Calchéra, G., Demay, L. and Vernay, M. (1998) Classement mécanique des bois guyanais de structure selon trois techniques non destructives (mechanical classification of structural Guyanese timber with three non-destructive techniques). Bois et Forets des Tropiques, 257, 47–62.
- Bell, E. R., Peck, E. C. and Krueger, N. T. (1954) Modulus of Elasticity of Wood Determined By Dynamic Methods. Report n° 1977 (Madison, Wisconsin, U.S: Department of Agriculture, Forest Service, Forest Products Laboratory).
- Brancheriau, L., Bailleres, H. and Guitard, D. (2002) Comparison between modulus of elasticity values calculated using 3 and 4 point bending tests on wooden samples. Wood Science and Technology, 36, 367–383. doi:10.1007/s00226-002-0147-3
- Brändström, J. (2001) Micro and ultrastructural aspects of Norway spruce tracheids: A review. IAWA Journal, 22, 333–353.
- Brashaw, B. K., Bucur, V., Divos, F., Gonçalves, R., Lu, J., Meder, R., Pellerin, R. F., Potter, S., Ross, R. J., Wang, X. and Yin, Y. (2009) Nondestructive testing and Evaluation of wood: A Worldwide research Update. Forest Products Journal, 59(3), 7–14.
- Bucur, V. (2006) Acoustics of Wood, 2nd ed.; Springer Series in Wood Science, Springer-Verlag Berlin Heidelberg, 2006; p. XVIII, 394.
- CECOBOIS (2013) Toujours Plus Haut (Always Higher) Vol 5, (Québec, Canada: CECOBOIS).
- Bucur, V., Lanceleur, P. and Roge, B. (2002) Acoustic properties of wood in tridimensional representation of slowness surfaces. Ultrasonics, 40, 537–541. doi:10.1016/S0041-624X(02)00182-8
- Chen, Z. Q., Karlsson, B., Mörling, T., et al. (2016) Genetic analysis of fiber dimensions and their correlation with stem diameter and solid-wood properties in Norway spruce. Tree Genet Genomes, 12, 123, 1–12. doi:10.1007/s11295-016-1065-0
- Chitchumnong, P., Brooks, S. C. and Stafford, G. D. (1989) Comparison of three- and four-point flexural strength testing of denture-base polymers. Dental Materials, 5, 2–5.
- Defo, M., Duchesne, I. and English, B. (2010) Element 5: Sensing Attributes for Value Chain Optimization – Validation of Silviscan Modulus of Elasticity (Vancouver, BC, Canada: Report, FPInnovations).
- Eckard, J. T., Isik, F., Bullock, B., Li, B. and Gumpertz, M. (2010) Selection efficiency for solid wood traits in Pinus taeda using time-of-flight acoustic and micro-drill resistance methods. Forest Sci, 56, 233–241.
- Evans, R. (1999) A variance approach to the x-ray diffractometric estimation of microfibril angle in wood. Appita Journal, 52, 283–294.
- Evans, R. (2006) Wood stiffness by x-ray diffractometry. In D. Stokke, and L. H. Groom (eds.), Characterisation of the Cellulosic Cell Wall (Ames, Iowa, USA: Southern Research Station, University of Iowa and the Society of Wood Science and Technology. Blackwell Publishing). Proceedings of the workshop, Grand Lake, Colorado, 25–27 August 2003. Chapter 11. pp. 1–8
- Evans, R., Hughes, M. and Menz, D. (1999) Microfibril angle variation by scanning X-ray diffractometry. Appita Journal, 52, 363–367.
- Evans, R. and Ilic, J. (2001) Rapid prediction of wood stiffness from microfibril angle and density. Forest Prod J, 51, 53–57.
- Feeney, F. E., Chivers, R. C., Evertsen, J. A. and Keating, J. (1998) The influence of inhomogeneity on the propagation of ultrasound in wood. Ultrasonics, 36, 449–453.
- Gerhards, C. (1982) Effect of moisture content and temperature on the mechanical properties of wood: an analysis of immediate effects. Wood Fiber Scien, 14, 4–36.
- Glass, S. V. and Zelinka, S. L. (2010) Moisture relations and physical properties of wood. In R. J. Ross (ed.), Wood Handbook, Wood as an Engineering Material, General Technical Report FPL–GTR–190 (Madison, WI, USA: USDA Forest Service, Forest Products Laboratory). Chapter 4, 80–98.).
- Grabianowski, M., Manley, B. and Walker, J. C. F. (2006) Acoustic measurements on standing trees, logs and green lumber. Wood Science and Technology, 40, 205–216. doi:10.1007/s00226-005-0038-5
- Haines, D. W., Leban, J. M. and Herbé, C. (1996) Determination of Young's modulus for spruce, fir and isotropic materials by the resonance flexure method with comparisons to static flexure and other dynamic methods. Wood Science and Technology, 30, 253–263. doi:10.1007/BF00229348
- Hein, P. R. G. and Brancheriau, L. (2018) Comparison between three-point and four-point flexural tests to determine wood strength of eucalyptus specimens. Maderas-Cienc Tecnol, 20, 333–342.
- Hsu CY (2003) Radiata pine wood anatomy structure and biophysical properties. Dissertation, University of Canterbury.
- Ide, J. M. (1935) Some dynamic methods for determination of Young's modulus. Review of Scientific Instruments, 6, 296–298. doi:10.1063/1.1751876
- Jacques, D., Marchal, M. and Curnel, Y. (2004) Relative efficiency of alternative methods to evaluate wood stiffness in the frame of hybrid larch (Larix x eurolepis Henry) clonal selection. Ann Forest Sci, 61, 35–43. doi:10.1051/forest:2003082
- Jessome, A. P. (2000) Résistance et Propriétés Connexes des Bois Indigènes au Canada (Sainte-Foy, QC, Canada: SP 514-F, Forintek Canada Corp.).
- Jordan, L., Schimleck, L. R., Clark IIIA., Hall, D. B. and Daniels, R. F. (2007) Estimating optimum sampling size to determine weighted core specific gravity of planted loblolly pine. Can J Forest Res, 37, 2242–2249.
- Knowles, R. L., Hansen, L. W., Wedding, A. D. and Downes, G. E. (2004) Evaluation of non-destructive methods for assessing stiffness of Douglas fir trees. New Zeal J For Sci, 34, 87–101.
- Koubaa, A., Isabel, N., Zhang, S., Beaulieu, J. and Bousquet, J. (2005) Transition from juvenile to mature wood in black spruce (Picea mariana (Mill.) B.S.P.). Wood Fiber Scien, 37, 445–455.
- Lasserre, J.-P., Mason, E. G. and Watt, M. S. (2007) Assessing corewood acoustic velocity and modulus of elasticity with two impact based instruments in 11-year-old trees from a clonal-spacing experiment of Pinus radiata D. Don. Forest Ecol Manag, 239, 217–221. doi:10.1016/j.foreco.2006.12.009
- Legg, M. and Bradley, S. (2016) Measurement of stiffness of standing trees and felled logs using acoustics: A review. Journal of the Acoustical Society of America, 139, 588–604. doi:10.1121/1.4940210
- Liang, S. Q. and Fu, F. (2007) Comparative study on three dynamic modulus of elasticity and static modulus of elasticity for lodgepole pine lumber. J Forestry Res, 18, 309–312. doi:10.1007/s11676-007-0062-4
- Lindström, H., Harris, P., Sorensson, C. T. and Evans, R. (2004) Stiffness and wood variation of 3-year old Pinus radiata clones. Wood Science and Technology, 38, 579–597.
- Lotan, J. E. and Critchfield, W. B. (1990) Pinus contorta Dougl. ex. Loud. lodgepole pine. In R. M. Burns, and B. H. Honkala (eds.), Silvics of North America. Vol. 1. (Washington, DC, USA: Conifers, USDA, Forest Service, Agriculture Handbook). pp 302–315,
- Mahon, J. M., Jordan, L., Schimleck, L. R., Clark, A. and Daniels, R. F. (2009) A comparison of sampling methods for a standing tree acoustic device. Southern Journal of Applied Forestry, 33, 62–68.
- Mansfield, S. D., Parish, R., Di Lucca, C. M., Goudie, J., Kang, K.-Y. and Ott, P. (2009) Revisiting the transition between juvenile and mature wood: a comparison of fibre length, microfibril angle and relative wood density in lodgepole pine. Holzforschung, 63, 449–456. doi:10.1515/hf.2009.069
- MFFP (2015) Ressources et Industries Forestières: Portrait Statistique 2015 (Québec, Canada: Direction du développement de l'industrie des produits du bois).
- Middleton, G. R., Munro, B. D. and Sadlish, J. (2000) Influence of Growth Rate on Strength and Related Wood Properties of Boreal White Spruce (Vancouver, B.C.: Forintek Canada Corp.).
- Mora, C. R., Schimleck, L. R., Mahon, J. M., Isik, F., Clark, A. and Daniels, R. F. (2009) Relationships between acoustic variables and different measures of stiffness in standing Pinus taeda trees. Can J Forest Res, 39, 1421–1429. doi:10.1139/x09-062
- Mvolo, C. S., Koubaa, A., Beaulieu, J., Cloutier, A., Defo, M. and Yemele, M.-C. (2019) Phenotypic correlations among growth and selected wood properties in white spruce (Picea glauca (Moench) Voss). Forests, 10(7), 589. doi:10.3390/f10070589
- Mvolo, C. S., Koubaa, A., Beaulieu, J., Cloutier, A. and Mazerolle, M. J. (2015a) Variation in wood quality in white spruce (Picea Glauca (Moench) Voss). part I. Defining the juvenile–mature wood transition based on tracheid length. Forests, 6(1), 183–202. doi:10.3390/f6010183
- Mvolo, C. S., Koubaa, A., Defo, M., Beaulieu, J., Yemele, M.-C. and Cloutier, A. (2015b) Prediction of tracheid length and diameter in white spruce (Picea glauca). IAWA Journal, 36, 186–207. doi:10.1163/22941932-00000095
- Nienstaedt, H. and Zasada, J. C. (1990) Picea glauca (Moench) Voss white spruce. In R. M. Burns, and B. H. Honkala (eds.), Silvics of North America Conifers (Washington, DC, USA: USDA, Forest Service, Agriculture Handbook). Vol. 1. 654pp 204–226,
- Ouis, D. (2002) On the frequency dependence of the modulus of elasticity of wood. Wood Science and Technology, 36, 335–346.
- Paradis, N., Auty, D., Carter, P. and Achim, A. (2013) Using a standing-tree acoustic tool to identify forest stands for the production of mechanically-graded lumber. Sensors, 13(3), 3394–3408. doi:10.3390/s130303394
- Panshin, A. J. and de Zeuuw, C. (1980) Textbook of Wood Technology: Structure, Identification, Properties, and Uses of the Commercial Woods of the United States and Canada (New York, NY, USA: McGraw-Hill Book Co.); 4th ed.; p. 722.
- R Core Team (2017) R: A Language and Environment for Statistical Computing (Vienna, Austria: R Foundation for Statistical Computing). URL https://www.R-project.org/).
- Raymond, C. A. (2006) Density assessment of radiata pine: sampling strategy revisited. Holzforschung, 60, 580–582. doi:10.1515/HF.2006.096
- Raymond, C. A., Joe, B., Evans, R. and Dickson, R. L. (2007) Relationship between timber grade, static and dynamic modulus of elasticity, and SilviScan properties for Pinus radiata in New south Wales. New Zeal J For Sci, 37, 186–196.
- Reeb, J. and Milota, M. (1999) Moisture Content by the Oven-dry Method for Industrial Testing (Corvallis, OR, USA: WDKA, Oregon State University).
- Ross, R. J. (2015) Static bending, Transverse Vibration, and longitudinal stress wave Nondestructive Evaluation methods. In R. J. Ross (ed.), Nondestructive Evaluation of Wood: Second Edition. General Technical Report FPL-GTR-238 (Madison, WI: U.S. Department of Agriculture, Forest Service, Forest Products Laboratory), pp 5–19.
- Ross, R. J. and Pellerin, R. F. (1994) Nondestructive testing for assessing wood members in structures. General technical report FPL; GTR-70, USDA, Forest Products Laboratory, Madison, WI, U.S.A. https://doi.org/10.2737/FPL-GTR-70.
- Ross, R. J. and Pellerin, R. F. (2015) Inspection of timber structures using stress wave timing nondestructive evaluation tools. In R. J. Ross (ed.), Nondestructive Evaluation of Wood: Second Edition. General Technical Report FPL-GTR-238 (Madison, WI: U.S. Department of Agriculture, Forest Service, Forest Products Laboratory)., pp 5–19.
- Sattler, D. F., Comeau, P. G. and Achim, A. (2014) Within-tree patterns of wood stiffness for white spruce (Picea glauca (Moench) Voss) and trembling aspen (Populus tremuloides Michx.). Can J Forest Res, 44, 162–171. doi:10.1139/cjfr-2013-0150
- Sattler, D. F. and Stewart, J. D. (2016) Climate, location, and growth relationships with wood stiffness at the site, tree, and ring levels in white spruce (Picea glauca) in the Boreal Plains ecozone. Can J Forest Res, 46, 1235–1245. doi:10.1139/cjfr-2015-0480
- Schimleck, L., et al. (2019) Non-destructive evaluation techniques and what they tell us about wood property variation. Forests, 10(9), 1–50. doi:10.3390/f10090728
- Senalik CA, Schueneman G, Ross RJ (2015) Ultrasonic-based nondestructive evaluation methods for wood. In: Ross, Robert J. (Ed.). Nondestructive Evaluation of Wood: Second Edition. General Technical Report FPL-GTR-238. Madison, WI: U.S. Department of Agriculture, Forest Service, Forest Products Laboratory, pp 21–51.
- Stewart, J. D., Jones, T. N. and Noble, R. C. (2006) Long-term Lodgepole Pine Silviculture Trials in Alberta: History and Current Results (Edmonton, AB, Canada: Nat. Resourc. Can, Can. For. Serv. and Foothills Model Forest).
- Vincent, M., Krause, C. and Koubaa, A. (2011) Variation in black spruce (Picea mariana (Mill.) BSP) wood quality after thinning. Ann Forest Sci, 68, 1115–1125.
- Wang, M. and Stewart, J. (2012) Determining the transition from juvenile to mature wood microfibril angle in lodgepole pine: a comparison of six different two-segment models. Ann Forest Sci, 69, 927–937. doi:10.1007/s13595-012-0226-z
- Wang, M. and Stewart, J. D. (2013) Modeling the transition from juvenile to mature wood using modulus of elasticity in lodgepole pine. Western Journal of Applied Forestry, 28, 135–142. doi:10.5849/wjaf.12-026
- Wang, X., Carter, P., Ross, R. J. and Brashaw, B. K. (2007) Acoustic assessment of wood quality of raw forest materials - A path to increased profitability. For Prod J, 57, 6–14.
- Wang, X., Ross, R. J., McClellan, M., Barbour, R. J., Erickson, J. R., Forsman, J. W. and McGinnis, G. D. (2004) Strength and Stiffness Assessment of Standing Trees Using a Nondestructive Tress Wave Technique (WI, U.S.A. Madison, WI, U.S: USDA, Forest Products Laboratory, research paper FPL−RP−585 Madison).
- Wessels, C. B., Malan, F. S. and Rypstra, T. (2011) A review of measurement methods used on standing trees for the prediction of some mechanical properties of timber. Eur J Forest Res, 130, 881–893. doi:10.1007/s10342-011-0484-6
- Xu, P., Donaldson, L., Walker, J., Evans, R. and Downes, G. (2004) Effects of density and microfibril orientation on the vertical variation of low-stiffness wood in radiata pine butt logs. Holzforschung, 58, 673–677. doi:10.1515/HF.2004.122
- Zobel, B. J. and Sprague, J. R. (eds.). (1998) Juvenile Wood in Forest Trees (Berlin, Germany: Springer Series in Wood Science. Springer).
- Zobel, B. J. and Van Buijtenen, J. P. (eds.). (1989) Wood Variation: Its Causes and Control (Berlin, Germany: Springer Series in Wood Science. Springer).