
 ?Mathematical formulae have been encoded as MathML and are displayed in this HTML version using MathJax in order to improve their display. Uncheck the box to turn MathJax off. This feature requires Javascript. Click on a formula to zoom.
ABSTRACT
This study aimed to characterize the surface quality of beech wood (Fagus sylvatica L.) cut by a CO2-laser. Boards were conditioned to a low (about 8% moisture content), 12% and a high, (about 18% moisture content). Laser cutting was performed at varying processing parameters, i.e. cutting speed, gas pressure and focal-point position. A confocal microscope was used to determine the average surface roughness perpendicular to the grain. The anatomical structures of the laser-cut surfaces were examined with scanning electron microscope. The result showed that smoother surfaces were obtained at the low moisture content when processed at a gas pressure of 21 bar. Focal-point positioning did only have an effect on the surface roughness at 12% moisture content whereas the value was substantially lower for focal-point positioned on the surface. The surfaces cut at 18% moisture content, and at a cutting speed of 3.5 m/min generated a rougher surface than cut at low moisture content and at a lower speed. Laser cutting produced a rougher surface as compared to sawn surface (circular saw). The structural integrity of the laser-cut surface was more intact when the wood was having high moisture content and processed at a high cutting speed.
1. Introduction
Traditional wood-machining processes involve the interaction between a wooden piece and a cutting tool. However, laser-beam machining utilizes a focused laser beam to melt and/or vapourise material to produce a cut edge. Due to their higher efficiency and accuracy, this technology has become attractive in various fields of wood-industrial applications (Kubovský et al. Citation2020). For example, laser-beam cutting is applied in the furniture industry with the aim to reduce the cutting costs (Badoniya Citation2018) and this technology has already been widely implemented in the metal-, ceramic- and plastic-processing industries. In general, traditional wood machining potentially causes changes only in the physical properties of the processed surface (Kilic et al. Citation2006), while laser-beam machining is accompanied by structural, chemical and physical changes (Haller et al. Citation2001, Kačík and Kubovský Citation2011, Kubovský and Kačík Citation2013).
A laser beam cuts material by extremely fast heating of the structure, ejected from a nozzle by applying a reflecting beam from a mirror through focusing lenses. A high-energetic beam spot is focused by a lens on the wood surface (Powell Citation1993). The coherent laser beam of infrared light (wavelength 10.6 µm) usually has a power above 20 kW. However, in modern industrial laser- cutting machines, power ranging from 3.5 kW to 5.5 kW is sufficient to achieve very high production rates (Peters and Banas Citation1977, Powell and Kaplan Citation2004). The energy absorbed by the wood largely depends on the laser power and the related exposure time (Barnekov et al. Citation1986). When more energy is absorbed, the number of polysaccharides in wood declines due to the degradation processes in hemicelluloses and also in part of the amorphous regions of cellulose (Kačík and Kubovský Citation2011). Laser power forms an unavoidable charred cut on the wood surface due to pyrolysis. Across the width of a wooden piece, the internal wood structure is directly subjected to laser heat, which is referred to as the heat affected zone (HAZ). The formation of a HAZ is affected by the growth rings (i.e. density variation) (Barnekov et al. Citation1986), the fiber orientation, the laser-power input, and the workpiece thickness (Powell and Kaplan Citation2004). The surface quality of the HAZ is different from conventional processes such as sawing. The effect of HAZ can be determined by quantifying surface characteristics such as surface roughness or surface waviness.
Solid-wood surfaces are naturally uneven due to the existing variations in the anatomical structure of wood, caused by the growth rings, the ratio of earlywood and latewood, and the varying wood density (Forest Products Laboratory Citation1987, Barcikowski et al. Citation2006, Korkut and Donertas Citation2007, Bekhta et al. Citation2009, Brémaud et al. Citation2011). This is one reason why existing standards for measuring and evaluating surface quality are not applicable to wood since they only measure roughness due to a machining process (Funck et al. Citation1992, Thoma et al. Citation2015, Thibaut et al. Citation2016). Numerical values assessed with different methods (light sectioning, confocal microscopy, tactile measurement, gloss meters, pneumatic, laser) are used to determine surface irregularity. There are advantages and disadvantages while using each of these methods (Hiziroglu Citation1996, Hiziroglu and Graham Citation1998, Hirata et al. Citation2001, Merrild and Christensen Citation2009). For example, the disadvantage of image analysis (confocal or laser microscopy) is that it is tricky to differentiate between features with similar optical characteristics (Leban and Triboulot Citation1994).
The inherent properties of wood, the characteristics of applied processing tools, and the employed processing parameters all influence the surface quality of processed wood (Hazır and Koç Citation2016). Optimization of the processing parameters of CO2 laser is therefore critical to achieve better quality of laser-cut surfaces than sawn surfaces. Microscopic analyses showed that laser-cut wood surfaces are smoother than sawn surfaces (Haller et al. Citation2001, Dolan Citation2014). It is also well documented that surface roughness declines when the laser power increases (Barnekov et al. Citation1989, Quintero et al. Citation2011a, Citation2011b, Eltawahni et al. Citation2011). Gurau and Petru (Citation2018) engraved maple wood with a laser and reported that surface roughness increased as a negative response to laser power. Increased feed rate has been reported as a cause of increased roughness on MDF surfaces cut by laser (Lum et al. Citation2000, Eltawahni et al. Citation2011). An increased wood moisture content (MC) also plays an important role in the quality of laser-cut wood surfaces. A high MC requires a low feed rate (Piili et al. Citation2009) which can be explained by high thermal conductivity that leads to a reduction in the amount of energy concentrated on HAZ (McMillin and Harry Citation1971). At high MC, a substantial part of the laser energy vaporizes water and hence the amount of energy required to burn the material is reduced (Hernandez-Castaneda et al. Citation2011).
During laser cutting of wood, the quality of the cut surface is influenced by the laser parameters (focal-point position, laser power, gas pressure), processing parameters (cutting speed) and material parameters (moisture content, density, grain direction). Ascertaining the effect of these parameters may lead to increased cutting efficiency and improved surface quality. Characterization of laser-cut surfaces in terms of physical, chemical and anatomical properties is of paramount importance to ascertain its suitability for different applications. A much-debated question is whether or not a low cutting speed, a high gas pressure, and a focal point focused on the middle of a workpiece result in a smooth surface. Another question is to what extent the adjacent anatomical wood structures change due to laser-cutting, with a varying cutting speed, gas pressure and focal-point position. Because wood disintegrates through in several laser-induced ablation processes, there is a strong possibility that smoother surfaces can be achieved by laser-cutting, compared with sawing. It is also assumed that a lower cutting speed provides sufficient time for melting, and higher gas pressure partly prevents undesirable vaporization, leading to a smoother surface of the laser-cut surfaces. It has commonly been assumed that replacing the focal-point position from the top surface to the workpiece center will result in better energy distribution and thus a smoother surface after laser-cutting. Due to different levels of thermal degradation of chemical compounds during laser cutting, it is probable that the structural integrity of the laser-cut surface becomes weak.
2. Materials and methods
2.1. Materials
Kiln dried European beech (Fagus sylvatica L.) wood was purchased from the Wood Store ® company, Czech Republic. The measured average wood density was 770 kg/m3 (±12 kg/m3), while the moisture content was 16% (±0.8%). Six pieces of sawn timber with a dimension of 50 × 25 × 3 cm (length × width × thickness) were prepared and stored in a semi-opened outdoor space for two weeks.
2.2. Methods
2.2.1. CO2-laser cutting process
To study the effect of moisture content, the two pieces of sawn timber from the six pieces were conditioned in a climatic chamber at 20 ± 2 °C and 65 ± 5% relative humidity (RH) until the weight became constant, while the other two pieces were submersed in water. The average moisture content of the pieces conditioned in a climatic chamber was 12%, while that of the water-soaked pieces was about 18% (high MC). The remaining two pieces were conditioned to achieve a moisture content of about 8% (low MC). The moisture content was calculated using representative samples according to ISO 13061-1 (Citation2014).
A CO2-laser machine (TRUMPF®, Czech Republic) was used to cut the boards. The radial sections of the pieces were placed perpendicular to the laser beam in a such a way that the cutting was achieved in the tangential section along the grain (). The applied processing parameters are outlined in .
Figure 1. CO2-laser cutting process on beech wood (L- longitudinal, R- Radial and T- Tangential direction).
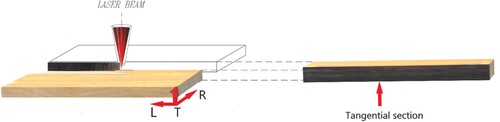
Table 1. CO2-laser machine processing parameters.
Nozzle diameter and cutting power were kept constant at 2.7 mm and 3200 W, respectively. Six sample strips were cut (parallel to grain direction) with every processing parameter combination from each of the boards representing different MC. The dimensions of the cut sample strips were 50 cm × 3 cm × 5 mm (length × width × thickness) as shown in .
To compare the laser-cut surface with a sawn surface, sawing was performed in parallel direction to the grain on the tangential section using a circular saw of blade diameter of 300 mm, blade thickness of 2.2 mm, tooth thickness of 3.2 mm, rotating speed of 4000 RPM and blade height of 60 mm.
2.2.2. Electron microscopy
Samples sized 5 × 5 × 5 mm (length × width × thickness) were cut from the specimen (laser-cut strips) to observe the cross-sections with electron microscope FEI Quanta 250 FEG (Thermo Fisher Scientific, Hillsboro, USA) under high-vacuum conditions. Micrographs were recorded with the Everhart–Thornley-Detector to collect the secondary electrons and back-scattered electrons at an accelerating voltage of 20 kV. The laser-cut samples were mounted with conductive double-sided carbon tape on an aluminum stub, which was sputter coated with a 10 nm thin gold layer under Argon atmosphere in a Scancoat Six sputter coater (Edwards, Burgess Hill, UK) for sufficient electrical conductivity. The surfaces were assessed immediately after laser cutting and after airbrushing of carbon dusts.
2.2.3. Confocal microscopy
Samples with dimensions of 3 cm × 3 cm × 5 mm (length × width × thickness) were cut from the specimen. The surface profile of the laser-cut samples (on tangential section) was measured with confocal microscope (Olympus OLS5100, Japan) with a Gaussian filter ((a)). The incident light in the microscope shines from a collimated light source on the tangential surface of the sample providing 3D images of the surface by image stacking ((b)). Primary profiles of the 3D images were obtained ((c)). The three laser-cut samples from each group (cutting speed, focal point and gas pressure) were prepared and three readings were taken from each laser-cut sample. Measurements were carried out across the grain directions.
Figure 2. (a) Configuration of a laser-cut sample for measuring a surface profile with a confocal microscope, (b) a 3D image of the laser-cut sample (c) a primary profile of the 3D image filtering the shortest wavelength components from a roughness measurement.
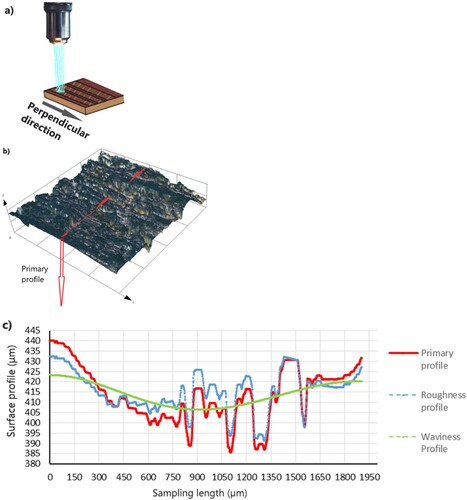
The waviness was removed from the measured profile to numerically evaluate the roughness ((c)). A cutoff value of 2.5 mm, as reported by Gurau et al. (Citation2006) was used to segregate waviness. In the present study, the roughness average was obtained pursuant to ISO 4287 (Citation2009), Ra is the arithmetic mean of the absolute coordinate values Z (profile peak height) within sampling length. Ra can be expressed by Equation (1).
(1)
(1) Statistical analysis of the experimental data was performed by applying an analysis of variance (ANOVA) as well as Fischer’s F-Test with STATISTICATM 14 (StatSoft Inc; Oklahoma, USA) software.
3. Results and discussion
3.1. Effect of CO2 laser processing parameters on surface roughness
3.1.1. Cutting speed
The first set of analyses was aimed to reveal the effects of laser processing on the surface quality. shows a two-way ANOVA of the effect of the interaction of cutting speed (3 and 3.5 m/min) and moisture content (8%, 12%, and 18%) on the average surface roughness (Ra). Constant parameters were 3200 W laser power, 21 bar gas pressure and the focal-point position on the top surface of the workpiece. No significant difference between Ra values cut at speed of 3 and 3.5 m/min with 8% / 12%, or 18% MC was obtained (). Data in showed that as the MC increased, particularly from low to the samples conditioned at 12% MC, the Ra values increased significantly when cut at 3.5 m/min (). This result may be explained by the fact that with a higher MC, a greater part of the energy was consumed for the evaporation of water, thereby reducing the energy available for thermochemical degradation of the wood elements leading to higher surface roughness.
Figure 3. The effect of cutting speed and the moisture content of laser-cut specimens on average surface roughness (Ra) measured perpendicular to the grain (bars denote 95% confidence intervals).
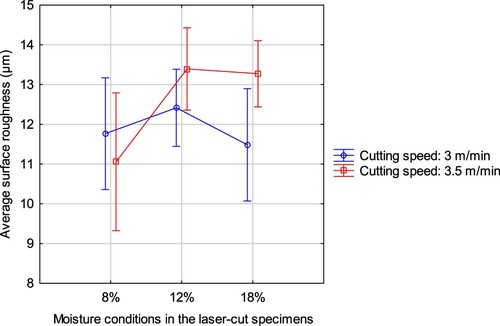
Table 2. Two-way analysis of variance (ANOVA) of average roughness (Ra) perpendicular to the grain for the effects of cutting speed (3 m/min or 3.5 m/min), and the specimens conditioned at 8%, 12% or18% MC.
A study by Lum et al. (Citation2000) has shown that in MDF, by increasing cutting speed, the average roughness of laser-cut samples increased. The authors highlighted that a lower cutting speed enabled thorough penetration of the laser beam into the wood, creating thermochemical degradation and thereby delivering a smooth transition across the cut kerf. The authors have also stated that the beam was bypassing the exposed region without full thermochemical degradation at a higher cutting speed, resulting in incomplete char formation. Eltawahni et al. (Citation2011) reported an increase in the roughness values for MDF, with an increasing cutting speed and air pressure, but, they did not provide an explanation for these increases. Barnekov et al. (Citation1989) provided an explanation for the smoother surface of a five-layered panel as a result of a lower cutting speed of a CO2-laser. The authors mentioned that with lower speed, excess heat builds up and a char layer generates. In the present study, solid beech wood was less homogenous than MDF but the latter includes adhesives and other additives. The components, other than wood, may require a greater exposure time to be fully degraded.
Wood as a heterogenous material has a low thermal conductivity (Ashby Citation2012), and with its varying chemical composition, it requires different temperature ranges and exposure time to achieve the most efficient degradation of the wood constituents. As demonstrated, a rougher or smoother surface of the laser-cut surface was not achieved when the cutting speed increased by 0.5 m/min. At a constant cutting power of 3200 W, the faster cutting speed was sufficient for cutting the 30 mm beech wood, particularly with respect to energy savings and cost reduction.
3.1.2. Focal-point positions
To study the effect of focal-point position, laser cutting was performed at a power of 3200 W, a cutting speed of 3.5 m/min and a gas pressure of 17 bar. The result has been presented in . Two-way ANOVA of the effect of the interaction of focal-point positions and moisture levels on the average surface roughness was carried out and the results are shown in . The focal-point position on the surface produced a better surface quality compared to the center position, particularly in samples conditioned to 12% MC (). When only the focal-point position is considered, the Ra differences between both the focal-point positions studied were not significant (), however, their interaction with MC had a significant effect on the surface roughness. This outcome is contrary to that of Barnekov et al. (Citation1986) who studied the effect of different focal-point positions on the surface quality and reported a smooth surface with less charring when the focal point was at or slightly above the workpiece center. The heat distribution rate is highly depending on the anatomical structure and wood properties (its discussed in part 3.2.2).
Figure 4. The effect of focal-point positions and moisture content on average surface roughness (Ra) measured perpendicular to the grain. (bars denote 95% confidence intervals).
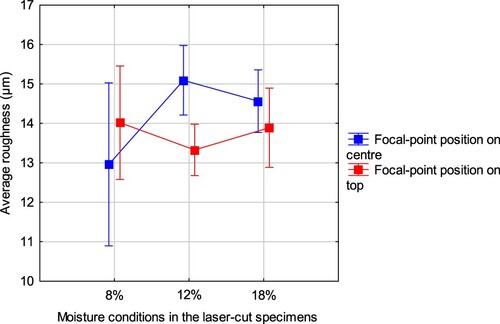
Table 3. Two-way analysis of variance (ANOVA) of average roughness (Ra) perpendicular to the grain for the effects of focal point on the top surface and at the workpiece center, and the specimens conditioned at 8%, 12% or 18% MC.
3.1.3. Gas pressure
To study the effect of gas pressure, 17 and 21 bar, laser cutting was performed at a laser power of 3200 W, a cutting speed of 3.5 m/min and a focal-point positioned on the surface of the sample. shows the results pertaining to the effect of gas pressure and MC (8%, 12%, or 18%), on the average surface roughness of the samples. The data were analyzed using two-way ANOVA and the results are shown in . In , it is quite apparent that the Ra value of the cut at 21 bar gas pressure increased significantly as the MC of the sample increased from 8% to 18%. However, at a gas pressure of 17 bar, the Ra values for each of the MC, 8–18%, studied were more or less comparable without any significant difference. The pooled data indicates a significant effect of gas pressure on the surface roughness (), however this difference is mainly contributed by the extreme roughness values of samples at low MC (). A low MC (8%) ensures maximum absorption of energy by the wood resulting in faster degradation and instantaneous production of smoke and carbon dust. A high gas pressure helps in faster removal of smoke and carbon dust thereby promoting efficient cut with smoother surface. Such benefits of higher gas pressure could not be seen with a MC of 18% due to the fact that higher MC limits the degradation process and the generated carbon particles get trapped with the evaporated moisture from the wood and sticks to the wood surface thereby contributing to a rough surface.
Figure 5. The effect of the interaction between gas pressure and moisture content on average surface roughness (Ra) measured perpendicular to the grain (vertical bars denote 95% confidence intervals).
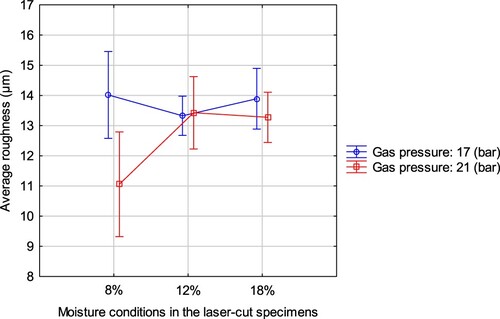
Table 4. Two-way analysis of variance (ANOVA) of average roughness (Ra) perpendicular to the grain for the effects of gas pressures of 17, or 21 bar and the specimens conditioned at 8%, 12% and 18% MC.
Lum et al. (Citation2000) used two different shield gas pressures (0.5 and 2.5 bar) to cut medium density fiberboards (MDF) and reported comparable surface roughness values at both gas pressures without any significant difference. In contrast, Eltawahni et al. (Citation2011) studied the effect of gas pressure, which ranged between 4.5 and 6.0 bar, on the surface quality of laser-cut MDF and reported a decrease in surface roughness (Ra) values with an increase in the gas pressure. When wood is cut with a laser beam, a jet of gas is needed to exhaust the smoke, control the excessive burning, and protect the lens and a gas pressure up to 4 bar is usually employed in cutting solid wood (Barnekov et al. Citation1986). Hernandez-Castaneda et al. (Citation2011) stated that when the gas pressure increased, the interaction between the laser beam and the material also improved. The lens is protected against fumes and carbon dust. In addition, charring on the laser-cut surface is also reduced (Powell Citation1993, Quintero et al. Citation2011a). It is important to note that the gas pressure experimented with in this study was between 17 and 21 bar, such a high gas pressure was applied due to the high wood density (677 kg/m3 to 863 kg/m3), and a fast cutting speed.
The average roughness parameter (Ra) obtained with a circular saw was 5.25 µm which was significantly lower than the average Ra of laser-cut surfaces. The higher Ra value for the laser-cut can be attributed to the formation of charred layers and different charring rates for earlywood (lower rate) and latewood (higher rate). In addition, the laser cutting marks observed may be due to the small vibration of the wood pieces during laser cutting.
3.2. The effect of CO2 processing parameters on the anatomical structure of laser-cut beech samples
3.2.1. Cutting speed and the anatomical structure
To discover the changes that likely occurred in the anatomical structure of the specimen during the laser cutting, a scanning electron microscope (SEM) was used. SEM micrographs of the specimen conditioned to 8% MC and laser-cut at different cutting speeds (3.5 m/min -and 3 m/min), with the focal point focused on the top surface, are shown in . (a) (magnification: 2625x) and 6b (magnification:10662x) show different magnified micrographs taken from the specimen cut at a speed of 3.5 m/min, while (c) (magnification: 3075x) and 6d (magnification:11748x) show micrographs of a specimen cut at speed of 3 m/min. It is evident from the micrographs that the anatomical integrity of the specimen cut at 3 m/min in most of the areas ((a,b)) is lower than that obtained at 3.5 m/min ((c,d)). The middle lamella between the fiber walls was completely degraded when the specimen was cut at a low speed ((c)), while at a high speed the degradation of middle lamella was only partial. The middle lamella is in general mostly composed of lignin, pectic polysaccharides and a small amount of proteins (Lazić et al. Citation2018), and the lignin proportion can be up to 84%. The lignin proportion decreases and the cellulose proportion increases from the middle lamella towards the S3 layer (adjacent to the lumen) (Rowell Citation2005). The thermal degradation of lignin is slower at 200–500°C than cellulose and hemicellulose components of biomass (Brebu and Vasile Citation2010). However, the accessibility of lignin is quite higher than that of cellulose. Electron transitions are caused by visible and ultraviolet (UV-VIS) radiation, mostly creating changes in lignin. A CO2 laser in the range of far infrared does not the same. Particular vibrational changes in the molecules caused by the CO2-laser result in thermal action (Haller et al. Citation2001, Kačík and Kubovský Citation2011). What can be clearly seen in (b) is apparently a portion of polymer chains, maybe the crystalline portion of cellulose, in the deeper walls of fiber, S2 and S3, remained unchanged by thermal degradation and looks like a white portion protruding out from the end of fibers in the samples cut at higher speed. In contrast, at a lower speed, as shown in (d), the polymer chains were completely degraded without any polymer chains remaining. This may be explained by the fact that at lower speed the exposure time of the wood to the laser is higher and the heat energy generation surpasses the energy dissipation through conduction. The residual energy (difference between heat energy generated and heat energy dissipated due to conduction) at the exposure point is high enough to thermally degrade the polymer chains completely. When the speed is increased, the exposure time is reduced and the residual energy at the exposure point is comparatively lower due to energy dissipation through conduction. The residual energy is still sufficient enough to degrade the lignin and cellulose polymers at the point of exposure; however, the energy conducted through the probably cellulose gets dissipated to the underlying lignin and seems sufficient enough to degrade the underlying lignin up to a certain distance (∼ 1 µm) from the exposure point, leaving the crystalline portion of cellulose unaffected. As a result, the unaffected cellulose protrudes from the cut end of the fibers, as can be seen in (b). These projections are more towards the cell lumen, as the cellulose content is higher towards that side. Further, selective degradation (more lignin and less cellulose) at higher speed did not affect the micro voids present in the fiber walls; however, these voids have been covered by the degradation byproducts in samples cut at a lower speed.
Figure 6. SEM micrographs taken from the cross-section of laser-cut samples: (a) and (b) are from specimen laser-cut at speed of 3.5 m/min; (c) and (d) are from specimen laser-cut at speed of 3 m/min.
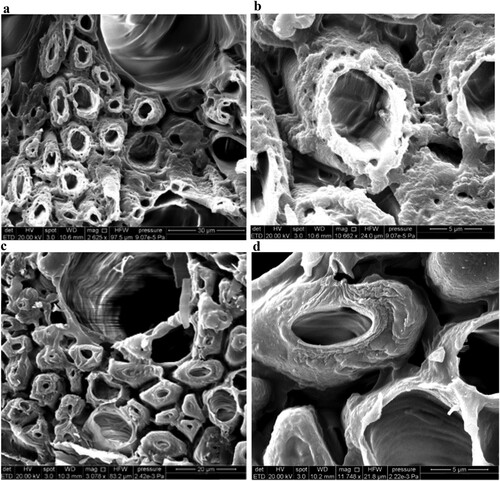
The remaining polymer chains as projections, and the absence of middle lamella as cavities on the cross-section of the laser-cut samples, can be a signal for changes in the surface roughness profile. Observing the anatomical changes of the samples in the cross-section, the anatomical changes are expected to be roughly the same on the tangential surface, leading to changes in the surface roughens profile. As explained earlier in , the average roughness of the samples cut by laser in the tangential plane was not affected by increasing the cutting speed from 3 to 3.5 m/min. This indicates that potential anatomical changes in the tangential plane do not affect the Ra.
3.2.2. Focal-point positions and the anatomical structure
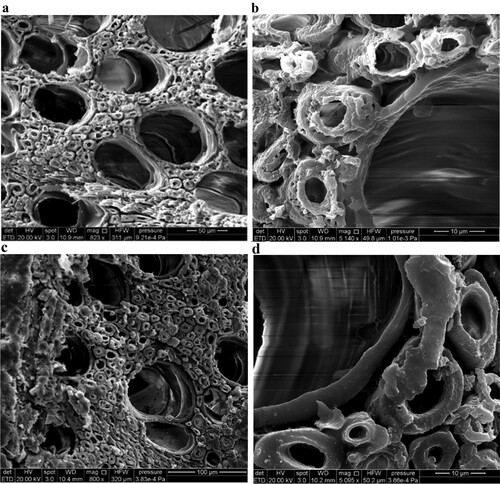
The result of SEM analyses of the laser-cut samples cut by different focal-point positions is shown in . Samples conditioned to 8% MC were cut at a constant cutting speed of 3.5 m/min, gas pressure of 17 bar and conditioned to 8% MC. (a) (magnification: 823x) and 7b (Magnification: 5140x) depict the SEM micrographs (with different magnification) of the cross-section of a sample cut with the focal-point positioned on the sample’s surface, while 7c (magnification: 800x) and 7d (magnification: 5095x) depict the cross-section of a sample cut with the focal-point positioned in the middle of the sample’s thickness. The lower part of laser-cut samples (cross-section) was selected for SEM analysis. When the focal point is on the surface, the concentration of energy is initially higher on the surface, and then it distributes from the upper parts of the samples to the lower parts. The lower part of the laser-cut samples absorbed less energy than the upper parts. This resulted in better anatomical integrity of the lower part and less burning. This may be one of the reasons why the middle lamella in most parts disappeared less between cells in the laser-cut samples with the focal point on the surface ((a,b)). The absence of a middle lamella provides empty spaces in the cross-section of the laser-cut samples, which probably leads to changes in the surface roughness profile. The empty spaces on the cross-section of the laser-cut samples can presumably also occur in the tangential phase. As explained earlier in , laser-cut samples at 12% MC were rougher in the tangential plane when the focal point was relocated from the top to the workpiece center. The empty spaces may therefore be one of the possible reasons for the rougher surfaces. It can also be stated that when the focal point is placed on the surface, energy distributes equally on the surface and less burning occurs, finally enhancing the material integrity. More detailed observations of the SEM photo ((d)) indicated the presence of small bubbles mostly on the cell wall. This is probably due to the pressure of liquid or vapor under laser power (Ghany and Newishy Citation2005), as well as gas pressure, which formed during the pyrolysis process (carbon monoxide, hydrogen, carbon dioxide, methane and other light hydrocarbons) (Commandré et al. Citation2011).
Figure 7. SEM photos taken from the cross-section of laser-cut samples with: (a) and (b) are from specimen laser-cut with the focal-point position on top surface, (c) and (d) are from specimen laser-cut with the focal-point position at the workpiece center.
3.2.3. The effect of moisture content on the anatomical structure of wood
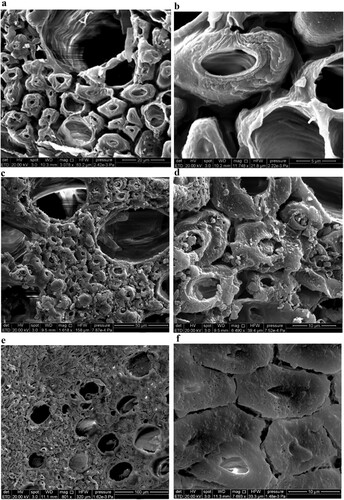
SEM micrographs of the cross-section of the samples cut at different MC are presented in . All the samples were cut at a constant speed of 3 m/min, laser power of 3200 W, and gas pressure of 21 bar, with the focal-point positioned at the workpiece center. (a,b) shows the cross-section of samples conditioned to 8% MC (with different magnification levels), (c,d) shows the cross-section of samples conditioned to 12% MC, and (e,f) shows the cross-section of a sample conditioned to 18% MC. The SEM micrographs show that high MC in the samples improves the quality of the laser-cut surface. At low MC, the middle lamella between the fiber walls is seen completely disintegrated and the fiber lumens are seen devoid of any deposits. At a low MC, the thermal degradation and evaporation seems quite efficient, as most of the laser energy is absorbed by the wood elements. As MC increases, the thermal disintegration of the middle lamella is restricted. This may be due to increased thermal conductivity of wood with increased MC (MacLean Citation1941, Vay et al. Citation2015) leading to faster energy dissipation through conduction. In addition, a part of the thermal energy is also consumed for evaporation of moisture (Barnekov et al. Citation1986, Piili et al. Citation2009, Hernandez-Castaneda et al. Citation2011). The byproducts of thermal degradation combined with the water vapor may form a slurry and get deposited on the cut surface, thereby sealing the fiber lumens as well as the crevices of the middle lamella and creating an even surface, as seen in (d,f).
Figure 8. SEM photos taken from the cross-section of laser-cut samples conditioned at: (a) and (b) 8% MC, (c) and (d) 12% MC, and (e) and (f) 18% MC (with constant cutting parameters of 3 m/min, 21bar, focal-point at workpiece center)
4. Conclusion
Sawn timber of European beech was cut by CO2 laser using different cutting speeds, gas pressure, focal-point positions and wood moisture content (MC). The effect of these parameters on surface quality and anatomical changes on the cut surface was assessed. The results show that cutting speed has no effect on the average surface roughness. Positioning the focal point at the center in the thickness of the workpiece rather than on the surface also did not cause any significant effect on the surface roughness, except in the laser-cut samples at 12% MC. However, an increase in gas pressure resulted in a lower average surface roughness, particularly in laser-cut samples with lowest moisture content. Overall, the laser-cut surfaces were rougher than those cut by a circular saw. Anatomical study revealed reduced structural integrity of the laser-cut samples at low cutting speed. The middle lamella between the fiber walls was completely degraded when the samples were cut at a low speed, while at a high cutting speed the middle lamella was only partially disintegrated.
Disclosure statement
No potential conflict of interest was reported by the author(s).
References
- Ashby, M. F. (2012) Materials Selection in Mechanical Design. Butterworth-Heinemann, In 4, Elsevier Ltd, 640. doi:10.1016/C2009-0-25539-5.
- Badoniya, P. (2018) CO2 laser cutting of different materials—a review. International Research Journal of Engineering and Technology (IRJET), 5, 1–12.
- Barcikowski, S., Koch, G. and Odermatt, J. (2006) Characterisation and modification of the heat affected zone during laser material processing of wood and wood composites. Holz als Roh- und Werkstoff, 64(2), 94–103. doi:10.1007/s00107-005-0028-1
- Barnekov, V. G., McMillin, C. W. and Huber, H. A. (1986) Factors influencing laser cutting of wood. Forest Products Journal, 36(1), 55–58.
- Barnekov, V., Huber, H. A. and McMillin, C. W. (1989) Laser machining wood composites. Forest Products Journal, 39(10), 76–78.
- Bekhta, P., Hiziroglu, S. and Shepelyuk, O. (2009) Properties of plywood manufactured from compressed veneer as building material. Materials & Design, 30(4), 947–953. doi:10.1016/j.matdes.2008.07.001
- Brebu, M. and Vasile, C. (2010) Thermal degradation of lignin—a review. Cellulose Chemistry & Technology, 44(9), 353.
- Brémaud, I., Gril, J. and Thibaut, B. (2011) Anisotropy of wood vibrational properties: Dependence on grain angle and review of literature data. Wood Science and Technology, 45(4), 735–754. doi:10.1007/s00226-010-0393-8
- Commandré, J. M., Lahmidi, H., Salvador, S. and Dupassieux, N. (2011) Pyrolysis of wood at high temperature: The influence of experimental parameters on gaseous products. Fuel Processing Technology, 92(5), 837–844. doi:10.1016/j.fuproc.2010.07.009
- Dolan, J. A. (2014) Characterization of laser modified surfaces for wood adhesion (Doctoral dissertation, Virginia Tech).
- Eltawahni, H. A., Olabi, A. G. and Benyounis, K. Y. (2011) Investigating the CO2 laser cutting parameters of MDF wood composite material. Optics & Laser Technology, 43(3), 648–659. doi:10.1016/j.optlastec.2010.09.006
- Forest Products Laboratory (US) (1987) Wood Handbook: Wood as an Engineering Material (No. 72). The Laboratory.
- Funck, J. W., Forrer, J. B., Buttler, D. A., Brunner, C. C. and Maristany, A. G. (1992) Measuring surface roughness on wood: A comparison of laser-scatter and stylus-tracing approaches. The International Society for Optical Engineering (SPIE), 1821, 173–184.
- Ghany, K. A. and Newishy, M. (2005) Cutting of 1.2 mm thick austenitic stainless-steel sheet using pulsed and CW Nd: YAG laser. Journal of Materials Processing Technology, 168(3), 438–447. doi:10.1016/j.jmatprotec.2005.02.251
- Gurau, L. and Petru, A. (2018) The influence of CO2 laser beam power output and scanning speed on surface quality of Norway maple (Acer platanoides). BioResources, 13(4), 8168–8183. doi:10.15376/biores.13.4.8168-8183
- Gurau, L., Mansfield-Williams, H. and Irle, M. (2006) Filtering the roughness of a sanded wood surface. Holz als Roh- und Werkstoff, 64(5), 363–371. doi:10.1007/s00107-005-0089-1
- Haller, P., Beyer, E., Wiedemann, G., Panzner, M. and Wust, H. (2001, April) Experimental study of the effect of a laser beam on the morphology of wood surfaces. In First International Conference of the European Society for Wood Mechanics, 19Á21 April, Lausanne, Switzerland. Accessed 9 January 2002, available at: https://www.researchgate.net/publication/237543545
- Hazır, E. and Koç, K. H. (2016) Optimization of wood surface machining parameters in CNC routers: Response surface methodology (RSM) approach. International Journal of Scientific Research Engineering & Technology, 5(10), 494–501.
- Hernandez-Castaneda, J. C., Sezer, H. K. and Li, L. (2011) The effect of moisture content in fibre laser cutting of pine wood. Optics and Lasers in Engineering, 49(9-10), 1139–1152. doi:10.1016/j.optlaseng.2011.05.008
- Hirata, S., Ohta, M. and Honma, Y. (2001) Hardness distribution on wood surface. Journal of Wood Science, 47(1), 1–7. doi:10.1007/BF00776637
- Hiziroglu, S. (1996) Surface roughness analysis of wood composites: A stylus method. Forest Products Journal, 46(7, 8), 67.
- Hiziroglu, S. and Graham, M. (1998) Effect of press closing time and target thickness on surface roughness of particleboard. Forest Products Journal, 48(3), 50.
- ISO 13061-1. (2014) Physical and mechanical properties of wood - test methods for small clear wood specimens - Part 1: Determination of moisture content for physical and mechanical tests.
- ISO, E. 4287. (2009) Geometrical product specifications (GPS). Surface texture. Profile method. Terms. Definitions and surface texture parameters. International Organization for Standardization. 1997+ Amd1: 2009.
- Kačík, F. and Kubovský, I. (2011) Chemical changes of beech wood due to CO2 laser irradiation. Journal of Photochemistry and Photobiology A: Chemistry, 222(1), 105–110. doi:10.1016/j.jphotochem.2011.05.008
- Kilic, M., Hiziroglu, S. and Burdurlu, E. (2006) Effect of machining on surface roughness of wood. Building and Environment, 41(8), 1074–1078. doi:10.1016/j.buildenv.2005.05.008
- Korkut, I. and Donertas, M. A. (2007) The influence of feed rate and cutting speed on the cutting forces, surface roughness and tool–chip contact length during face milling. Materials & Design, 28(1), 308–312. doi:10.1016/j.matdes.2005.06.002
- Kubovský, I. and Kačík, F. (2013) Changes of the wood surface colour induced by CO2 laser and its durability after the xenon lamp exposure. Wood Research, 58(4), 581–590. Available online: http://www.woodresearch.sk/wr/ 201304/07.pdf (accessed on 21 January 2014).
- Kubovský, I., Krišťák, Ľ, Suja, J., Gajtanska, M., Igaz, R., Ružiak, I. and Réh, R. (2020) Optimization of parameters for the cutting of wood-based materials by a CO2 laser. Applied Sciences, 10(22), 8113. doi:10.3390/app10228113
- Lazić, B. D., Pejić, B. M., Kramar, A. D., Vukčević, M. M., Mihajlovski, K. R., Rusmirović, J. D. and Kostić, M. M. (2018) Influence of hemicelluloses and lignin content on structure and sorption properties of flax fibers (Linum usitatissimum L.). Cellulose, 25(1), 697–709. doi:10.1007/s10570-017-1575-4
- Leban, J. M. and Triboulot, P. (1994) Défauts de forme et états de surface.
- Lum, K. C. P., Ng, S. L. and Black, I. (2000) CO2 laser cutting of MDF: 1. Determination of process parameter settings. Optics & Laser Technology, 32(1), 67–76. doi:10.1016/S0030-3992(00)00020-7
- MacLean, J. D. (1941) Thermal conductivity of wood. In Heating, Piping & Air Conditioning, 13, 380–391.
- McMillin, C. W. and Harry, J. E. (1971) Laser machining of southern pine. Forest Products Journal, 21(10), 35–37.
- Merrild, H. and Christensen, T. H. (2009) Recycling of wood for particle board production: accounting of greenhouse gases and global warming contributions. Waste Management & Research: The Journal for a Sustainable Circular Economy, 27(8), 781–788.
- Peters, C. C. and Banas, C. M. (1977) Cutting wood and wood-base products with a multikilowatt CO2 laser. Forest Production, 27(11), 41–45.
- Piili, H., Hirvimäki, M., Salminen, A. and Lindell, H. (2009) Repeatability of laser cutting of uncoated and coated boards. In Proceedings of the NOLAMP (conference paper, Copenhagen), pp. 24–26.
- Powell, J. (1993) CO2 Laser Cutting (Vol. 214) (London: Springer-Verlag).
- Powell, J. and Kaplan, A. (2004, April) Laser cutting: from first principles to the state of the art. In Pacific International Conference on Applications of Lasers and Optics (Vol. 2004, No. 1) (Laser Institute of America), p. 101. doi:10.1007/s00226-010-0393-8
- Quintero, F., Riveiro, A., Lusquiños, F., Comesaña, R. and Pou, J. (2011a) Feasibility study on laser cutting of phenolic resin boards. Physics Procedia, 12, 578–583. doi:10.1016/j.phpro.2011.03.073
- Quintero, F., Riveiro, A., Lusquiños, F., Comesaña, R. and Pou, J. (2011b) CO2 laser cutting of phenolic resin boards. Journal of Materials Processing Technology, 211(11), 1710–1718. doi:10.1016/j.jmatprotec.2011.05.014
- Rowell, R. M. (2005) Handbook of Wood Chemistry and Wood Composites (Baco raton: CRC Press).
- Thibaut, B., Denaud, L., Collet, R., Marchal, R., Beauchêne, J., Mothe, F., Méausoone, P. J., Martin, P., Larricq, P. and Eyma, F. (2016) Wood machining with a focus on French research in the last 50 years. Annals of Forest Science, 73(1), 163–184.
- Thoma, H., Peri, L. and Lato, E. (2015) Evaluation of wood surface roughness depending on species characteristics. Maderas. Ciencia y tecnología, 17(2), 285–292.
- Vay, O., De Borst, K., Hansmann, C., Teischinger, A. and Müller, U. (2015) Thermal conductivity of wood at angles to the principal anatomical directions. Wood Science and Technology, 49(3), 577–589. doi:10.1007/s00226-015-0716-x