
Abstract
Aim: We investigate the genome-wide DNA methylation (DNAm) patterns of term low birth weight (TLBW) neonates. Methods: In the discovery phase, we assayed 32 samples (TLBW/control:16/16) using the EPIC 850k BeadChip Array. Targeted pyrosequencing of in 60 samples (TLBW/control:28/32) using targeted pyrosequencing during the replication phase. Results: The 850K array identified TLBW-associated 144 differentially methylated positions (DMPs) and 149 DMRs. Nearly 77% DMPs exhibited hypomethylation, located in the opensea and gene body regions. The most significantly enriched pathway in KEGG is sphingolipid metabolism (hsa00600), and the genes GALC and SGMS1 related to this pathway both show hypomethylation. Conclusion: Our analysis provides evidence of genome-wide DNAm alterations in TLBW. Further investigations are needed to elucidate the functional significance of these DNAm changes.
Plain language summary
This study looked at the DNA of babies born after 37 weeks of pregnancy but weighing less than 2500 grams. We found that these babies had lower levels of DNA methylation, which might change how their bodies handle fats.
TWEETABLE ABSTRACT
This study offers a comprehensive exploration of the DNA methylation landscape in TLBW. We identified TLBW-associated 144 DMPs and 149 DMRs. Several DMPs related genes involved in crucial processes such as immune response, transcriptional regulation and sphingolipid metabolism.
Epigenetic regulation
Epigenetic regulation, particularly DNA methylation may play an important role in the development of term low birth weight (TLBW).
Genome-wide methylation patterns
Our study presents a landmark investigation, marking the first-ever comprehensive comparison of genome-wide methylation patterns in the peripheral blood of TLBW and term normal birth weight (TNBW) neonates.
Differential methylation analysis
For the first time, we identified 144 differentially methylated positions and 149 differentially methylated regions in the peripheral blood of TLBW neonates.
Implicated genes
This novel revelation highlights the genes implicated in term low birth weight, notably KY, CEP164, ATG7, CHSY1, GADD45G, PRKAR1B and SH3BP5.
Distinctive methylation profile
A striking observation was the predominance of hypomethylation, encompassing almost 77% of differentially methylated positions, suggesting that reduced DNA methylation levels constitute a hallmark feature of TLBW neonates.
Immune & inflammatory responses
Our results resonate with the perturbed methylation of genes governing immune and inflammatory responses in TLBW neonates.
Sphingolipid metabolism
Our findings accentuate the intriguing possibility of sphingolipid metabolism's involvement in the intricate mechanism underpinning TLBW.
Interdisciplinary investigations
Future investigations are poised to combine diverse omics disciplines, including genomics, metabolomics and proteomics, to provide a more comprehensive perspective on TLBW's epigenetic mechanisms.
1. Background
Term low birth weight (TLBW), defined as neonates delivered at full term weighing less than 2500g, is still prevalent and remains an intractable global public health problem. In 2020, 19.8 million newborns, accounting for approximately 14.7% of all births globally that year, suffered from low birth weight (LBW) [Citation1]. Notably, among neonates who are small for gestational age (SGA) in low- and middle-income countries, a striking 45% are classified as TLBW, while merely 6% are classified as preterm [Citation2]. These newborns face a significantly elevated risk of morbidity and mortality within the first month of life and also remain vulnerable to the onset of other health conditions later in life. Accumulating evidence supports that TLBW is a risk factor for the development of adult kidney and cardiovascular disease [Citation3–5]. Understanding the underlying mechanisms of TLBW and identifying associated risk factors are crucial steps toward reducing morbidity and improving their long-term health outcomes.
The major determinants for the significant variation in fetal birth weight are still not fully understood. TLBW is commonly associated with factors contributing to intrauterine growth restriction (IUGR). These factors can be classified into several general categories: socio-demographic factors; medical risks before pregnancy; risks of the current pregnancy (such as gestational hypertension and diabetes; maternal nutrition, placental causes); prenatal care; environmental and behavioral risks (involving exposure to pollutants, smoking, alcohol consumption or illicit drug use during pregnancy) [Citation6].
In recent years, there has been a growing interest in investigating the role of genetics in the regulation of birth weight. Studies have identified several genetic variants associated with birth weight. Genome-wide association studies (GWAS) have played a crucial role in this area, revealing hundreds of genomic loci that are associated with fetal growth [Citation7,Citation8]. Maternal TCF7L2 Type 2 diabetes–risk genotypes at rs7903146 are associated with increased offspring birth weight [Citation9]. Elevated placental expression of the imprinted PHLDA2 gene has been reported to be associated with LBW [Citation10]. Maternal MTHFR C677T polymorphism was also associated with LBW [Citation11].
Epigenetic regulation, encompassing processes such as DNA methylation (DNAm), histone post-translational modifications and noncoding RNAs, has emerged as a key mechanism in understanding the intricate interplay between genetics and the environment in disease pathogenesis [Citation12–14]. DNAm, the most typical process of epigenetic regulation, occurs throughout the life cycle from embryo to adult and can directly inhibit transcription or indirectly suppress gene expression through transcriptional silencing [Citation15,Citation16]. Notably, epigenetic changes, particularly changes in DNAm profiles, have been repeatedly proposed as a potential molecular mechanism linking various prenatal risk factors to adverse maternal outcomes, such as LBW and preterm birth.
Several studies have tried to explore changes in the DNAm profile of TLBW neonates. Hayashi et al. analyzed umbilical cord blood from 4 TLBW cases and found 483 hyper-differentially methylated genes (DMGs) and 35 hypo-DMGs in the TLBW promoter region [Citation17]. Similarly, MAO et al. detected differentially methylated regions (DMRs) in cord blood and placental DNA of TLBW neonates [Citation18]. Tekola-Ayele et al. found that placenta methylation at 15 CpGs was associated with birthweight [Citation19]. Moreover, specific gene methylation patterns have been reported to be associated with TLBW. For instance, Tian et al. found that per one standard deviation increase in the DNAm of CpG 11 at FGFR2, the risk of TLBW increased by 1.64-times [Citation20]. Additionally, cord blood and maternal blood AHRR DNAm may be independently associated with TLBW in different ways [Citation21].
Examination of cord blood or placental tissue may serve as indirect evidence of intrauterine conditions. Changes in DNA methylation patterns in peripheral blood provide more direct evidence. However, limited by the difficulty of collecting peripheral blood samples from newborns after birth, these past studies mainly studied the methylation levels of cord blood or placental tissue. Many studies mainly focus on target genomic regions, are relatively small in scale, and do not fully consider the influence of gestational age factors. There is currently a lack of large-scale methylation profiling analysis of postnatal peripheral blood of TLBW. In our study, we conducted a two-stage case-control study. For the first time, we performed genome-wide DNA methylation analysis using peripheral blood samples from TLBW neonates. We identified differentially methylated positions (DMPs) and performed bioinformatics analysis to explore the potential signaling pathways.
2. Materials & methods
2.1. Study population
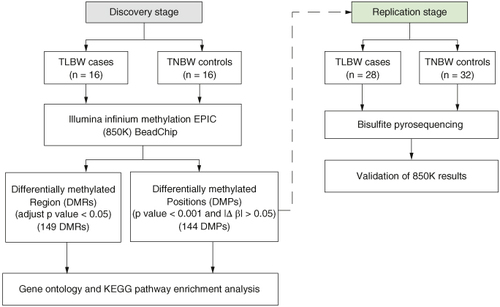
We conducted a two-stage case-control study comprising a discovery stage and a replication phase. This study was approved by the China-Japan Friendship Hospital ethics committee board (number: 2023-KY-057). All methods were carried out in accordance with relevant guidelines and regulations. Parental informed consent was obtained in writing from each participant. The study design flowchart is depicted in . The TLBW group included neonates (birth weight <2500 g, gestational age ≥37 weeks) born at a tertiary general hospital in Beijing, China between July 2019 and April 2023. We excluded mothers who smoked or consumed alcohol during pregnancy, had pregnancies resulting from in vitro fertilization, experienced multiple births or had neonates with birth defects. The healthy control comprised singleton full-term neonates with normal birth weight (term normal birth weight, TNBW group, 2500 g< birth weight <4000 g, gestational age ≥37 weeks) born at the same hospital during the same period. We meticulously matched the controls to the case group based on gestational age, sex and the mother's delivery age. The discovery phase included 32 neonates (16 in the TLBW group and 16 in the TNBW group), while the verification stage consisted of 60 neonates (28 in the TLBW group and 32 in the TNBW group).
Figure 1. Flowchart of study design.
We reviewed the hospital's electronic medical record system to obtain clinical information, including gender, gestational age, birth weight, parity, length and head circumference. We also gathered information regarding the mother's age at delivery, pre-pregnancy weight and height, weight gain during pregnancy, pre-pregnancy BMI, mode of delivery and the newborn father's age.
2.2. Sample collection & DNA extraction
Peripheral blood samples were collected from all participants prior to feeding and treatment within 4 h of birth. Each sample (2 ml) was collected in EDTA tubes and then stored at -80℃ prior to analysis. DNA was extracted from the peripheral blood samples using the DNeasy Blood & Tissue Kit (Qiagen) following the manufacturer's protocol. DNA concentration and purity were examined by agarose gel electrophoresis and NanoDrop 2000.
2.3. 850K BeadChip DNA methylation profiling
We performed bisulfite conversion on the purified DNA samples using the DNA bisulfite conversion kit (Zymo Research) following the manufacturer's guidelines and protocol. Bisulfite-converted DNA was amplified, fragmented and then hybridized to the Illumina Infinium Human MethylationEPIC BeadChip(850K), which permits the simultaneous analysis of methylation at over 850,000 CpG sites throughout the genome. The BeadChip arrays were scanned on the Illumina iScan System, and raw methylation data were extracted using Illumina's Genome Studio Methylation Module. The software calculates the degree of DNAm from the raw signal value and expresses it as a β value ranging from 0 (unmethylated) to 1 (fully methylated). The β value represents the proportion of methylated cytosines at a specific CpG site. Subsequent processing and analysis of the methylation data were performed using the R programming language.
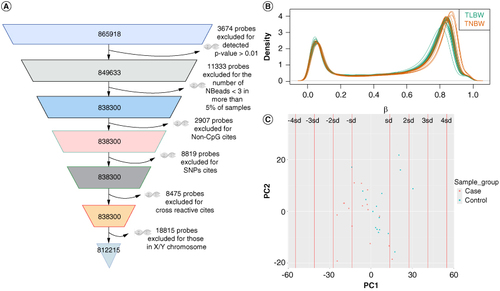
The Bioconductor R package minfi was utilized for data quality control. We conducted a series of filtering steps to exclude low-quality and irrelevant probe sites, as shown in A. We filtered out probes with p-values greater than 0.01. We excluded non-CpG probes, sex-chromosome probes, probes with a single nucleotide polymorphism (SNPs) at the CpG site (minor allele frequency (MAF) ≥ 5%, and probes with the number of NBeads <3 in more than 5% of samples.
Figure 2. Quality control of the methylation array data. (A) Flowchart of the 850K chip probes filtration process. A total of 812215 finalized probes were generated. (B) Density plot of raw methylation β values distributions. Each line represents the mean of each individual in that group combination. (C) Principal component analysis (PCA) of all probes from the two groups of samples. Different groups are represented by different colors. All samples are in the range of 4 standard deviations of principal component 1 and principal component 2, respectively.
We applied several methods to correct for technical biases and batch effects. First, we utilized the BMIQ algorithm from the R package ChAMP. This algorithm performs Infinium type I and type II probe bias correction, ensuring that the methylation measurements from different probe types are normalized and comparable. Next, we conducted principal component analysis (PCA) of the raw beta values for the 850K BeadChips. It allowed us to understand the natural clustering of samples based on their methylation profiles. To correct for batch effects, we employed the ‘champ.runCombat’ function from the ChAMP package. This function utilizes a singular value decomposition (SVD) method to remove any unwanted technical variations that might arise due to different experimental batches or processing conditions. Furthermore, we implemented the SmartSVA algorithm for cell heterogeneity correction. We also used sex and gestational age as covariates for differential methylation analysis correction.
DMPs analysis was performed using the champ.DMP function of the ChAMP package. We set the criteria for statistical significance as follows: a p-value < 0.001 and |Δβ| >0.05 [Citation22–24]. Specifically, a Δβ greater than 0.05 indicated hypermethylation, whereas a Δβ less than -0.05 indicated hypomethylation. In addition to single-site DMP analysis, we also utilized the DMRcate package to identify DMRs. A DMR was considered significant when it included at least 7 probes within a window of 200–10000 bp and the corrected p value after Benjamini & Hochberg correction was <0.05.
Gene Ontology (GO) analysis is a widely used method for functional enrichment studies, including three main categories: biological process (BP), molecular function (MF) and cellular component (CC). Similarly, the Kyoto Encyclopedia of Genes and Genomes (KEGG) is a valuable database that provides information on biological pathways, genetics, metabolism and environmental interactions. We conducted GO and KEGG pathway enrichment analyses of the DMPs-related genes using the ClusterProfiler package. The significance of enrichment was assessed using the hypergeometric test, and a p value less than 0.05 was considered as the threshold for determining the significant enrichment of differential genes in specific GO terms and KEGG pathways.
2.4. Validation of DNA methylation by pyrosequencing
Four significant CpG sites (cg09530217, cg16955800, cg24312537, cg27041096) covering four genes were validated with pyrosequencing. These CpGs were chosen for their significance, Δβ and proximity to a gene promoter. Genomic DNA was extracted from the peripheral blood of the replication sample (28 TLBW: 32 matched controls) using the DNeasy Blood & Tissue Kit (Qiagen). The sodium bisulfite conversion was performed with EZ DNA Methylation kits (Zymo Research) following the manufacturer's instructions. Primers were designed using the PyroMark Assay Design software 2.0 (Additional file 4). The target fragment was amplified with PCR. Pyrosequencing reactions were performed using a PyroMark Q96 system (QIAGEN).
2.5. Statistical analysis
Descriptive statistics for demographic information and clinical variables are reported. Continuous variables were reported as mean and standard deviation (Mean ± SD), while categorical variables were expressed as n (%) in frequency and percentage. The Shapiro-Wilk test was used to assess the normality of quantitative variables. For normally distributed continuous variables, we performed parametric t-tests to compare differences between groups. For skewed continuous variables, nonparametric tests were used. The chi-square test was used to measure differences in categorical variables. All statistical analyses were carried out using R software (version 4.1.1).
3. Results
3.1. Description of the study population
The baseline demographic and clinical characteristics of the study participants are summarized in and Additional file 1. In the discovery phase, there were seven boys and nine girls in both the TLBW and TNBW groups. The gestational ages of the two groups were comparable (263.6 ± 4.2 days vs. 265.9 ± 3.9 days, p = 0.099). Although parity, mother's age at delivery, mother's height and weight before delivery, maternal pregnancy complications(such as pre-eclampsia and gestational diabetes mellitus), gestational weight gain, prenatal BMI and delivery mode did not show significant differences between the two groups (all p > 0.05), strong differences were found for birth weight (2287.2 ± 154.3 g vs 3026.9 ± 273.6 g), length (46.7 ± 1.1 cm vs 49.8 ± 0.9 cm) and head circumference (31.7 ± 1.2 cm vs 33.3 ± 0.9 cm).
Table 1. Clinical characteristics of the study subjects.
In the validation stage population, there were no significant differences in gender (p = 0.726) and gestational age (264.1 ± 6.1 days vs 265.5 ± 4.5 days, p = 0.071) between the two groups. Parity, maternal and paternal clinical characteristics were also matched. However, birth weight (2272.0 ± 170.8 g vs 3003.3 ± 264.3 g), body length and head circumference were also significantly lower in the TLBW group compared with the TNBW group.
4. 850k DNA methylation landscapes
After filtering and quality control, we obtained a final set of 812,215 sites that were suitable for subsequent analysis (A). The density plot of β values demonstrated a relatively similar overall DNAm distribution for all samples in both the TLBW group and healthy controls (B). PCA based on all CpG sites did not reveal any significant separation between the two groups (C).
By conducting a comprehensive comparison of genome-wide peripheral blood DNAm patterns between TLBW and TNBW, we identified 144 significant DMPs (Additional file 2). The mean difference in DNAm levels between the two groups ranged from -34.6% to 12%.
The Manhattan plot (Figure 3A) displays the distribution of the identified DMPs across different chromosomes. The points above the red dashed line represent the 144 DMPs that passed our screening threshold. These DMPs are predominantly found on chromosomes 1, 6, 2 and 10. Further annotation of the most significant 10 DMPs revealed seven genes. On chromosome 3, the most differentially methylated genes are KY, ATG7 and SH3BP5, while the other four genes are CEP164 on chromosome 11, CHSY1 on chromosome 15, GADD45G on chromosome 9 and PRKAR1B on chromosome 7. The volcano map (B) visually represents these DMPs, with red dots representing 111 hypomethylated sites and green dots representing 33 hypermethylated sites, while gray points represent metabolites that were detected but did not show significant differences. Notably, the 10 most prominent DMPs are cg19280785, cg26155439, cg24594555, cg12120750, cg09530217, cg26452434, cg00772932, cg23605961, cg14554423 and cg19282986.
Figure 3. Differentially methylated position analysis in peripheral blood DNA between TLBW and TNBW group. (A) Manhattan plot. Arrows indicate the genes where the top 10 most significant DMPs were located. (B) Volvano plot. Red spots reveal hypermethylated DMPs (N = 111) with △β≥ 0.05 and p-value < 0.001, green spots represent hypomethylated DMPs(N = 33) with △β≤ -0.05 and p-value < 0.001. (C) Distribution of DMPs according to CpG island contextual distribution. (D) Distribution of DMPs on functional genomic regions.
DMP: Differentially methylated position.
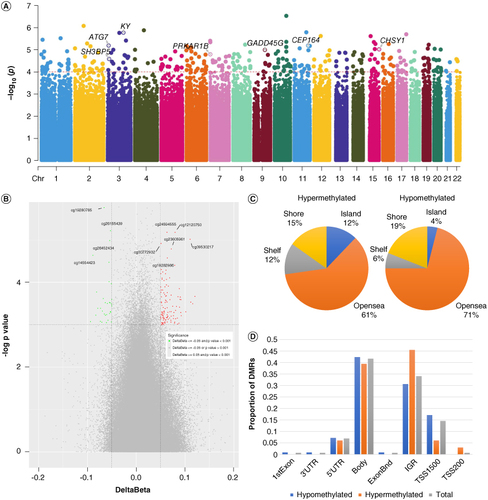
In terms of genomic context, the majority of the DMPs were located in the opensea (69%), followed by shore regions (18%) (C). Approximately 23% of the CpG sites were found in the promoter region (TSS200, TSS1500, 5’UTR and 1stExon), 42% in the gene body, and more than 35% in the 3’UTR and intergenic regions (IGR). When examining the distribution of statistically distinct hypomethylated and hypermethylated CpG sites, it was observed that hypermethylated positions were more concentrated in the intergenic regions (46%), while hypomethylated positions were more abundant in the gene body (42%) region, with a smaller proportion in TSS1500 (17%) (D). Overall, in the peripheral blood of TLBW neonates, differences in DNAm appear to be predominantly characterized by hypomethylation.
In addition to identifying DMPs, our study also revealed 149 DMRs, as shown in Additional file 3. These DMRs are associated with 147 genes. The top 10 significant DMRs, involving 11 genes, are presented in . It is noteworthy that 4 of these DMRs are located on chromosome 6.
4.1 Methylation validation
The congruence between the average methylation levels of the four differential DNA methylation sites, as gathered through the Illumina Infinium Human Methylation 850 k Bead Chip and Pyrosequencing, is evident from . The pyrosequencing outcomes for these four CpG sites are detailed in . At the cg23371584 site, the mean methylation rate for the TLBW and TNBW groups stood at 53.725% ± 10.770% and 58.443% ± 7.717%, respectively. The cg16955800 site exhibited methylation rates of 69.594% ± 5.236% and 66.812% ± 5.326% for the TLBW and TNBW groups, respectively. Moving to the cg24312537 site, methylation rates were observed at 32.010% ± 10.655% for TLBW and 36.046% ± 10.344% for TNBW. Finally, the cg27041096 site displayed methylation rates of 48.965% ± 3.941% for TLBW and 51.192% ± 4.534% for TNBW
Table 2. TOP 10 differentially methylated regions.
Table 3. The 4 CpGs mean methylation level(%) performed by DNA bisulfite pyrosequencing.
5. Enrichment analysis
The statistical difference in DMP-related gene enrichment pathways is not significant and results can be found in Additional file 5. A total of 73 genes associated with DMPs were annotated to 145 GO terms with statistically significant differences. These genes were classified into three major functional categories: 83 related to BP, 40 related to MF and 22 related to CC. The top ten entries in each of the three GO categories are shown in A. For cellular components, the genes were significantly enriched in the cell membrane and nuclear chromatin. In terms of molecular function, the genes were significantly enriched in transcriptional regulation and protein binding. The biological process analysis revealed significant enrichment in cytokine production and signaling pathway regulation, among other processes. A bubble plot (B) was used to visualize the top 30 enriched pathways analyzed by GO. The most significant enrichment category in BP was “GO:0032743 positive regulation of interleukin-2 production,” while the most significant pathway in MF was “GO:0000980 RNA polymerase II distal enhancer sequence-specific DNA binding.” In the CC category, the most significant enrichment was related to “GO:0005886 plasma membrane.”
Figure 4. The correlation between the methylation levels of 850 k array data and the validation data by pyrosequencing.
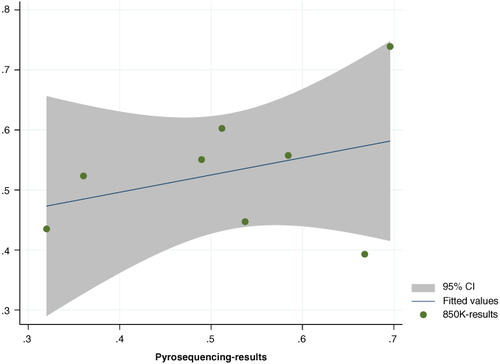
Figure 5. Functional annotation analysis of DMPs. (A) Gene ontology (GO) functional annotation. (B) The top 30 GO items pathway enrichment analysis bubble chart. the horizontal axis indicates pathway enrichment score, the vertical axis represents the pathway name and the dot size indicates the number of differential methylation-related genes involved in the pathway. (C) The top 30 enriched Kyoto Encyclopedia of Genes and Genomes (KEGG) pathway analysis. The dot size represents the number of enriched genes, and the dot color represents the p-value.
GO: Gene ontology.
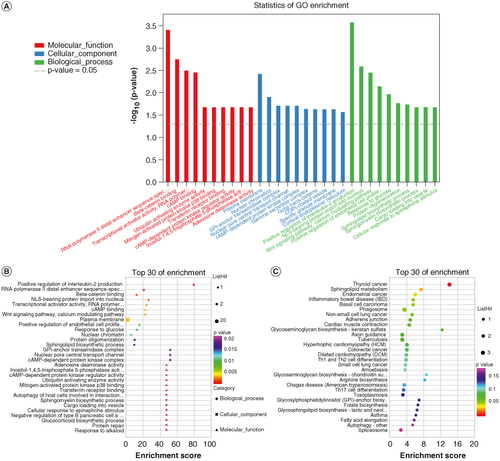
Additionally, 42 genes associated with DMPs were annotated to KEGG pathways. The top 30 significantly enriched KEGG pathways are shown in 5C. Among these pathways, the most important one was the ‘hsa00600 sphingolipid’. Additional file 6 depicts the hsa00600 pathway. Within this pathway, the genes associated with the differential methylation sites are GALC and SGMS1, with the corresponding methylation sites being cg17192520 and cg02638724, respectively. Remarkably, both sites exhibit hypomethylation.
6. Discussion
Epigenetic modifications have emerged as pivotal players in unraveling the intricate interplay between environmental factors and disease onset [Citation25]. It is widely recognized that genetic changes, particularly alterations in DNAm levels, can profoundly impact the expression of key genes by influencing the binding affinity of transcription factors to their target sites, thus contributing to the onset and progression of various diseases [Citation26,Citation27]. Our study presents a landmark investigation, marking the first-ever comprehensive comparison of genome-wide methylation patterns in the peripheral blood of TLBW and TNBW neonates. Notably, our sample selection was carefully balanced with regard to maternal factors that might influence DNAm, ensuring the robustness and reliability of our findings.
For the first time, we identified 144 DMPs and 149 DMRs in the peripheral blood of TLBW neonates. This novel revelation highlights the genes implicated in term low birth weight, notably KY, CEP164, ATG7, CHSY1, GADD45G, PRKAR1B and SH3BP5. These genes encompass a spectrum of cellular processes, ranging from autophagy and cell survival to immune response, potentially substantiating their profound involvement in the development of TLBW. ATG7, a pivotal autophagy effector enzyme, collaborates with other ATG proteins to regulate immunity, cell death, protein secretion and even the cell cycle and apoptosis pathways [Citation28,Citation29]. CEP164 is a key player in the signaling cascade activated by DNA damage [Citation30]. CHSY1 is secreted by the patient's fibroblasts and is required for the synthesis of the chondroitin sulfate moiety. In vitro, elimination of CHSY1 by RNAi knockdown resulted in enhanced osteogenesis of fetal osteoblasts [Citation31]. GADD45G‘s epigenetic silencing in tumors is well-established [Citation32,Citation33]. Evidence suggests that PRKAR1B p.R115K variant affects cAMP signaling and may favorably regulate the lipoprotein profile of African-American youth, protecting them from some adverse metabolic outcomes [Citation34]. The role of these genes in TLBW neonates has not been reported yet. The significant up-regulation or down-regulation of target genes at different methylation sites may eventually lead to the occurrence and development of TLBW, and further experimental verification is needed.
A striking observation was the predominance of hypomethylation, encompassing almost 77% of DMPs, suggesting that reduced DNA methylation levels constitute a hallmark feature of TLBW neonates. In general hypomethylation induces activation whereas hypermethylation induces repression [Citation35]. Global DNA hypomethylation is also a common epigenetic alteration in cancer [Citation36]. Besides that, we found that hypomethylation predominantly affected the gene body and promoter regions, indicating potential ramifications on gene expression modulation during early development.
The GO analysis unveiled that DMPs-related genes were significantly enriched in biological processes involving cytokine production and signaling pathway regulation, notably the positive regulation of IL-2 production. Given that adverse maternal outcomes like preterm birth and low birth weight often results from compromised placental function, such as placental inflammation [Citation37,Citation38], our results resonate with the perturbed methylation of genes governing immune and inflammatory responses in TLBW neonates. Furthermore, molecular functional analysis highlighted enrichment for transcriptional regulation and protein binding, which may contribute to dysregulated gene expression in TLBW neonates.
Our exploration of cellular components highlighted significant enrichment in the cell membrane, while the KEGG pathway analysis spotlighted the sphingolipid metabolism pathway as the most significantly enriched. Lipid mediators of inflammation, such as prostaglandins and leukotrienes, have been extensively investigated and characterized for their roles in immune responses. However, the focus has also extended to another critical class of lipids - sphingolipids. Sphingolipids, integral components of cell membranes and lipoproteins, have garnered significant attention due to their versatile functions. Accumulating evidence underscores the pivotal role of sphingolipids as mediators in the intricate orchestration of apoptosis, cellular stress responses and inflammation regulation [Citation39,Citation40]. Dysregulation of sphingolipid metabolism has been found to be associated with various psychiatric and neurological diseases as well as cognitive impairment [Citation41,Citation42]. The altered metabolism of sphingolipids, marked by augmented synthesis of sphingosine-1-phosphate (S1P), has been associated with the development of the asthmatic phenotype in house dust mite allergy [Citation43]. We also found that both the cell membrane pathway and the sphingolipid metabolism pathway feature the gene SGMS1. The product encoded by SGMS1 serves as the primary sphingomyelin synthase located on the Golgi apparatus, catalyzing the reversible transfer of phosphatidylcholine head groups from phosphatidylcholine to ceramide in sphingomyelin biosynthesis. Our findings accentuate the intriguing possibility of sphingolipid metabolism's involvement in the intricate mechanism underpinning TLBW. In our subsequent studies, we analyzed changes in lipid levels in TLBW, and excitingly, we found that sphingomyelin, Hex3Cer, Hex2Cer and CerAS all showed specific upregulation. These results have not yet been published, and further experimental design is needed to validate them.
While our study offers significant insights into the intricate molecular mechanisms driving the epigenetic regulation of TLBW, it is crucial to acknowledge certain limitations inherent to our research. Foremost among these is that the size of our cohort has increased compared with the single-digit size in the past, and it has been carefully balanced in terms of maternal factors, but because it is a single-center study, it may affect the generalizability of our findings. Furthermore, the cross-sectional design of our study, while valuable in capturing the epigenetic landscape at birth, presents a challenge in establishing a definitive causal relationship between differential DNAm and TLBW.
7. Conclusion
In summary, this study offers a comprehensive exploration of the DNAm landscape in TLBW neonates. Marking a significant milestone, we have identified 144 DMPs between the TLBW and TNBW groups using the human methylation 850k beadchip. Among these differential methylation sites, several have associations with genes involved in crucial processes such as immune response, transcriptional regulation and sphingolipid metabolism. These findings underscore the potential pivotal role of DNAm in the intricate pathogenesis of TLBW. Future investigations are poised to combine diverse omics disciplines, including genomics, metabolomics and proteomics, to provide a more comprehensive perspective on TLBW's epigenetic mechanisms.
Author contributions
Conception and design: J Liu, Q Zhang; administrative support: Q Zhang; provision of study materials or patients: Q Sun, D Liu, HX Liang, F Ye; collection and assembly of data: D Liu, YM Chen; data analysis and interpretation: J Liu, Q Sun; manuscript writing: J Liu, Q Zhang. All authors read and approved the final manuscript.
Financial disclosure
This work was funded by National High Level Hospital Clinical Research Funding (2022-NHLHCRF-LX-01-0301), and the Clinical research project of Beijing research ward construction (2022-YJXBF-04-01-03). The authors have no other relevant affiliations or financial involvement with any organization or entity with a financial interest in or financial conflict with the subject matter or materials discussed in the manuscript apart from those disclosed.
Writing disclosure
No writing assistance was utilized in the production of this manuscript.
Ethical conduct of research
This study was approved by the China-Japan Friendship Hospital ethics committee board (number: 2023-KY-057). All methods were carried out in accordance with relevant guidelines and regulations. Parental informed consent was obtained in writing from each participant.
iepi_a_2358744_sm0339.pdf
Download PDF (92.8 KB)iepi_a_2358744_sm0346.pdf
Download PDF (28.8 KB)iepi_a_2358744_sm0344.pdf
Download PDF (464.9 KB)iepi_a_2358744_sm0341.pdf
Download PDF (258.1 KB)iepi_a_2358744_sm0338.pdf
Download PDF (270.5 KB)iepi_a_2358744_sm0342.pdf
Download PDF (513.3 KB)Competing interests disclosure
The authors have no competing interests or relevant affiliations with any organization or entity with the subject matter or materials discussed in the manuscript. This includes employment, consultancies, honoraria, stock ownership or options, expert testimony, grants or patents received or pending, or royalties.
Data availability statement
The datasets used and/or analyzed during the current study are available from the corresponding author on reasonable request.
Additional information
Funding
References
- UNICEF-WHO low birthweight database. July 2023. https://www.who.int/teams/nutrition-and-food-safety/monitoring-nutritional-status-and-food-safety-and-events/joint-low-birthweight-estimates.
- Estimates of burden and consequences of infants born small for gestational age in low and middle income countries with INTERGROWTH-21st standard: analysis of CHERG datasets. BMJ. 2017;358:j4229. doi:10.1136/bmj.j4229
- Coats LE, Davis GK, Newsome AD, et al. Low birth weight, blood pressure and renal susceptibility. Curr Hypertens Rep. 2019;21(8):62. doi:10.1007/s11906-019-0969-0
- Hovi P, Vohr B, Ment LR, et al. Blood pressure in young adults born at very low birth weight: Adults Born Preterm International Collaboration. Hypertension. 2016;68(4):880–887. doi:10.1161/HYPERTENSIONAHA.116.08167
- Luyckx VA, Bertram JF, Brenner BM, et al. Effect of fetal and child health on kidney development and long-term risk of hypertension and kidney disease. Lancet. 2013;382(9888):273–283. doi:10.1016/S0140-6736(13)60311-6
- Valero De Bernabe J, Soriano T, Albaladejo R, et al. Risk factors for low birth weight: a review. Eur J Obstet Gynecol Reprod Biol. 2004;116(1):3–15. doi:10.1016/j.ejogrb.2004.03.007
- Juliusdottir T, Steinthorsdottir V, Stefansdottir L, et al. Distinction between the effects of parental and fetal genomes on fetal growth. Nat Genet. 2021;53(8):1135–1142. doi:10.1038/s41588-021-00896-x
- Beaumont RN, Warrington NM, Cavadino A, et al. Genome-wide association study of offspring birth weight in 86 577 women identifies five novel loci and highlights maternal genetic effects that are independent of fetal genetics. Hum Mol Genet. 2018;27(4):742–756. doi:10.1093/hmg/ddx429
- Freathy RM, Weedon MN, Bennett A, et al. Type 2 diabetes TCF7L2 risk genotypes alter birth weight: a study of 24,053 individuals. Am J Hum Genet. 2007;80(6):1150–1161. doi:10.1086/518517
- Apostolidou S, Abu-Amero S, O'Donoghue K, et al. Elevated placental expression of the imprinted PHLDA2 gene is associated with low birth weight. J Mol Med (Berl). 2007;85(4):379–387. doi:10.1007/s00109-006-0131-8
- Wu H, Zhu P, Geng X, et al. Genetic polymorphism of MTHFR C677T with preterm birth and low birth weight susceptibility: a meta-analysis. Arch Gynecol Obstet. 2017;295(5):1105–1118. doi:10.1007/s00404-017-4322-z
- Cavalli G, Heard E. Advances in epigenetics link genetics to the environment and disease. Nature. 2019;571(7766):489–499. doi:10.1038/s41586-019-1411-0
- Jaenisch R, Bird A. Epigenetic regulation of gene expression: how the genome integrates intrinsic and environmental signals. Nat Genet. 2003;33(Suppl.):245–254. doi:10.1038/ng1089
- Dolinoy DC, Weidman JR, Jirtle RL. Epigenetic gene regulation: linking early developmental environment to adult disease. Reprod Toxicol. 2007;23(3):297–307. doi:10.1016/j.reprotox.2006.08.012
- Law PP, Holland ML. DNA methylation at the crossroads of gene and environment interactions. Essays Biochem. 2019;63(6):717–726. doi:10.1042/EBC20190031
- Reik W. Stability and flexibility of epigenetic gene regulation in mammalian development. Nature. 2007;447(7143):425–432. doi:10.1038/nature05918
- Hayashi I, Yamaguchi K, Sumitomo M, et al. Full-term low birth weight infants have differentially hypermethylated DNA related to immune system and organ growth: a comparison with full-term normal birth weight infants. BMC Res Notes. 2020;13(1):199. doi:10.1186/s13104-020-04961-2
- Mao LL, Xiao XH, Zhang Q, et al. DNA methylation and birth weight: a genome-wide analysis. Biomed Environ Sci. 2017;30(9):667–670. doi:10.3967/bes2017.088
- Tekola-Ayele F, Zeng X, Ouidir M, et al. DNA methylation loci in placenta associated with birthweight and expression of genes relevant for early development and adult diseases. Clin Epigenetics. 2020;12(1):78. doi:10.1186/s13148-020-00873-x
- Tian FY, Wang XM, Xie C, et al. Placental surface area mediates the association between FGFR2 methylation in placenta and full-term low birth weight in girls. Clin Epigenetics. 2018;10:39. doi:10.1186/s13148-018-0472-5
- Tian FY, Hivert MF, Wen X, et al. Tissue differences in DNA methylation changes at AHRR in full term low birth weight in maternal blood, placenta and cord blood in Chinese. Placenta. 2017;52:49–57. doi:10.1016/j.placenta.2017.02.017
- Ju C, Fiori LM, Belzeaux R, et al. Integrated genome-wide methylation and expression analyses reveal functional predictors of response to antidepressants. Transl Psychiatry. 2019;9(1):254. doi:10.1038/s41398-019-0589-0
- Wang T, Li P, Qi Q, et al. A multiplex blood-based assay targeting DNA methylation in PBMCs enables early detection of breast cancer. Nat Commun. 2023;14(1):4724. doi:10.1038/s41467-023-40389-5
- Zhu H, Wu LF, Mo XB, et al. Rheumatoid arthritis-associated DNA methylation sites in peripheral blood mononuclear cells. Ann Rheum Dis. 2019;78(1):36–42. doi:10.1136/annrheumdis-2018-213970
- Bagot RC, Meaney MJ. Epigenetics and the biological basis of gene x environment interactions. J Am Acad Child Adolesc Psych. 2010;49(8):752–771. doi:10.1016/j.jaac.2010.06.001
- Zuo Z, Roy B, Chang YK, et al. Measuring quantitative effects of methylation on transcription factor-DNA binding affinity. Sci Adv. 2017;3(11):eaao1799. doi:10.1126/sciadv.aao1799
- Banerjee S, Wei X, Xie H. Recursive motif analyses identify brain epigenetic transcription regulatory modules. Comput Struct Biotechnol J. 2019;17:507–515. doi:10.1016/j.csbj.2019.04.003
- Collier JJ, Suomi F, Olahova M, et al. Emerging roles of ATG7 in human health and disease. EMBO Mol Med. 2021;13(12):e14824. doi:10.15252/emmm.202114824
- Zhou H, Qian X, Xu N, et al. Disruption of Atg7-dependent autophagy causes electromotility disturbances, outer hair cell loss, and deafness in mice. Cell Death Dis. 2020;11(10):913. doi:10.1038/s41419-020-03110-8
- Sivasubramaniam S, Sun X, Pan YR, et al. Cep164 is a mediator protein required for the maintenance of genomic stability through modulation of MDC1, RPA, and CHK1. Genes Dev. 2008;22(5):587–600. doi:10.1101/gad.1627708
- Tian J, Ling L, Shboul M, et al. Loss of CHSY1, a secreted FRINGE enzyme, causes syndromic brachydactyly in humans via increased NOTCH signaling. Am J Hum Genet. 2010;87(6):768–778. doi:10.1016/j.ajhg.2010.11.005
- Li F, Wang M, Li X, et al. Inflammatory-miR-301a circuitry drives mTOR and Stat3-dependent PSC activation in chronic pancreatitis and PanIN. Mol Ther Nucleic Acids. 2022;27:970–982. doi:10.1016/j.omtn.2022.01.011
- Ju S, Zhu Y, Liu L, et al. Gadd45b and Gadd45g are important for anti-tumor immune responses. Eur J Immunol. 2009;39(11):3010–3018. doi:10.1002/eji.200839154
- Bloyd M, Settas N, Faucz FR, et al. The PRKAR1B p.R115K variant is associated with lipoprotein profile in African American youth with metabolic challenges. J Endocr Soc. 2021;5(8):bvab071. doi:10.1210/jendso/bvab071
- Deaton AM, Bird A. CpG islands and the regulation of transcription. Genes Dev. 2011;25(10):1010–1022. doi:10.1101/gad.2037511
- Jia Y, Li P, Fang L, et al. Negative regulation of DNMT3A de novo DNA methylation by frequently overexpressed UHRF family proteins as a mechanism for widespread DNA hypomethylation in cancer. Cell Discov. 2016;2:16007. doi:10.1038/celldisc.2016.7
- Kingdom JC, Audette MC, Hobson SR, et al. A placenta clinic approach to the diagnosis and management of fetal growth restriction. Am J Obstet Gynecol. 2018;218(2S):S803–S817. doi:10.1016/j.ajog.2017.11.575
- Fowden AL, Ward JW, Wooding FP, et al. Programming placental nutrient transport capacity. J Physiol. 2006;572(Pt 1):5–15. doi:10.1113/jphysiol.2005.104141
- Deigner HP GE, Claus RA. Sphingolipid metabolism in systemic inflammation. Intensive Care Med. 2007;2007:249–266. doi:10.1007/978-0-387-49518-7_23
- Hannun YA, Obeid LM. Sphingolipids and their metabolism in physiology and disease. Nat Rev Mol Cell Biol. 2018;19(3):175–191. doi:10.1038/nrm.2017.107
- Kalinichenko LS, Gulbins E, Kornhuber J, et al. Sphingolipid control of cognitive functions in health and disease. Prog Lipid Res. 2022;86:101162. doi:10.1016/j.plipres.2022.101162
- Henriquez-Henriquez M, Acosta MT, Martinez AF, et al. Mutations in sphingolipid metabolism genes are associated with ADHD. Transl Psychiatry. 2020;10(1):231. doi:10.1038/s41398-020-00881-8
- Kowal K, Zebrowska E, Chabowski A. Altered sphingolipid metabolism is associated with asthma phenotype in house dust mite-allergic patients. Allergy Asthma Immunol Res. 2019;11(3):330–342. doi:10.4168/aair.2019.11.3.330