
ABSTRACT
This contribution takes a critical perspective on digital school performance platforms (SPP), which today play a key role in US state education monitoring and accountability. Using examples from two different US state education agencies, I provide an analytical disentanglement of some key dimensions of such platforms’ enactment and materiality. I do so using a topological lens, which in recent years has increasingly been adopted in education policy research as a useful tool for capturing complex and simultaneously generative manifestations of the digital. In the case of platforms, such a topological lens focuses on the power of relation-making and, consequently, on the fabrication and stabilization of particular data representations of education through relational (platform) settings, while simultaneously embracing the ongoing enactment and dynamism of these settings through various data practices. As an empirical example of this ambiguity, this contribution discusses the complex, highly dynamic relational production of US school performance platforms as reported by state education agency experts, as well as the invisibilization of these very production processes when observing the seemingly neutral, compressed, simplified and ready-to-use platforms themselves. Consequently, despite their customized and interactive nature, such platforms powerfully (re)shape what is publicly perceived and can be acted upon as ‘good’ schooling.
1. Introduction
In recent decades, there has been a growing body of scholarly work which critically engages with the rising power of algorithms and digital data in public policy and governance (for a recent overview see Bucher, Citation2018, pp. 29–32; Smith, Citation2018). While explicitly challenging the idea of data or algorithms as being neutral or simply technical, such work, which has inter alia become summarized as ‘critical data studies’ (Kitchin & Lauriault, Citation2014, p. 1; Iliadis & Russo, Citation2016), has broadly documented the regulative power, the politics, but also the social embedment – which is to say the relational, ontogenetic nature (Kitchin, Citation2017) – of data infrastructures or data-based governing tools.
Digital platforms or data dashboards provide common examples of such data tools, which are deeply affecting various fields of governance, including the field of education (see, for example, Hartong, Citation2016; Landri, Citation2018; Romito et al., Citation2019; Williamson, Citation2017). These tools commonly bring together, compress, order, visualize and, thus, claim to make data, which would otherwise be too complex to handle, ready-to-use for (fast) decision-making. As critical data studies highlights, however, how such platforms become practically enacted and are supported by particular infrastructures has remained widely invisible for most education researchers (Hartong & Förschler, Citation2019; see also Robertson, Citation2019). Consequently, a pressing need has been articulated to develop proper theoretical and methodological approaches as well as empirically rich(er) descriptions of the nature of digital platforms, how they are being produced and governmentally enacted, as well as the effects they produce (Bucher, Citation2018; Kitchin & Lauriault, Citation2014).
With this paper, I seek to contribute to this need by disentangling at least some key dimensions of the enactment and materiality of digital school performance platforms (SPP) commonly used by US state education agencies as part of their State Longitudinal Data Systems (SLDS) to monitor education. In doing so, I complement others who have studied SPP such as MySchool in Australia (Gorur, Citation2013; Souto-Otero & Beneito-Montagut, Citation2016), Scuola in Chiaro in Italy (Landri, Citation2018), or the National Pupil Database as well as Ofsted data dashboards in the UK (Williamson, Citation2015), all of whom provided important insights into such platforms’ materiality and operationality, particularly regarding their power to (re)shape what is seen and valued by schools as well as how schools are represented and related in terms of ‘mediated transparency’ (Landri, Citation2018, p. 13; see also West, Citation2017). This seems all the more important given that the evaluative quality of such platforms (Robertson, Citation2019) increasingly guides not only parental school choice but also state administration in holding schools accountable to particular data targets (including consequences such as taking over underperforming schools, distributing resources among schools, etc.).
I seek to contribute to address this stream of research, employing what in education policy (and also some initial platform) research has increasingly been discussed as a topological lens (Decuypere & Simons, Citation2016; Martin & Secor, Citation2014; van de Oudeweetering & Decuypere, Citation2019; Hartong, Citation2018; Hartong & Piattoeva, Citation2019) (see section 2). In the case of platforms, such a topological lens focuses on the fabrication and stabilization of particular relational settings as powerful governmental framings of (good) education, while simultaneously embracing the ongoing enactment and dynamism of these settings through various data practices.
To illuminate this simultaneity (see section 3), this contribution first sheds light on the production of SPP in two US state agencies (Massachusetts and Georgia), which not only reveal highly complex and ambiguous data practices but also point to state agencies’ awareness of the power of data and data relations. As a result, state agencies report growing attempts to foster a more context-sensitive and careful modeling and understanding of data (relations), including utilizing a greater diversity of platform data, as well as more customized and interactive platform designs. Such initiatives are intended to empower platform users to work critically and more openly with school data, and use platforms as an instrumental tool to support this work. The topological lens, however, makes visible how platforms, even though interactive and diverse, always set and operate within particular (yet dynamic) boundaries, which not only invisibilize the ambiguous production logics behind data platforms but also powerfully (re)shape what is publicly perceived and, thus, can be acted upon as ‘good’ schooling. As will be discussed in the concluding section of this paper (section 4), a topological lens may thus help to develop an important critical perspective on the still often underestimated governing power of platforms in education, as well as on the ongoing transformation of school practice in times of rising datafication.
2. Critical approaches to digital platforms
Despite a growing scholarly interest in the materiality, operationality and performativity of digital platforms, a coherent conceptual and methodological framework for critical platform analysis has, with the exception of some initial proposals (e.g. from Kitchin’s working group on urban dashboards, see Kitchin, Citation2017) not been systematically developed, particularly in the field of education (but see Oudeweetering & Decuypere, Citation2019; Decuypere & Simons, Citation2016).
Nonetheless, in recent years, a growing body of scholars has identified and critically engaged with crucial components of digital platforms, asking how the world is algorithmically modelled, ordered, arranged (Bucher, Citation2018, p. 3–4, see also Gorur et al., Citation2019, p. 4) and, consequently, disciplined (Thompson & Cook, Citation2015, p. 741), thus setting the stage for further conceptual and methodological elaboration. As Gillespie (Citation2010, pp. 350–352) reminds us, while the very idea of platforms as open, egalitarian, and neutral in the sense of providing ‘visualized facts’ (Kitchin et al., Citation2015, pp. 16–20) is used to legitimate arguments based on their content, platforms, in fact, define and restrict how users get to know, in the case of education, schools and, consequently, the forms and parameters of potential governmental intervention (see also Hartong & Förschler, Citation2019; West, Citation2017). Such ‘algorithmic activation of relational impulses’ (Bucher, Citation2018, p. 5) hints to the fact that each concept made actionable through platforms (in the case under study this includes high/low performing schools, school climate or students/schools at risk, to name just a few), while being presented as an objective numerical measure, is the result of multiple moments of selection, ordering and weighting.
Such moments also include strategic visualization (see also Scheel et al., Citation2019) and, thus, the (pre)configuration of users in the mediation of platforms’ analytical reasoning. Drucker (Citation2010) conceptualized this entry point to a critical perspective on digital technologies as graphesis, pointing in particular to the graphical forms of data ‘staging’ (see also Williamson, Citation2015). Ratner and Ruppert (Citation2019) refer to this staging of data as ‘aesthetic practices’, involving the preparation of data such that they can be disseminated via governmental portals, including processes such as data cleaning and the production of metadata. At the same time, each visual strategy, which also includes particular ways of coloring (e.g. traffic light systems), thus inscribes a certain type of readability and meaningfulness for different audiences, shaping how users will (most likely) interpret the data. In other words, digital platforms always provide ‘[…] a concrete suggestion for a communicative [or governmental] action to be performed’ (Bucher, Citation2018, p. 6, see also Romito et al., Citation2019). As I will show in the following parts of this contribution, in the case of SPP, such anticipated uses (or ‘appropriate actions’, as Mattern (Citation2015) puts it) include, among others, school profiling, student grouping, and (school choice related) risk estimation.
3. The topological lens
Over recent years, the topological lens has been increasingly applied in the field of education research (see, e.g. Decuypere & Simons, Citation2016; Gulson et al., Citation2017; Martin & Secor, Citation2014; Hartong, Citation2018; Hartong & Piattoeva, Citation2019), complementing critical research on the politics of data (and data platforms) as mediated through in-formation, visualization and user prefiguration. The topological lens takes an important step further than past approaches by understanding datafication and data practices not as (selectively) representing particular things, but instead as relationally bringing these very things into being (van de Oudeweetering & Decuypere, Citation2019, p. 3) including education, schools and teachers, as well as spaces and times of governance. Such an approach clearly reflects recent debates in policy mobility research (spatial turn), which have not only pointed to various kinds of (also non-territorially bound) relationality as ongoing space-making through which policy mobility operates but also to the rising impact of data relations on these spaces and operations (e.g. Hartong & Piattoeva, Citation2019; Savage, Citation2019; Takayama et al., Citation2016). As an example, in the field of migration management, Scheel et al. (Citation2019, p. 582) show how migration statistics ‘[…] help to bring into being and perform the very migration-related realities they apparently only describe’, so de facto naming groups into existence, including groups who seemingly need special governmental intervention (see also Grommé & Scheel, Citation2019).
Consequently, employing such a perspective on digital education platforms would mean focusing not only on the mediation (e.g. what platforms describe/make visible about schooling) but on the actual enactment of particular topologies as ‘[…] set[s] of practices that produce space-times’ (van de Oudeweetering & Decuypere, Citation2019, p. 3). In other words, a central task of topologically oriented research lies in empirically describing practices in order to understand how a particular relational setting is being enacted and, thus, what can and cannot happen within this setting (Decuypere & Simons, Citation2016, p. 5). Put differently, the focus is placed on the generative and simultaneously ‘onto-political’ (Scheel et al., Citation2019, p. 581) moments of data practices, which always include norms and values about (good) schooling or (good) platform users (see also van de Oudeweetering & Decuypere, Citation2019, p. 5).
At the same time, observing such relational settings as topologies neither ends with their (original) production process nor with their stabilized character. Instead, topological thinking puts equal emphasis on the question of how continuous change (with is clearly visible in the dynamics of platformization) and enduring relations as practices can be thought of together (Martin & Secor, Citation2014, p. 422). Consequently, when researching platforms through a topological lens, it seems important to trace both the stabilization of platforms as relational settings and the highly dynamic and ambivalent or contested practices of platform (re)production and usage, which may also include significant elements of ‘messing around’ or ‘trial and error’ as well as the contestation of ethical, political and technical logics (see also Gray et al., Citation2018; Kitchin et al., Citation2015, p. 16; Williamson, Citation2015; Hartong & Förschler, Citation2019). As topological thinking suggests, the interesting question then is which relations remain or what stays ‘typical’ even though changes occur (Decuypere & Simons, Citation2016), including, for example, the various ‘paths’ a user may take on a (customized or interactive) platform.Footnote1
4. Methodological considerations: observing school performance platforms through two entry points
Building on these conceptual considerations, the topological lens also implies a particular methodological approach when trying to grasp how spaces, times and settings of governance are brought into being and what relational effects they produce. As a result, there has been a recent call for more inventive methods (for an overview see Gulson et al., Citation2017), which actively investigate the what and how of relationality using (combinations of) different entry points, such as interviews with platform producers and users as well as ‘active navigations’ of the platforms under study (see, for example, Decuypere, Citation2019; Landri, Citation2018; van der Oudeweetering & Decuypere, Citation2019).
The investigations presented in this contribution focus on SPP commonly used in US state education agencies as part of their State Longitudinal Data Systems (SLDS) to monitor and govern public schools through data. The analysis belongs to a larger project, which has been running since 2017 and seeks to improve the general understanding of digital-era governance and the role of data management in education within the policy contexts of Germany and the US. The project included extensive research on policy material, actors and institutions that have been framing (the ongoing transformation of) school monitoring in both countries. In addition, a more detailed exploration of school monitoring infrastructures and their modes of operation within four selected state education agencies (Massachusetts and Georgia in the US as well as two German states) was conducted, including more than 30 interviews with state agency data experts as well as analyses of diverse monitoring tools used in these selected agencies (for an overview see Hartong & Förschler, Citation2019). This material, which focuses on the production phase of monitoring, also includes the design and practical enactment of SPP – namely the Profiles platform in Massachusetts and the CCRPIFootnote2 platform in Georgia. Employing a topological lens, this production component can thus serve as the first of two entry points to studying the what and how of relationality, focusing in particular on the processes behind platforms (see also van der Oudeweetering and Decuypere, Citation2019). The second, complementary entry point is a step-by-step observation and documentation of both platforms, specifically their main platform screens, navigation path arrangements and features (based on series of screenshots and notes as well as Demo systems, where available), thus reconstructing what is on the platform and how it can(not) be used (Dieter et al., Citation2018, p. 5; van der Oudeweetering; Decuypere, Citation2019). This approach follows others who have similarly analyzed platforms by positioning themselves ‘[…] as potential users in order to observe the scripts available, how users are addressed, how information is provided, the type of actions the software makes affordable, and the ways in which subjectivities are constructed through interaction with the digital device’ (Romito et al., Citation2019, p. 5). As I will show in the next section, while both entry points reveal important facets of how platforms become enacted and operate – including noteworthy similarities and differences between the two states – they also point to a significant discrepancy between what can be observed behind and on the platforms.
5. Behind the platforms: insights into the production of school performance platforms in Massachusetts and Georgia
Building on interviews with state agency data expertsFootnote3 as well as content analysis of documentation available online about the platforms’ production, the purpose of this section is to provide insights into the behind contexts of Profiles and CCRPI. As in most other US states, Massachusetts and Georgia combine: (1) a platform system or data portal with restricted access for district authorities, school principals, teachers and parents, which includes very detailed and also individual, non-anonymized data; and (2) a publicly available online platform system (the focus of this contribution), which is limited to aggregated school- (, district- and state-) level data. In both states, the public platforms are further complemented by (3) federally demanded ‘school and district report cards’ as well as numerous excel, pdf and PowerPoint data reports available on the state agencies’ webpages.
In general, most agency experts were well aware of and in fact critically discussed the complexities and challenges of fabricating and (publicly) reporting ‘good’ representations of schooling through data, also revealing a strong awareness of the power of data and data relations. In other words, the interviewees pointed to multiple interdependencies, different logics and, consequently, very challenging decision-making processes when doing data selection, in-formation and relation, often the result of ongoing changes to the data system (revising or developing new data tools, models and ways of reporting and accountability due to new regulations, etc.) (see also Hartong & Förschler, Citation2019).
Despite this awareness and the ongoing dynamic of the data systems, the interviews still revealed numerous moments where relations do become enacted and stabilized, thus powerfully framing the configuration of the platforms. One example is the selection and definition of (meta)data which can flow from student or school information systems into the agencies’ databases, and later on into the platforms, and thus must conform to particular rules and formats (see also Drucker, Citation2010, p. 7). These moments of definition appear all the more important given that state agencies invest heavily in reducing data duplication and data alternatives for measuring the same phenomenon, including the use of data standards (i.e. what format particular data can have, whether it is measured using specific numbers or letters), data business rules (i.e. defining the terminological framework of data collection) and interoperability frameworks (i.e. standardizing the technical interfaces of data collection).
Simultaneously, over the past two decades, there has been a significant expansion of both federal regulations and data-promotion activities from non-governmental actors (see Hartong, Citation2019), which have also deeply affected which data (formats) states are required (or at least motivated) to collect and focus on, for example, when presenting data on SPP. In particular, interviewees cited numerous regulations included in the federal Every Student Succeeds Act (ESSA), signed into law in 2015, which requires states that receive federal funding to inter alia provide at least one measure of non-cognitive learning, such as school climate, chronic absenteeism or student discipline.Footnote4 Simultaneously, ESSA prescribes that state agencies still give test achievement, particularly performance progress, ‘[…] much greater weight than any measures of school quality or student success’.Footnote5 This also includes obligations to monitor (and report on) certain demographic subgroups more extensively than others, e.g. students with disabilities or students with English as a second language. Here we clearly see what Grommé and Scheel (Citation2019) described as the power of naming groups into existence through data sorting and hierarchization, including an already relational pre-structuration of how these groups must be made prominently visible on platforms as potential risk factors for school performance (see also section 6).
Yet, while ESSA has significantly influenced state monitoring systems, and particularly performance platforms as the main reporting instrument, these federal regulations are still, at least partly, differently re-contextualized at the state level, leading to different forms of relation-making and platform framing. As an example, while Georgia has implemented an annual school climate survey and processes the outcome data into a school climate star rating reported on the CCRPI platform (and also linked to student discipline data), this rating is visualized separately and is deliberately not included in the accountability model (see also section 6). One interviewee commented on the tension caused by this new measure still being in the stage of ‘becoming’ while simultaneously producing potential student labeling risks – the very reason why student discipline data is not yet included in Georgia’s SLDS at all. In Massachusetts, the state education agency is piloting a school climate survey but has not gone much further, in this case due to considerable concerns that schools could manipulate survey data as soon as it becomes linked to high stakes accountability. In other words (and this not only refers to ESSA modifications), state agencies report various attempts to produce – and ongoing concerns regarding – careful, context-sensitive modeling and understanding of data (relations). This is also visible in decisions regarding data analysis, particularly the calculation of accountability classifications, which, seen through a topological lens, create what is probably the most powerful space of performance comparison since it relates schools in ways that lead directly to particular state interventions. Consequently, most state agency experts were well aware of the meaning of underlying values about ‘good schooling’ (e.g. ideas of numerical targets that schools in a particular group are expected to meet) inscribed in particular kinds of indicators (see also Kitchin et al., Citation2015, pp. 8–9). They were also aware of the significance of grouping comparable schools as relational subsettings, the use of weighting procedures and the selection of particular forms of calculation (e.g. regression analysis). As one state actor in Massachusetts reported:
‘[…] [W]e’ve done some pretty deep philosophical discussions when we are debating what indicators to include, how much improvement we should expect to see and it’s an interesting balance of this technical side and then this normative side. Because in the end, you’ve got to say, did this school make it or not?’
Other interviewees similarly argued that the selection of indicators and relative weighting were shown to each have a profound effect on the resulting numbers (see also Kitchin et al., Citation2015, p. 22), thus regularly provoking intense discussions and resistance from different stakeholders such as district superintendents, principals and teachers. Consequently, it is this area of monitoring which has been under more or less ongoing redesign in both state agencies, as they constantly seek to increase the accuracy as well as the ‘fairness’ of publicly visible representations of individual school performance.
In fact, it is these processes of ongoing redesign, ranging from minor adaptations of indicators to major revisions of the accountability model or reporting formats, which are also of particular interest when asking how the stability and dynamism of relational settings interact. As an example, in Massachusetts, a major redesign of the accountability model was completed in 2018, which included large parts of the calculation (e.g. placing more emphasis on progress that on absolute test outcomes), but also the visualization of school performance on Profiles. Instead of placing schools in a vertical hierarchy from levels 1–5, the new category labels are tied to the level of assistance or intervention required, which is ‘horizontally reported’ (see ). These assistance or intervention levels are no longer purely bound to absolute performance metrics that schools are supposed to meet, but instead more emphasis is placed on relative growth targets set by the state agency:
‘In 2018, targets will be set only for one year, using 2017 data as the baseline. DESE [the Massachusetts state agency] will set conservative, yet reasonable achievement targets for 2018. By grouping schools together based on historical school percentile ranges (e.g.,schools with 2015 school percentiles 1-25) and looking at changes made by only those schools in the group that demonstrated improvement, DESE will use a statistical approach to apply the same expectation of improvement on the new test scale to all schools within the group. […] Based on each target and actual performance, DESE will assign points for each indicator [, ranging from 0 = declined to 4 = exceeded target]. For the district or school as a whole, the actual points earned and the total possible points will be reported for each indicator. The points earned will be combined, weighted […], and calculated into a percentage of possible points for the all students group. The same will be done for the lowest performing students group. The two percentages of possible points values will then be averaged, resulting in the district’s or school’s overall criterion-referenced target percentage.’ (www.doe.mass.edu/accountability/accountability-summary.docx, p. 6)
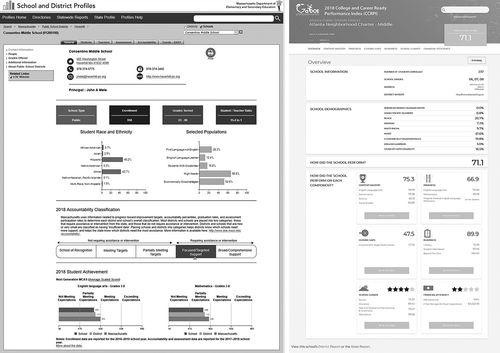
Figure 1. The Profiles Page for Consentino Middle School as well as the CCRPI page for the Atlanta Neighborhood Charter Middle School
In that regard, interesting similarities and differences can be found between Massachusetts and Georgia. While Georgia has also included relative growth as a significant indicator within its current accountability model, it instead uses a statistical measurement which groups students across schools as ‘academic peers’ according to their most recent assessment results, before their relative performance de-/increase is then individually monitored and calculated into the accountability model.Footnote6 In addition, Georgia reports the overall performance of schools as a summarized percentile measure (ranging from 0 to 100) instead of grouping schools by the level of assistance. In other words, as with the school climate indicator, relative growth in the sense of fairer comparison is again differently contextualized.
As this example of a major revision of the accountability (and platform) design in Massachusetts shows, there has been a significant, yet incomplete change in the relational setting, including modes of sorting, school classification and setting of performance expectations, which may lead to very different (reported) school performance results. All these changes indicate what the topological lens describes as ongoing practices of space (re)fabrication. While these revisions did not actually change the platform as a whole, they still appear as a significant transformation of particular sheets, tables and graphs, including the change from a vertical to a horizontal performance visualization.
This component of strategic visualization is then closely related to the idea of who should use the data and how. Here the interviews showed that a strategic design of graphical data expressions has become increasingly important for state agencies that seek to compress and communicate as much data as possible to various audiences, but simultaneously fear the dangerous pitfalls of visual misinterpretation from data non-experts – particularly when (unintended) causations could be assumed. Consequently, the interviewees again reported varying difficulties, even discrepancies, related to the problematic balance between visual data simplification and accuracy, which is to say the level of complexity of graphical expressions, or how to present data in a user-friendly way while addressing completely different user groups (Hartong & Förschler, Citation2019, pp. 5–6). Hence, both agencies have increasingly invested in dashboard user training and support, while also aspiring to the further development of customizable, interactive and flexible data instruments that offer various user-related options for visual adaptation. In other words, both agencies seek to empower platform users to more critically and more openly work with school data, and to use platforms as an instrumental tool to support this work.Footnote7 At the same time, the majority of interviewees made the clear point that the ‘datafied’ representation they produce in any case cannot and should not replace local knowledge, which is deemed essential not only to make sense of the data but also to verify whether the representations produced by state agencies hold true.
6. On the platforms: moving within a powerful relational setting, but barely beyond
As the following illuminations show, insights into the complex, highly ambiguous data production process behind platforms as described by interviewees stands in stark contrast to its invisibilization when moving onto the platforms themselves. As Ratner and Ruppert (Citation2019, p. 12) note, here the absences, inaccuracies and indeterminacies discussed in the (re)production are no longer visible ‘[…] as the frictions at the site of production disappear at the site of projection.’ In other words, the multiple, even conflicting decision-making processes, influencing factors and permanent transformations become replaced by one coherently materialized relational platform setting, in which the data production is staged as largely linear and conflict-free.
Both platforms start by asking the user to select a particular platform view (state, district or individual school).Footnote8 In Profiles,Footnote9 the user can hereafter take different navigational paths, ranging from a direct entry for a particular school or district to a map search and a ‘most requested districts’ search bar on the right. Both new and ‘most requested’ data reports are available on the left-hand side of the start page. This variety of entry options, however, operates within the same space of ordered and in-formed data, thus offering what van de Oudeweetering and Decuypere (Citation2019, p. 13ff) in their study on MOOCs described as ‘multiple ordered paths’, which may allow a shrinking or stretching of the relational setting, but never move beyond it.
In the following, I selected the random example of Consentino Middle School, which is located in the Haverhill school district and produces the following Profiles page (, left side):
For each school, the user is initially shown a one page at-a-glance summary of the school’s key information (‘where it stands’), which is structured into population data (teachers and students), assessment (compared to district and state average), accountability, and trends produced using DART (District Analysis Review Tool) based on longitudinal data (e.g. assessment results and enrollment data compared to other schools/districts). For districts, the summary is complemented with finance data, namely per-pupil expenditures.
As the screenshot illustrates, the summary page is divided into different sections, each of them providing noteworthy insights into how ‘good’ schooling is framed and how users become (pre)configured. For example, two bar diagrams are provided; on the left side visualizing student race and ethnicity, and on the right side the aforementioned ‘selected populations’ as constructed and predefined in ESSA. Here we clearly see how the seemingly neutral terminology of ‘selected populations’ powerfully stages in-valued politics (about seemingly high-risk students who each present a significant challenge for a school to perform well) and, thus, a powerful relationality of students that becomes visualized and cemented on the front page as a first-glance representation of ‘good’ schooling. Put differently, the more statistical expressions and consequentially the less homogeneity users see, the more likely they are to judge the school as being at risk.
Regarding the accountability classification, Profiles provides the aforementioned new horizontal classification ranging between ‘School of Recognition’ and ‘Broad/Comprehensive Support’. Even though the visualization is complemented by a brief explanation of the model and also a link to more information, the description has become significantly reduced and aligned for easy readability. This means the further left a school is classified, the better it is deemed to be.
In fact, a greater explanation of the actual calculation model is provided by clicking on the accountability tab in the navigation bar, including information on the weighting procedure and selected ESSA impacts, as well as links to further explanatory documents and materials. In other words, and this is also what a number of interviewees in that state agency argued, Profiles does envisage good platform users as being actively engaged with the calculations behind the outputs. However, this engagement has a clear instrumental focus on ‘correct’ data interpretation (which a reading of the documentation files should ensure), which also means that the documentation remains bound to a seemingly linear, rational and clear system of data processing and terminology.
Similarly, while (critical) interaction with the presented data is also deliberately made possible through varying platform screens or forms of data visualization and options for customized selection-making, all these variations remain significantly restricted. One example is the option on Profiles to compare one school’s data profile to the profile of other schools, so enacting a space of school-based comparison. However, such comparisons are not only restricted to what the user sees as the profile of a school but also to what the platform actually offers as a choice of ‘comparable schools’, namely schools that have already been grouped by the state agency based on particular indicators.
Turning to the CCRPI platform in Georgia, it is again the search for either a district or a school that represents the first step of platform usage.Footnote10 After having randomly picked Atlanta Neighborhood Charter Middle School, again a summary screen appears (, right side). The first impression the user gains from the school summary is the overall accountability score marked in green, in the selected case 71.1 out of 100. While the user is presented with a largely similar summary of demographics as on Profiles, the visualization of performance metrics crucially differs. On CCRPI, different sub metrics are displayed, including two star-ratings for school climate and financial efficiency, which are aligned with the standardized percentile metric. From a strategic visualization perspective, the star ratings seem particularly interesting, given that they reflect an increasingly popular and easy-to-understand visualization tool of quality measurement (as used by Amazon and Google Ratings), which thus translates ‘good’ schooling into the simple measure of up to five stars.
Each indicator can be clicked on (or the navigation bar used as an alternative) to view more detail and, thus, to get a more differentiated picture of a district’s or school’s performance. Hereby and similar to Profiles, CCRPI uses different modes of visualization (including flags with traffic light color coding), which each point to different performance dimensions and which are by no means consistent when looking at an individual school’s data. Put differently, as soon as users actively browse through the platform and compare the different visualizations and the different numbers and the different dimensions such as school-district-state to subgroups within that school or among schools (which in CCRPI means re-accessing the platform multiple times), they do get a more differentiated picture of school performance than the condensed number that the front page header suggests. When moving on the platform in this way, however, the CCRPI platform still continues to operate within the set metric frame, displaying ‘good’ schooling as a number close to 100 (plus two five-star-ratings). Even though Georgia also provides a lot of explanatory material on the general department webpage, insights into the data (models) underlying this are even more limited on CCRPI than on Profiles.
7. Discussion and outlook
Building on a gradually emerging body of critical data studies in the field of education, the goal of this contribution was to suggest a critical perspective on SLDS SPP commonly used by US state school agencies. I thus employed a topological lens to capture complex and simultaneously generative manifestations of the digital, which refers to the fabrication of governmental platform space (or indeed set of spaces) as relational settings, but also simultaneously embraces the ongoing enactment and dynamism of these settings through various data practices. Methodologically, I used two entry points: (1) behind the platform, approaching the complex of platform (re)production, mainly using interviews with state agency experts; and (2) on the platform, approaching what could be described as the ‘environment of expected use’ (Decuypere, Citation2019).
A central finding of this contribution was an ongoing shift in SPP or, more generally, in the intended communication of performance data: while state agencies laboriously try to provide more detailed and context-sensitive data to various users in order to make performance measurement fairer and more aligned to the actual complexities of schooling, they are simultaneously confronted with a growing need to make that data more easily readable and ready-to-use for very distinct and also non-expert user groups. This seems to have resulted in a somewhat paradoxical simultaneity, which is clearly visible on Profiles and CCRPI. On the one hand, users are provided with more data and very different dimensions of performance measurement (e.g. school climate, enrollment, demographics, assessment data, etc.), showing that schools do not usually perform ‘well’ on all indicators, but have different strengths and weaknesses which should be taken into account for a more nuanced evaluation. On the other hand, the more complex the dimensions become, the more pressing the need becomes to then merge, align, standardize, strategically visualize and, consequently, integrate all data into one relational setting. Consequently, while the platforms do reveal more data, they simultaneously present an even more reduced ‘summative number’ or ‘summative narrative’, such as the figure displayed at the top of each CCRPI dashboard, or the percentile system, which defines ‘good’ schooling as a number close to 100. Hence, it is still a particular idea and a particular numerical, restricted way of knowing schools that is brought into being through the platforms, thus powerfully guiding any more detailed or ‘customized’ platform explorations. In other words, and here is where the topological lens allows for a specific kind of platform critique, it is not (only) governance through data or platforms which has the potential to powerfully transform schooling, but platforms themselves bring a particular space of governance into being, the norms and values of which, however, are much harder to grasp (and thus, question) due to their invisibilization. For example, with the highlighted visualization of particular student groups as ‘selected populations’ and the grouping of schools attached to such populations’ distributions, the Profiles platform establishes what could be described as powerful inequalities of dataveillance (see also Hartong & Breiter, Citationin press), which are technically naturalized as one of many parts of a school’s data profile. In other words, critical interaction with the SPP means staying on the platform (e.g. exploring the ‘whole’ data profile of a school or comparing ‘comparable’ schools’ data profiles), which van de Oudeweetering and Decuypere (Citation2019, p. 13ff) describe as shrinking or stretching of the relational setting, while simultaneously restricting movement anywhere beyond it – even when clicking on links that lead away from the platforms and into complex documentations (see above).
Nonetheless, at this point little is known about how users actually interact with SPP, whether or not engagement is performed purely instrumentally (which means data are used, but not problematized or questioned), or if and how they read non-platform material. In that regard, it also seems important to see Profiles and CCRPI not as stand-alone platforms, but rather as important parts of wider SLDS platform ensembles that each agency uses, including restricted-access platforms that display and monitor extensive individual student and teacher data. Over the past decade, these platforms have also greatly expanded and increasingly reach into everyday teaching and learning practice. In the case of Georgia, this platform system supports real-time assessment practices, searching and using digital classroom materials, tracking students’ attendance as well as an enormous number of dashboards for district authorities to monitor, track and govern individual students and teachers (e.g. tracking how often a teacher has used which parts of the platform and how long he or she stayed on a particular page). In other words, here the platforms start to relationally affect – and thus discipline (Thompson & Cook, Citation2015) – more and more teaching and learning settings, which to a great extent still operate within school buildings, physical classrooms, and in-person social relations, but become increasingly pervaded by the platform’s logic, norms and values.
Disclosure statement
The presented research was funded by the Deutsche Forschungsgemeinschaft (DFG, German Research Foundation) – project number HA 7367/2-1. The authors declare that there is no conflict of interest.
Additional information
Funding
Notes on contributors
Sigrid Hartong
Sigrid Hartong is a postdoctoral research fellow at the Department of Education at the Helmut-Schmidt-University Hamburg, Germany. She holds a PhD in Sociology (University of Bamberg) and a Habilitation degree in Education Science (Helmut-Schmidt-University Hamburg). Her main scholarly interests include global-local educational reform dynamics, both from single-case and international comparative perspectives, as well as the growing datafication and digitalisation of education policy and practice, particularly visible in the rise of (big) data infrastructures and mobilities. Her previous research explored policies on educational standardisation in Germany and the US, including the implementation of curriculum standards, standardised assessments and new monitoring procedures.
Notes
1. Similarly, Ruppert (Citation2012) argues that database devices always reveal fluctuating ways of materializing the ‘individuality’ of subjects (which refers to both users and the ‘platformized’ subjects), with multiple (and obscure) platform enactments occurring at the same time (see also Allert et al., Citation2018), which nonetheless still operate within particular framings.
2. CCRPI = College and Career Ready Performance Index.
3. The findings in this contribution build on nine semi-structured interviews, ranging between 60 and 90 minutes each. The sample included as many ‘data experts’ as access allowed, operating either across or within different fields of data collection, validation, modelling, storage, processing and distribution.
4. One of the newest ESSA requirements is financial efficiency reporting, measured via per-pupil expenditure data at the school level in a publicly accessible digital financial (online) ‘report card’.
5. www.doe.mass.edu/accountability/accountability-2018.pptx.
7. Yet, such customization is much easier to realize for restricted use platforms, which state agencies can also design according to different access rights (e.g. parents seeing different visualizations in the parent portal than teachers or district superintendents).
8. Within the restricted access platforms, what users get to see is restricted to their ‘role’ (e.g. teacher, parent, superintendent) and based on a preceding process of formal role attribution.
References
- Allert, H., Asmussen, M., & Richter, C. (2018). Formen von Subjektivierung und Unbestimmtheit im Umgang mit datengetriebenen Lerntechnologien – Eine praxistheoretische Position. Zeitschrift Für Erziehungswissenschaft, 21(1), 142–158. https://doi.org/10.1007/s11618-017-0778-7
- Bucher, T. (2018). If … Then: Algorithmic power and politics. Oxford University Press.
- Decuypere, M. (2019). Researching educational apps: Ecologies, technologies, subjectivities and learning regimes. Learning, Media and Technology, 44(4), 414–429. https://doi.org/10.1080/17439884.2019.1667824
- Decuypere, M., & Simons, M. (2016). Relational thinking in education: Topology, sociomaterial studies, and figures. Pedagogy, Culture & Society, 24(3), 371–386. https://doi.org/10.1080/14681366.2016.1166150
- Dieter, M., Gerlitz, C., Helmond, A., Tkacz, N., van der Vlist, F., & Weltevrede, E. (2018). Store, interface, package, connection methods and propositions for multi-situated app studies. https://www001.zimt.uni-siegen.de/ojs/index.php/wps1187/article/view/29.
- Drucker, J. (2010). Graphesis. [Poetess archive journal]. https://journals.tdl.org/paj/index.php/paj/article/view/4
- Gillespie, T. (2010). The politics of ‘platforms’. New Media & Society, 12(3), 347–364. https://doi.org/10.1177/1461444809342738
- Gorur, R. (2013). My school, my market. Discourse: Studies in the Cultural Politics of Education, 34(2), 214–230.
- Gorur, R., Sellar, S., & Steiner-Khamsi, G. (2019). Big data and even bigger consequences. In R. Gorur, S. Sellar, & G. Steiner-Khamsi (Eds.), World yearbook of education 2019: Comparative methodology in the era of big data and global networks (pp. 1–9). Routledge.
- Gray, J., Gerlitz, C., & Bounegru, L. (2018, July–December 1–13). Data infrastructure literacy. Big Data and Society. https://journals.sagepub.com/doi/full/10.1177/2053951718786316
- Grommé, F., & Scheel, S. (2019). Doing statistics, enacting the nation: The performative powers of categories. Nations and Nationalism. (forthcoming)
- Gulson, K. N., Lingard, B., Lubienski, C., Takayama, K., & Webb, P. T. (2017). Policy mobilities and methodology: A proposition for inventive methods in education policy studies. Critical Studies in Education, 58(2), 224–241. https://doi.org/10.1080/17508487.2017.1288150
- Hartong, S. (2016). Between assessments, digital technologies and big data: The growing influence of ‘Hidden’ data mediators in education. European Educational Research Journal, 15(5), 523–536. doi:10.1177/1474904116648966
- Hartong, S. (2018). Towards a topological re-assemblage of education policy? Observing the implementation of performance data infrastructures and ‘centers of calculation’ in Germany. Globalisation, Societies and Education, 16(1), 134–150. doi:10.1080/14767724.2017.1390665
- Hartong, S. (2019). The transformation of state monitoring systems in Germany and the US: Relating the datafication and digitalization of education to the Global Education Industry. In M. Parreira do Amaral, G. Steiner-Khamsi, & C. Thompson (Eds.), Researching the Global Education Industry – Commodification, the Market and Business Involvement (pp. 157–180). Palgrave Macmillan.
- Hartong, S., & Breiter, A. (in press). Between Fairness Optimization and 'Inequalities of Dataveillance' - the Emergence and Transformation of Social Indices in German School Monitoring and Management. In A. Verger, C. Maroy, & S. Grek (Eds.), World Yearbook of Education 2021.
- Hartong, S, & Förschler, A. (2019). Opening the black box of data-based school monitoring: data infrastructures, flows and practices in state education agencies. Big Data & Society, 6(1), 1–12.
- Hartong, S., & Piattoeva, N. (2019). Contextualizing the datafication of schooling – A comparative discussion of Germany and Russia”. Critical Studies in Education, https://www.tandfonline.com/doi/full/10.1080/17508487.2019.1618887.
- Iliadis, A., & Russo, F. (2016). Critical data studies: An introduction. Big Data & Society, 3(2), 2053951716674238. https://doi.org/10.1177/2053951716674238
- Kitchin, R., & Lauriault, T. (2014). Towards critical data studies: Charting and unpacking data assemblages and their work. https://papers.ssrn.com/sol3/papers.cfm?Abstract_id=2474112
- Kitchin, R. (2017). Thinking critically about and researching algorithms. Information, Communication & Society, 20(1), 14–29. https://doi.org/10.1080/1369118X.2016.1154087
- Kitchin, R., Lauriault, T. P., & McArdle, G. (2015). Knowing and governing cities through urban indicators, city benchmarking and real-time dashboards. Regional Studies, Regional Science, 2(1), 6–28. https://doi.org/10.1080/21681376.2014.983149
- Landri, P. (2018). Digital governance of education. Technology, standards and Europeanization of education. Bloombury.
- Martin, L., & Secor, A. J. (2014). Towards a post-mathematical topology. Progress in Human Geography, 38(3), 420–438. https://doi.org/10.1177/0309132513508209
- Mattern, S. (2015). Mission control: A history of the urban dashboard. Placesjournal.org. https://placesjournal.org/article/mission-control-a-history-of-the-urban-dashboard/.
- Ratner, H., & Ruppert, E. (2019). Producing and projecting data: Aesthetic practices of government data portals. Big Data & Society, 6(2), 2. https://doi.org/10.1177/2053951719853316
- Robertson, S. L. (2019). Comparing platforms and the new value economy in the academy. In R. Gorur, S. Sam, & G. Steiner-Khams (Eds.), World yearbook of education 2019: Comparative methodology in the era of big data and global networks (pp. 169–186). Routledge.
- Romito, M., Gonçalves, C., & De Feo, A. (2019). Digital devices in the governing of the European education space: The case of SORPRENDO software for career guidance. European Educational Research Journal, https://journals.sagepub.com/doi/abs/10.1177/1474904118822944.
- Ruppert, E. (2012). The governmental topologies of database devices Theory, Culture and Society, 29(4–5), 116–136.
- Savage, G. C. (2019). What is policy assemblage? Territory, Politics, Governance, 1–17. https://doi.org/10.1080/21622671.2018.1559760
- Scheel, S., Ruppert, E., & Ustek-Spilda, F. (2019). Enacting migration through data practices. Society and Space, 37(4), 579–588. https://journals.sagepub.com/doi/full/10.1177/0263775819865791
- Smith, G. J. (2018, January-March). Data doxa: The affective consequences of data practices. Big Data and Society, 5(1), 205395171775155. https://doi.org/10.1177/2053951717751551
- Souto-Otero, M., & Beneito-Montagut, R. (2016). From governing through data to governmentality through data: Artefacts, strategies and the digital turn. European Educational Research Journal, 15(1), 14–33. https://doi.org/10.1177/1474904115617768
- Takayama, K., Lewis, S., Gulson, K., & Hursh, D. (2016). Putting ‘Fast Policy’ in dialogue with the policy borrowing and lending scholarship in comparative education. Discourse: Studies in the Cultural Politics of Education, 38(2), 1–7.
- Thompson, G., & Cook, I. (2015). Becoming-topologies of education: Deformations, networks and the database effect. Discourse: Studies in the Cultural Politics of Education, 36(5), 732–748. https://www.tandfonline.com/doi/abs/10.1080/01596306.2014.890411
- van de Oudeweetering, K., & Decuypere, M. (2019). Understanding openness through (in) visible platform boundaries: A topological study on MOOCs as multiplexes of spaces and times. International Journal of Educational Technology in Higher Education, 16(1), 1–30. https://doi.org/10.1186/s41239-019-0154-1
- West, J. (2017, January–June). Data, democracy and school accountability: Controversy over school evaluation in the case of DeVasco high school. Big Data & Society, 1–16. https://journals.sagepub.com/doi/full/10.1177/2053951717702408
- Williamson, B. (2015). Digital education governance: Data visualization, predictive analytics, and ‘real-time’ policy instruments. Journal of Education Policy, 31(2), 123–141. https://doi.org/10.1080/02680939.2015.1035758
- Williamson, B. (2017). Big data in education. The digital future of learning, policy and practice. Sage.