
ABSTRACT
Indoor environmental quality (IEQ) in classrooms can have an effect on school children’s comfort, health, and performance. In most classrooms, the teacher is the only one who can take actions to change the IEQ. The objective of this study was to identify what teachers usually do to improve IEQ in classrooms and how these actions relate to children’s comfort perceptions. A survey was carried out among 1145 school children (9–12 years) in 21 primary schools (54 classrooms) in the Netherlands. Every child filled out a questionnaire about their comfort perception and every teacher filled out a questionnaire about their IEQ-improving actions and school children’s requests to change the IEQ. The relations among children’s comfort perceptions, their requests, and teachers’ actions were analysed through t-tests and chi-squared tests. The most common action conducted by teachers was opening windows because of the ‘too warm’ complaints. Correspondingly, the most frequent request of the children was opening/closing windows because of thermal discomfort. However, the teachers’ actions did not have a significant impact on children’s comfort perceptions, which means that teachers could not fulfil every child’s needs in a classroom, even though teachers’ actions did relate to the child’s requests.
1. Introduction
Poor IEQ (Indoor environmental quality) in classrooms is one of the main problems faced by many schools around the world (Stranger, Potgieter-Vermaak, and Van Grieken Citation2007; Theodosiou and Ordoumpozanis Citation2008; Turunen et al. Citation2014; Bluyssen et al. Citation2018). Maintaining an acceptable IEQ in classrooms, which comprises air quality, thermal quality, visual quality and acoustical quality, has shown to have a significant impact on school children’s health, comfort, and performance. An acceptable IEQ in classrooms has been proven to improve children’s health and comfort, and reduce absenteeism (Daisey, Angell, and Apte Citation2003; Mendell et al. Citation2013). The IEQ of classrooms is, to a large extent, determined by the interactions that take place between teachers and the children in those classrooms. Teachers play an important role in maintaining the IEQ in classrooms by taking actions such as opening/closing windows, turning on/off heaters, air conditioning, and lighting systems, and usually they are the only ones that can control the indoor environmental conditions.
IEQ in classrooms and its impact on school children has been a topic of research in numerous studies. Most of these studies put their focuses on the problems related to Indoor Air Quality (IAQ). For example, Haverinen-Shaughnessy et al. (Citation2012) found that moisture is a common problem in schools of the Netherlands, Spain and Finland, about 24% to 47% of schools in these countries reported moisture problems (such as moisture damage, dampness, and mould). Chatzidiakou, Mumovic, and Summerfield (Citation2012) found that there was a relationship between presence of moulds in classrooms and dissatisfaction with IAQ, temperature and relative humidity.
In addition, thermal quality in classrooms is also a popular topic, and in some studies, it was investigated together with IAQ. For example, Mendell and Heath (Citation2005) conducted a literature study about indoor pollutants and thermal conditions in schools and concluded that poor IAQ and thermal conditions are common in schools and have a negative impact on children’s performance and attendance. Bakó-Biró et al. (Citation2012) investigated the effects of ventilation rate on school children’s performance in primary schools in England and established a relationship between low ventilation rates in classrooms and school children’s attention and memory. Based on a field study conducted in 15 classrooms in a secondary school in Singapore, Wong and Khoo (Citation2003) pointed out that most school children prefer cool rather than warm environments. The same results were found by ter Mors et al. for school children in a field study on adaptive thermal comfort in primary schools in the Netherlands and suggested that the temperature in a classroom should be a few degrees lower than in an office (ter Mors et al. Citation2011).
Besides, acoustical quality also emerged in the last decades. A common topic concerns the effect of typical classroom noise on school children’s performance. Shield and Dockrell (Citation2003, Citation2006) observed the effects of typical classroom noise on school children’s literacy and speed tasks, and indicated different effects of different types of noise. For example, the noise from aircraft and road traffic affected children’s long-term recall whereas the noise from trains did not; and the interior classroom noise was found to affect children’s reading ability. Additionally, classroom acoustics has been a major topic of research. Klatte et al. (Citation2010) analysed the effects of classroom reverberation time on children’s performance in 21 classrooms in Germany, and found that children in reverberant classrooms performed worse during a phonological processing task compared to children in less reverberant classrooms.
Last but not least, the visual quality is another factor of importance to the IEQ in classrooms. Wu and Ng (Citation2003) reviewed the research progress on daylighting in schools, identified limitations of previous studies and concluded that future studies should focus on the relationship between occupants’ perception and daylight quality. More than two decades ago, Hathaway (Citation1995) examined school children’s health, attendance, and academic achievements under four different types of artificial light and identified non-visual effects of different types of lighting on school children.
These studies have provided many meaningful findings and conclusions, however, most of these studies just focused on one aspect of IEQ, and up to now, very few studies have considered the four aspects of IEQ as a whole (Bluyssen Citation2017). Also, very few studies have investigated children’s preferences and needs in terms of IEQ in classrooms, and/or included the children’s suggestions to improve IEQ in their classrooms (Zhang, Ortiz, and Bluyssen Citation2018).
According to UNESCO, high-performance school buildings should not only be sustainable but also enable health, comfort and efficiency (UNESCO Citation2014). The United States Environmental Protection Agency (US EPA) (Citation2016b), for example, has suggested six actions for teachers to deal with IAQ problems in classrooms, such as keeping ventilation units free of clutter and reducing the use of cloth-made items in classrooms. Because teachers usually understand the importance of IEQ in classrooms in relation to children’s learning performance, the US EPA emphasised that teachers, as the occupants in classrooms with children, can play an important role in creating a healthy and comfortable indoor environment in classrooms (United States Environmental Protection Agency Citation2016a). Nevertheless, not much is known about the actual impact of teachers’ actions on school children’s perceived comfort.
Another notable point is that traditional school children’s IEQ perceptions have been found to be different from children of non-traditional school (those schools adopted an alternative educational system such as the Jena, Montessori, or Dalton system) and one possible explanation might be their different educational programme (Rathunde and Csikszentmihalyi Citation2005; Bluyssen et al. Citation2018). At non-traditional schools, in general, the emphasis is put on each individual child. For example, at Montessori schools, children have the possibility to develop freely and naturally and receive personalised education (Lillard Citation2013); at Dalton schools, children study on their own pace and they can also get individual help (Koski Citation2014b); at Jena schools the most important purpose is to value the difference among children (Koski Citation2014a). Therefore, it is very likely that children feel freer to ask their teachers for help at these schools, and that teachers’ actions and the relationship between teachers and children are different at these schools. Unfortunately, it seems that no study has been performed that compared teachers’ actions of traditional schools with non-traditional schools.
Therefore, to get more insights into the impact of teachers’ actions, the underlying study aimed to assess and analyse the relations between primary school children’s comfort perceptions in classrooms, the frequency of children asking teachers to change the indoor environmental conditions (by actions such as turning on/off lights; lift/lower shades; close/open windows; etc.), and the frequency of the actual teachers’ actions to improve IEQ in classrooms. Moreover, to compare these results between traditional schools and non-traditional schools, all the analyses were conducted for these two types of schools separately.
2. Methods
2.1. Data collection
This study was part of a large field investigation on health and comfort of school children in 54 classrooms of 21 primary school buildings in the Netherlands, conducted in the spring of 2017 (Bluyssen et al. Citation2018). In the field investigation, data were collected through children’s questionnaires, teachers’ questionnaires, classroom checklists, school building checklists and physical measurements.
2.1.1. General information
The field study involved 1145 school children and 54 teachers. Out of the 21 primary schools studied, 17 (45 classrooms, 949 children) are traditional schools, and five (9 classrooms, 196 children) are non-traditional schools. The data of one traditional school teacher was excluded from this study because of its low completeness, and correspondingly, the children’ data in the same class were also excluded. Therefore, 1128 children, consisting of 568 boys and 560 girls with a mean age of 10 years (9–12), and 53 teachers were the final subjects of this study.
Before the field investigation, parents of the participating children were notified and given a consent form to allow their children’s participation. Researchers handed out the questionnaire to every child and teacher in their own classroom and collected the questionnaires when they were finished. The children and the teachers were given the opportunity to skip any question or even withdraw their participation at any time. The complete procedure of the data collection of the large field investigation has been reported by Bluyssen et al. (Citation2018).
2.1.2. Teachers’ questionnaire
The teachers’ questionnaire comprised six parts: 1. General questions, including type of board present (blackboard, whiteboard or smartboard) and control of indoor environment; 2. Questions about thermal quality, including frequency of opening/closing windows, turning on/off heaters and turning of/off the ventilator/cooling, and lifting/lowering shades, and frequency of children requesting to open/close windows and turn on/off heaters; 3. Questions about visual quality, including frequency of lifting/lowering shades and turning on/off lights, and frequency of children requesting to lower/lift shades; 4. Questions about IAQ, including frequency of opening windows/doors, and frequency of children requesting to open windows/doors; 5. Questions about acoustical quality, including frequency of opening windows/doors and frequency of children requesting to open windows/ doors; and 6. Weekly schedule of children’s activities such as lessons and breaks. Only one teacher in each classroom was asked to fill out a questionnaire and it took them approximately 10 min.
2.1.3. Children’s questionnaire
The children’s questionnaire comprised five parts: 1. General questions, such as age, sex, commuting, general feeling and seating position in classroom; 2. Questions on health, including conditions such as asthma, and symptoms such as dry eyes; 3. Questions about the classroom environment, including cleanliness, temperature, draught, smell, noise, visibility and light; 4. Questions on control, including preference of a number of individually controlled devices (ICDs), importance ranking of environmental factors; 5. Questions about their home, including type of house, location, flooring material in bedroom, smoking at home and presence of pets. The questionnaire comprised 37 questions in total, and on average children spent 30 min to fill it out. In order to help children understand some of the questions, a few cartoon illustrations were included in the questionnaire. Besides, a short introduction was given before children filled in the questionnaire, and they could ask the researchers present in case they were confused about a question.
Regarding teachers’ questionnaire, frequencies of teachers’ actions to improve the IEQ and frequencies of children’s requests (See Appendix A) were the main focus of the underlying paper. Concerning children’s questionnaire, only the questions about children’s perceptions of comfort (See Appendix B) were taken into consideration. The other data, i.e. checklists and physical measurements, have been reported elsewhere (Bluyssen et al. Citation2018).
2.2. Data analysis
Data were analysed in four steps using SPSS version 23.0 (SPSS Inc. Chicago, IL, USA). First, the basic information (e.g. the mean and standard deviation of school children’s comfort perceptions, the frequency of teachers’ actions and children’s requests) was analysed using descriptive analysis. Both the answers of the school children and the answers of the teachers were analysed at classroom level. It means that the data related to the children’s answers were split into 53 groups based on classroom ID and for each classroom the mean values were calculated. Using these classroom-based mean values and teachers’ answers, a new database was created. All further analyses performed at classroom level were based on this new database.
Then, relationships among school children’s comfort perceptions, their requests and teachers’ actions were analysed with t-tests and Chi-squared tests. Previous results (Bluyssen et al. Citation2018) showed that children’s perceptions of IEQ in classrooms of non-traditional schools differed significantly from perceptions of children of traditional schools. For this reason, in this paper all of the analyses were conducted in three parts: all the schools together, the traditional schools independently, and the non-traditional schools independently.
3. Results
3.1. Descriptive analysis results
3.1.1. Children’s comfort perception (children’s questionnaire)
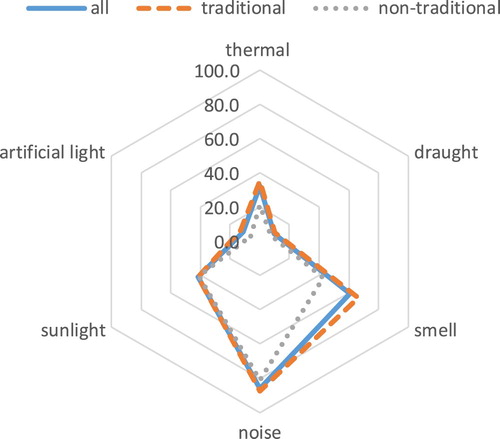
In the field study (Bluyssen et al. Citation2018), children’s comfort perceptions in classrooms were collected by directly asking them ‘Can you hear/smell/see … ’. If they gave an affirmative answer (yes or sometimes), they needed to answer the question: ‘Are you bothered by the noise/smell/light … ?’. The affirmative answers to these questions were regarded as discomforts in this study. shows the percentage of school children who stated to have these discomforts. In general, as reported by Bluyssen et al. (Citation2018), children of traditional schools felt less comfortable in classrooms than children of non-traditional schools. ‘Noise’ caused the most discomfort: on average, 86% of children in classrooms were bothered by noise (88% for traditional schools and 81% for non-traditional schools). And according to their responses, most of the noise was caused by their classmates. ‘Smell’ was the second most important cause of discomfort: 63% of children were bothered by it (67% for traditional schools and 44% for non-traditional schools). The third cause of discomfort was sunlight: 42% of children of both types of schools were bothered by it. Followed by ‘Thermal discomfort’: 35% of the children were bothered by it (38% for traditional schools and 21% for non-traditional schools). ‘Artificial light’ and ‘draught’ were perceived as least important causes of discomfort in classrooms.
Figure 1. Percentage of school children’s discomfort for the different IEQ aspects in their classrooms.
3.1.2. Teachers’ actions (teachers’ questionnaire)
The main teacher in each of the classrooms was asked to fill out the teachers’ questionnaire. The questions about the frequency of teachers’ actions and school children’s requests to the teachers with respect to these actions were analysed. The related answers like ‘once a day’ and ‘more than once a day’ were combined to ‘at least once a day’; other possible answers were combined to ‘less than once a day’. presents the percentage of teachers who performed these actions ‘at least once a day’ in the classrooms of different types of school.
Figure 2. Percentage of teachers who performed these actions at least once a day in the classrooms.
Note: The reasons for the actions are shown in parenthesis.
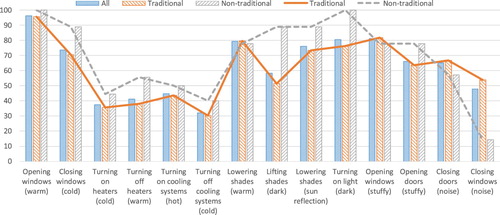
In general, the difference of the frequency of teachers’ actions between these two types of schools were not significant. As it is shown in , among these 14 actions, opening windows because of ‘too warm’ complaints was the most frequent one; more than 90% of teachers at all schools opened windows at least once a day. Closing windows because of ‘too cold’, complaints, lowering shades because of ‘too warm’ complaints, lowering shades because of ‘sun reflection’ complaints, turning on lights because of ‘too dark’ complaints, and opening windows because of ‘stuffiness’ complaints, were also performed often. More than 70% of the teachers at all schools performed those actions at least once a day. Actions related to cooling systems occurred the least; less than 50% of teachers at all schools adjusted them daily, which might be related to the fact that these systems were not present in some classrooms: only 18 classrooms (14 traditional and 4 non-traditional) has the mechanical balanced system, and not all of the teachers answered those related questions. Therefore, two questions about the cooling system were not included in the following analysis because of the small number of samples.
Table 1. Percentage of teachers who perform the actions at least once a day.
Besides, it is worth to mention that 100% of non-traditional schools possessed the external shading, while for traditional schools, this percentage was only 67%. Apart from these, the possession rates of all the other related equipment (including operable window, heater, light, and door) were all 100% at both types of schools.
3.1.3. Children’s request (teachers’ questionnaire)
presents the percentage of teachers who were asked by children to perform these adjustments ‘at least once a day’ in the classrooms of different types of school. ‘Adjusting windows’ was the most frequent request of children at all schools. More than 70% of the teachers, at both types of schools were asked to perform that action at least once a day because of children’s thermal discomfort. ‘Adjusting shades’ was also a frequent request: 61% of the teachers (51% for traditional schools and 78% for non-traditional schools) were asked to perform this at least once a day because of children’s visual discomfort. Compared to these requests, ‘Adjusting windows/doors because of smell or noise in the classroom’ were the least frequent request, with less than half of the teachers asked to do these adjustments at least once a day at both types of schools.
Figure 3. Percentage of teachers, for different types of schools, who were asked by the children to perform these adjustments at least once a day.
Note: The reasons of the requests are shown in parenthesis.
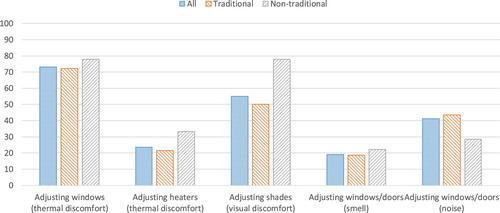
When comparing traditional schools and non-traditional schools, it can be seen that almost all of these requests, except for ‘adjusting windows/doors because of noise’, were asked more frequently in classrooms of non-traditional schools. However, the differences of frequency of children’s requests between these two types of schools were not statistically significant ().
Table 2. Difference of frequency of children’s requests between different school types.
3.2. Relationship analysis
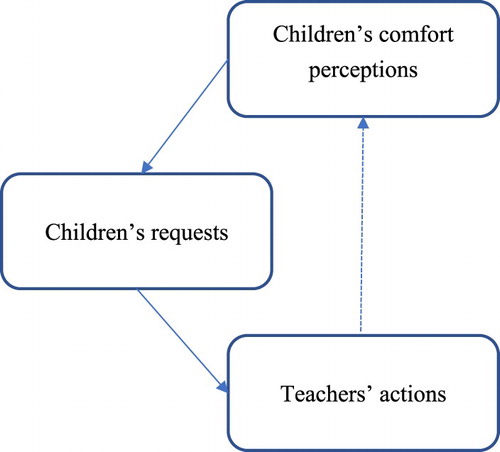
In almost all the classrooms of the primary schools studied, the teacher was the only one who was able to control the IEQ in the classroom by performing actions such as opening or closing windows, turning lights on or off, etc. If children felt uncomfortable, what they could do was to ask the teacher for help. Therefore, as shown in , the following hypotheses can be made:
Children’s comfort perceptions have an impact on their requests to teachers.
Children’s requests have an impact on teacher’s actions.
Teacher’s actions, in turn, have a relationship with children’s comfort perception.
Figure 4. Relationships between children’s comfort perceptions, requests and teachers’ actions.
To test whether the teacher can help children feel better or not by performing actions based on the children’s request, relationships between children’s perceptions, children’s requests, and teachers’ actions were studied.
3.2.1. Relationship between children’s comfort perceptions and their requests
A comparison of school children’s comfort perceptions was conducted with t-tests between two groups of classrooms with different frequencies of children’s requests (less than once a day vs. at least once a day). The results are presented in . In general, the differences found were not significant, except for ‘bothered by noise’ in the analysis of all schools (p = 0.039) and in the analysis of the traditional schools (p = 0.031); and for ‘bothered by sunlight’ in the analysis of the non-traditional schools (p = 0.041).
Table 3. Comparison of children’s perceptions between two groups of classrooms with different frequencies of children’s requests (less than once a day vs. at least once a day).
Detailed information on these three significant relations is shown in Appendix C. Generally, as more children were bothered by noise, more children asked their teachers to adjust windows/doors more often (at least once a day). The same tendency was also found at traditional schools. For the non-traditional schools, as more children were bothered by sunlight, the more children asked the teacher to adjust shades more often (at least once a day).
3.2.2. Relationship between school children’s requests and teachers’ actions
The relationships between teachers’ actions and children’s requests were analysed with Chi-squared and Fisher exact tests (with an expected cell size less than 5). As shown in , in the analysis of all schools statistically significant relations were found for all of the IEQ factors (p < 0.05), except for the visual aspect. The more frequently the children asked, the more often the teacher performed the related actions, and this was also found for traditional schools (Appendix D). For non-traditional schools, no statistically relevant relationship between teachers’ actions and children’s requests was found.
Table 4. Relationships between children’s requests and teachers’ actions.
3.2.3. Relationship of teachers’ actions and children’s comfort perceptions
To identify the differences of children’s comfort perceptions between two groups of classrooms with different frequencies of teachers’ actions (less than once a day vs. at least once a day), t-tests were conducted. As shown in , almost all the P-values were greater than 0.05: there was no statistically significant difference in children’s comfort perceptions between the conditions that teachers performed these actions at least once a day and the conditions that teachers performed these actions less than once a day.
Table 5. Comparison of children’s perceptions between two groups of classrooms with different frequencies of teachers’ actions (less than once a day vs. at least once a day).
However, some statistically relevant differences of children’s perceptions were found between different frequency of teachers’ actions. For all schools, the frequency of teachers’ closing doors or windows was higher (at least once a day) in the classrooms with higher percentage of children bothered by noise. The tendency is the same for the classrooms of traditional schools. For the non-traditional schools, a statistically relevant difference was found for the thermal comfort aspect. The more children felt thermally uncomfortable in the classrooms, the higher frequency of teachers lowering shades (at least once a day). More details about these differences can be found in Appendix E.
4. Discussion
4.1. Difference between traditional schools and non-traditional schools
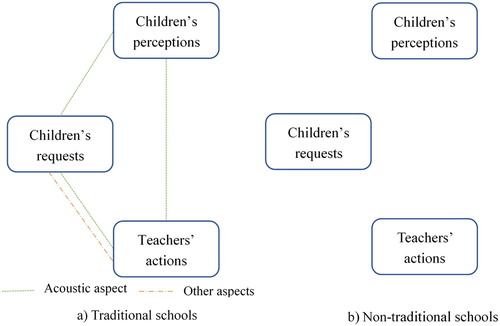
Differences in relationships between children’s perceptions, their requests and teachers’ actions are presented in – for traditional and non-traditional schools. A relationship between children’s perceptions, children’s requests, and teachers’ actions were found only for the acoustical aspect at traditional schools ((a)). Children’s poor noise perceptions resulted in more requests of adjusting windows/doors, and these increasing number of requests led teachers to more frequently open or close windows/doors. Furthermore, the frequency of teachers’ opening/closing windows/doors proved to relate to children’s noise perceptions. For other aspects of IEQ at traditional schools, relationships were only found between children’s requests and teachers’ actions ( and (a)). These results indicate that although teachers did take actions at the request of children, these actions did not really improve children’s comfort perception, because children’s requests were not related to their comfort perceptions.
Figure 5. Relationships between children’s comfort perceptions, requests and teachers’ actions at different schools.
There are two possible reasons for why no relation was found between children’s requests and perceptions. First, it could be that teachers can only respond to one request at the time. Second, it could be that some children did not ask teachers’ help even though they felt uncomfortable (some children might be too timid or some children might think teachers cannot help them). Concerning the non-existent relation between children’s perceptions and teachers’ actions, there are also two possible reasons. The first reason is similar as the one mentioned before: teachers can only take one action to response to one child at the time. The second reason might be due to the limited options that teachers have (on/off heaters; lift/lower shades; open/close windows) to change or control the IEQ in classrooms.
For the non-traditional schools, the relationship triangle, as presented in , could not be established between children’s perceptions, their requests and teachers’ actions ((b)). Only two relationships were found between two of them: (a) a relationship between children’s sunlight perceptions and their requests of adjusting shades (), and (b) a relationship between children’s thermal perceptions and the frequency of teachers’ lowering shades ().
The non-relationship between children’s perceptions, children’s requests and teachers’ actions at non-traditional schools might be explained by the non-traditional education, some of them even have individualised lessons (Lillard Citation2013), giving children more freedom at these schools. In this context, children could request more often, but unfortunately, the more requests children have, the more difficult it is for teacher to deal with those responses, especially when the requests are conflicting.
In fact, as was presented in Zhang, Ortiz, and Bluyssen (Citation2018) for the traditional schools studied, different children reported different perceptions, and therefore different requests can occur in the same classroom. This makes it difficult for teachers to take actions that make all children feel better. Although the non-traditional schools were not included because of the limited amount of data, it is very likely that children at non-traditional schools are also different from each other and their teachers are also not able to respond to their different requests at the same time. Therefore, it seems that no matter which type of school, teachers have difficulties in fulfilling children’s requests, because a request of one child might cause discomfort to another one.
4.2. Limitations and suggestions for future research
Although this study provides important insights into the relationships among children’s comfort perceptions, their requests, and teachers’ actions in the classrooms, the small age span of children could be a limitation. All the children that participated in this survey were between 9 and 12 years old. Thus, the results of this study cannot be generalised to all primary school children. Future research could possibly extend the study sample by taking younger children into account and more children of non-traditional schools. In addition, especially when younger children are involved, the data collection method (questionnaire survey) used in this study can be a limitation as well. Future research could apply other types of data collection methods, for example observations or interviews.
5. Conclusion
This study aimed to find out relationships between school children’s comfort perceptions, their requests, and teachers’ actions in their classrooms at traditional and non-traditional schools. For traditional schools, this study showed that even though most children felt uncomfortable with ‘noise’ and ‘smell’, the children cannot do a lot to change these conditions, except for asking for their teachers’ help. With regard to acoustics, the significant relations between children’s perceptions, their requests and teachers’ actions indicated the positive relationship between children and teachers. Children could express their annoyance of noise by asking teachers’ help and teachers could take actions at their requests. However, even so, noise is still the most annoying problem in classrooms. Regarding to the other factors of IEQ, although teachers’ actions were proved to be related to children’s requests, neither of them were found to be related to children’s perception. In other words, teachers’ actions could not really help these children since these requests were not stem from children’s perception.
For non-traditional schools, this study could hardly establish the relationship between children’ perception, their request and teachers’ actions. One possible reason of this weak interaction could be that the special pedagogy applied in these schools ensure more freedom and right to children, so, they can easily change position or even adjust the IEQ by themselves. However, even in the relaxed learning environment, children still felt uncomfortable in terms of the IEQ in classrooms.
Therefore, to sum up, more effective methods seem worth investigating no matter at which type of schools. Knowing that different children have different preferences and needs, one teacher could not fulfil all of them at once, it is likely that different solutions are required. Since oneself is the expert of their own perception, everyone should have the right to change their local IEQ. Thus, a possible option in the future could be providing children with individually controlled devices as is already being used in the office environment.
Disclosure statement
No potential conflict of interest was reported by the authors.
Additional information
Notes on contributors
Dadi Zhang
Dadi Zhang: University of Science and Technology Beijing, Bsc, 2009–2013; University of Science and Technology Beijing, Msc, 2013–2016; Delft University of Technology, PhD, 2016–now.
Philomena M. Bluyssen
Prof. Dr. Philomena M. Bluyssen, initiator and creator of the SenseLab, was appointed full Professor Indoor Environment in 2012 at the Faculty of Architecture and the Built Environment, of the Delft University of Technology, after working for more than twenty years for TNO, a research institute in The Netherlands. She holds a master degree (building engineer) from the Technical University of Eindhoven (1986), and a PhD from the Technical University of Denmark (1990). She has written more than 230 publications in (inter)national journals and conferences. For ‘The Indoor Environment Handbook: How to make buildings healthy and comfortable’, she received the prestigious Choice Outstanding Academic Titles of 2010 Award.’ Her book titled ‘The Healthy Indoor Environment – How to assess occupants’ wellbeing in buildings’, published in 2014 by Taylor & Francis, was awarded the Interior Design Educators Council (IDEC) 2016 Book Award.
Related Research Data
References
- Bakó-Biró, Z. s., D. J. Clements-Croome, Neena Kochhar, H. B. Awbi, and M. J. Williams. 2012. “Ventilation Rates in Schools and Pupils’ Performance.” Building and Environment 48: 215–223. doi: 10.1016/j.buildenv.2011.08.018
- Bluyssen, Philomena M. 2017. “Health, Comfort and Performance of Children in Classrooms – New Directions for Research.” Indoor and Built Environment 26 (8): 1040–1050. doi:10.1177/1420326X16661866.
- Bluyssen, Philomena M., Dadi Zhang, Stanley Kurvers, Marjolein Overtoom, and Marco Ortiz-Sanchez. 2018. “Self-reported Health and Comfort of School Children in 54 Classrooms of 21 Dutch School Buildings.” Building and Environment 138: 106–123. doi: 10.1016/j.buildenv.2018.04.032
- Chatzidiakou, Lia, Dejan Mumovic, and Alex James Summerfield. 2012. “What Do We Know About Indoor air Quality in School Classrooms? A Critical Review of the Literature.” Intelligent Buildings International 4 (4): 228–259. doi:10.1080/17508975.2012.725530.
- Daisey, Joan M., William J. Angell, and Michael G. Apte. 2003. “Indoor Air Quality, Ventilation and Health Symptoms in Schools: An Analysis of Existing Information.” Indoor air 13 (1): 53–64. doi: 10.1034/j.1600-0668.2003.00153.x
- Hathaway, Warren E. 1995. “Effects of School Lighting on Physical Development and School Performance.” The Journal of Educational Research 88 (4): 228–242. doi: 10.1080/00220671.1995.9941304
- Haverinen-Shaughnessy, U., A. Borras-Santos, M. Turunen, J.-P. Zock, J. Jacobs, E. J. M. Krop, Lidia Casas, R. Shaughnessy, M. Täubel, and D. Heederik. 2012. “Occurrence of Moisture Problems in Schools in Three Countries From Different Climatic Regions of Europe Based on Questionnaires and Building Inspections – the HITEA Study.” Indoor Air 22 (6): 457–466. doi: 10.1111/j.1600-0668.2012.00780.x
- Klatte, Maria, Jürgen Hellbrück, Jochen Seidel, and Philip Leistner. 2010. “Effects of Classroom Acoustics on Performance and Well-being in Elementary School Children: A Field Study.” Environment and Behavior 42 (5): 659–692. doi: 10.1177/0013916509336813
- Koski, Marja-Ilona. 2014a. “Dutch Primary Education: Jenaplan & Steiner”.
- Koski, Marja-Ilona. 2014b. “Dutch Primary Education: Montessori & The Dalton Plan.” Accessed August 26. https://www.iamexpat.nl/education/education-news/dutch-primary-education-montessori-dalton-plan.
- Lillard, Angeline S. 2013. “Playful Learning and Montessori Education.” NAMTA Journal 38 (2): 137–174.
- Mendell, Mark J., Ekaterina A. Eliseeva, Molly M. Davies, Michael Spears, Agnes Lobscheid, William J. Fisk, and Michael G. Apte. 2013. “Association of Classroom Ventilation with Reduced Illness Absence: A Prospective Study in California Elementary Schools.” Indoor air 23 (6): 515–528. doi: 10.1111/ina.12042
- Mendell, M. J., and G. A. Heath. 2005. “Do Indoor Pollutants and Thermal Conditions in Schools Influence Student Performance? A Critical Review of the Literature.” Indoor Air 15 (1): 27–52. doi:10.1111/j.1600-0668.2004.00320.x.
- Rathunde, Kevin, and Mihaly Csikszentmihalyi. 2005. “Middle School Students’ Motivation and Quality of Experience: A Comparison of Montessori and Traditional School Environments.” American Journal of Education 111 (3): 341–371. doi: 10.1086/428885
- Shield, Bridget M., and Julie E. Dockrell. 2003. “The Effects of Noise on Children at School: A Review.” Building Acoustics 10 (2): 97–116. doi: 10.1260/135101003768965960
- Shield, Bridget M., and Julie E. Dockrell. 2006. “Acoustical Barriers in Classrooms: The Impact of Noise on Performance in the Classroom.” British Educational Research Journal 32 (17), doi:10.2307/30000010.
- Stranger, M., S. S. Potgieter-Vermaak, and R. Van Grieken. 2007. “Comparative Overview of Indoor Air Quality in Antwerp, Belgium.” Environment International 33 (6): 789–797. doi: 10.1016/j.envint.2007.02.014
- ter Mors, Sander, Jan L. M. Hensen, Marcel G. L. C. Loomans, and Atze C. Boerstra. 2011. “Adaptive Thermal Comfort in Primary School Classrooms: Creating and Validating PMV-Based Comfort Charts.” Building and Environment 46 (12): 2454–2461. doi: 10.1016/j.buildenv.2011.05.025
- Theodosiou, T. G., and K. T. Ordoumpozanis. 2008. “Energy, Comfort and Indoor Air Quality in Nursery and Elementary School Buildings in the Cold Climatic Zone of Greece.” Energy and Buildings 40 (12): 2207–2214. doi: 10.1016/j.enbuild.2008.06.011
- Turunen, Mari, Oluyemi Toyinbo, Tuula Putus, Aino Nevalainen, Richard Shaughnessy, and Ulla Haverinen-Shaughnessy. 2014. “Indoor Environmental Quality in School Buildings, and the Health and Wellbeing of Students.” International Journal of Hygiene and Environmental Health 217 (7): 733–739. doi: 10.1016/j.ijheh.2014.03.002
- UNESCO. 2014. “School HVAC: High Performance School Characteristics.” Accessed July 10. http://www.unescocorp.com/sedial-eiusmod-tempor/.
- United States Environmental Protection Agency. 2016a. “Teachers and Healthy Indoor School Environments.” Accessed July 10. https://www.epa.gov/iaq-schools/teachers-and-healthy-indoor-school-environments.
- United States Environmental Protection Agency. 2016b. “Top Actions Teachers Can Take to Address IAQ.” Accessed July 10. https://19january2017snapshot.epa.gov/iaq-schools/teachers-and-healthy-indoor-school-environments_.html#topactions.
- Wong, Nyuk Hien, and Shan Shan Khoo. 2003. “Thermal Comfort in Classrooms in the Tropics.” Energy and Buildings 35 (4): 337–351. doi: 10.1016/S0378-7788(02)00109-3
- Wu, Wei, and Edward Ng. 2003. “A Review of the Development of Daylighting in Schools.” Lighting Research and Technology 35 (2): 111–125. doi: 10.1191/1477153503li072oa
- Zhang, Dadi, Marco A. Ortiz, and Philomena M. Bluyssen. 2018. “Clustering of Dutch School Children Based on Their Preferences and Needs of the IEQ in Classrooms.” Building and Environment, doi:10.1016/j.buildenv.2018.10.014.