
 ?Mathematical formulae have been encoded as MathML and are displayed in this HTML version using MathJax in order to improve their display. Uncheck the box to turn MathJax off. This feature requires Javascript. Click on a formula to zoom.
Abstract
Organisms can cope with changing temperature under climate change by either adapting to the temperature at which they perform best and/or by dispersing to more benign locations. The evolution of a new thermal niche during range shifting is, however, expected to be strongly constrained by genetic load because spatial sorting is known to induce fast evolution of dispersal. To broaden our understanding of this interaction, we studied the joint evolution of dispersal and thermal performance curves (TPCs) of a population during range shifting by applying an individual-based spatially explicit model. Always, TPCs adapted to the local thermal conditions. Remarkably, this adaptation coincided with an evolution of dispersal at the shifting range front being equally high or lower than at the trailing edge. This optimal strategy reduces genetic load and highlights that evolutionary dynamics during range shifting change when crucial traits such as dispersal and thermal performance jointly evolve.
Background
To prevent extinction caused by climate change, populations need to keep track of their optimum environment by range shifting, accommodation of the phenotype by phenotypic plasticity or the establishment of favourable adaptations [Citation28,Citation62]. Variation in these responses depends largely on the considered timescale, the organism's life history, the rate and extent of environmental change, the availability of a suitable habitat and the dispersal ability of the population [Citation20,Citation23,Citation28,Citation40,Citation59].
So far, theory demonstrated the evolution towards increased dispersal distance during range shifting [Citation10,Citation27]. However, as dispersal elevates gene flow, it interacts with the process of local adaptation, playing an important role in shaping the thermal performance curve (further referred to as TPC) of a population. This curve shapes the relationship between an individual's performance and temperature [Citation2,Citation33]. Since the TPC on its turn regulates the cost of dispersal by determining which habitat is suitable or not, it influences dispersal evolution [Citation12]. To take this eco-evolutionary feedback in account, it is critical to study the simultaneous evolution of dispersal and the TPC of a population during range shifting.
A TPC is defined by an optimum temperature (Topt), a maximum performance at this optimum (TPmax) and a thermal (niche) breadth (Tbreadth) [Citation9,Citation24,Citation33]. Its final shape is determined by the degree of plasticity of several fitness-related traits towards temperature [Citation18]. Depending on the size of the thermal breadth, an individual may be classified as either a specialist or a generalist [Citation31]. The thermal breadth is observed to differ between species [Citation47,Citation55,Citation65], between populations of the same species [Citation15] and within the same population [Citation36,Citation63]. This differentiation in versatility was often concluded to be adaptive, as in studies on grasshoppers (Orthoptera: Acrididae) or topminnows (Fundulidae) in which the more eurythermal species showed to be most broadly distributed [Citation55,Citation65]. However, specialists may still be selected because of the existence of a trade-off between tolerance breadth and performance capacity at the optimal temperature. This is described by Levins [Citation43] as the principle of allocation, being the basis of the ‘jack-of-all-trades is a master of none’ hypothesis and is the result of costs and limits inherent to plasticity [Citation7,Citation21,Citation31,Citation49]. The existence of this trade-off has as well been confirmed [Citation24], suggested [Citation15,Citation36,Citation1,Citation55] as rejected [Citation31]. Although experimental evidence is often conflicting, some trade-off must exist between thermal breadth and fitness as super generalists are not prevalent in nature [Citation53]. Moreover, studies which do not support ‘the jack-of-all-trades is a master of none’ hypothesis do not always follow a correct design [Citation49]. Next to a broadening of the TPC, another possible thermal adaptation is the shifting of the TPC along the temperature axis according to Topt [Citation1,Citation15]. visualizes different functions of such a TPC, as used in our model.
Figure 1. Comparison of performance capacity between three genotypes (Tbreadth) for different strengths of the performance-thermal breadth trade-off (a). The global optimum is fixed at the 50th column along the x-axis (xopt = 50) and local adaptation is not allowed (xadap = 0). The value of Tbreadth is indicated in the legend.
While some studies tackled the issue of TPCs during climate change [Citation32], they overlooked the important interacting effect of dispersal [Citation61], and local adaptation [Citation6,Citation56] during range shifting. Previously, the simultaneous evolution of dispersal and local adaptation mainly gained attention in a static metapopulation context [Citation16,Citation25,Citation26,Citation39,Citation48]. When thermal adaptation was investigated in the context of climate change, this was mostly done for an isolated population [Citation45,Citation46]. Both Pease et al. [Citation50] and Kubisch et al. [Citation41] are exceptions as they compare the relative importance of dispersal to adaptation during climate warming. Still, the niche breadth of the TPC is fixed in these models.
To fill this gap, we aimed to study the simultaneous evolution of dispersal and the TPC of a population during range shifting. To accomplish this, our simulations are subdivided in two parts. In the first part, only the thermal breadth of the TPC and dispersal are evolvable, while in the second part, the thermal optimum of the TPC is also evolvable. Angert et al. [Citation1] state that within-population variation in TPC is crucial when estimating the effect of global warming. We incorporated this type of variation in an individual-based spatially explicit model. Within this model, individuals compete for resources according to the match of their thermal performance relative to the prevailing temperature ().
Figure 2. Overview of the life cycle of an individual.
Our main findings highlight that evolutionary dynamics during range shifting change when crucial traits such as thermal breadth and thermal optimum jointly evolve.
Methods
This study aims to understand how thermal breadth and dispersal distance evolve simultaneously during range shifting (part 1). Also, the effects of an evolvable thermal optimum on evolutionary dynamics in dispersal and thermal breadth are examined (part 2). The results were obtained by applying an individual-based, spatially explicit model.
The landscape
The applied landscape is a rectangular lattice (1500 × 100 grid cells) in which each suitable cell may contain a population. The longest axis of the landscape (x) is characterized by a gradient in temperature, decreasing linearly with increasing x-coordinate. Except for this gradient, all cells are homogeneous. In this rectangular landscape, survival is only allowed within the climate window. This window has a dimension of 100 × 100 grid cells, limiting the existence of individuals along the x-axis of the landscape. The boundaries of the climate window along the x-axis are wrapped whereas the boundaries parallel to the y-axis are absorbing. In case the thermal optimum is not evolvable, it is constant for all individuals (i.e. the global thermal optimum) and defined as the central column along the x-axis within this climate window. The columns with lower x-coordinates than the central column are warmer, whereas columns with higher x-coordinates are colder, representing the latitudinal temperature gradient. For simplicity, local variation in temperature is not included in our model.
Population dynamics
All parameters were tested for multiple values (see sensitivity analyses). However, only the values applied within Figures – are mentioned in this section.
Figure 3. The evolution of thermal breadth and dispersal in function of position along the x-axis before and during range shifting. The evolution of the thermal optimum is not allowed (xadap = 0). Each dot represents the genotype of a sampled individual. The global optimum of the population is located at the 50th column along the x-axis before range shifting and at the 1349th column during range shifting. a determines the strength of the performance-thermal breadth trade-off and is either fixed at 1, 5 or 10.
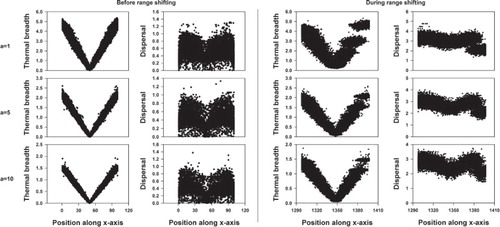
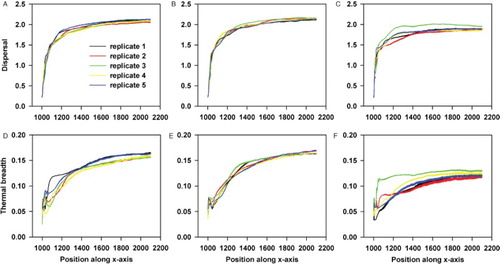
Figure 4. An overview of how the traits under selection change from the moment range shifting starts for the back (A,D), middle (B,E) and front (C,F) of the population. In this scenario, only dispersal and thermal breadth are evolvable. Each colour refers to the mean in either dispersal (A,B,C) or thermal breadth (D,E,F) for a particular replicate. In total, five replicates are used.
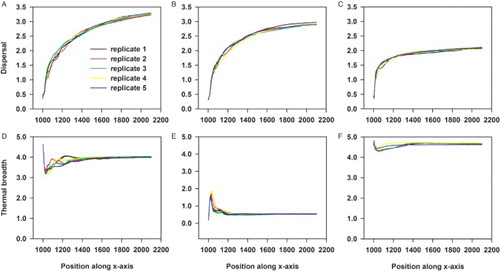
Figure 5. The relationship between dispersal and thermal breadth within a population experiencing range shifting. Here, local adaptation of the thermal optimum is not allowed (xadap = 0). Each dot represents the genotype of a sampled individual. a determines the strength of the performance-thermal breadth trade-off and is either fixed at 1, 5 or 10.
Figure 6. The evolution of thermal breadth and dispersal in function of position along the x-axis before and during range shifting when local adaptation of the thermal optimum is allowed. Each dot represents the genotype of a sampled individual. The global optimum of the population is located at the 50th column along the x-axis before range shifting and at the 1349th column during range shifting. a determines the strength of the performance-thermal breadth trade-off and is either fixed at 1, 5 or 10.
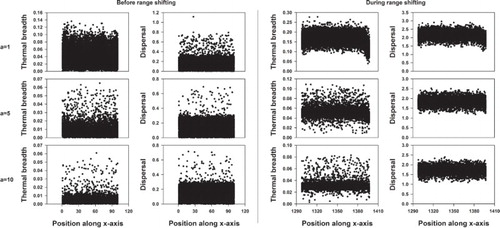
Figure 7. An overview of how the traits under selection change from the moment range shifting starts for the back (A,D), middle (B,E) and front (C,F) of the population. In this scenario dispersal, thermal optimum and thermal breadth are evolvable. Each colour refers to the mean in either dispersal (A,B,C) or thermal breadth (D,E,F) for a particular replicate. In total, five replicates are used.
The implemented species reproduces asexually in discrete generations [Citation10,Citation11]. Individuals experience several events within their lifetime (see for an overview) and survive only within the climate window. Our hypothetic organism may refer to any semelparous organism with one distinct, passive dispersal phase with dispersal costs related to arrival in unsuitable habitat (i.e. outside the climate window). For simplicity, we consider our organism a semelparous plant or insect (e.g. aphids) species [Citation10,Citation11].
Each individual is characterized by three haploid genes: (i) the first gene determines an individual's thermal breadth (Tbreadth), (ii) the second controls its extent of local adaptation towards the present thermal conditions (xadap, the distance in space of an individual's thermal optimum to the global optimum of the species) and (iii) the third stands for the standard deviation of a Gaussian distribution representing an individual's dispersal kernel (σdisp). Tbreadth and xadap are determining the competitive strength of an individual during the competition phase of the life cycle. For more specific information concerning how these genes influence a specific phase within the lifetime of an individual, read the description of the competition and dispersal phase below.
Competition
Individuals who are best adapted to local conditions gain access to limited resources first, excluding the competitively weaker individuals from the population. As such, individuals interact by their competitive strength. This strength is dependent on an individual's performance capacity as determined by its TPC described by the following formula following Chaianunporn and Hovestadt [Citation16]:
(1)
(1)
Here, TP refers to the thermal performance of an individual and TPmax to the maximum value of TP. a represents a flexible parameter describing the strength of the performance (TPmax) – thermal breadth (Tbreadth) trade-off (see for an illustration of the effect of a). Within the competition phase, competitive strength is directly related to performance capacity. As such, the TPC function is used as a measure for the competitive strength of an individual. We assumed that when TP is zero or negative, local conditions are too unsuitable for an individual to reproduce. x refers to an individual's x-coordinate and xadap to the deviation of an individual's local optimum in space to xopt (the location of the global optimum along the x-axis). For example, when xopt equals 50 and xadap equals 20, the local optimum of the individual is positioned within the column with x-coordinate 70. When the thermal optimum is not evolvable (part 1), xadap will be equal to 0 for all individuals. As such, the local optimum of an individual always coincides with xopt (the global optimum of the population positioned within the central column along the x-axis of the climate window).
After determining the competitive strength of all individuals within a cell, the chance of mortality (Pmort) was defined for each individual as
(2)
(2)
Here, N* stands for the carrying capacity within a cell which was fixed at 50. Within a cell, the chance of mortality Pmort for each individual was weighted for the total competitive strength of all individuals within that cell . By doing this, an individual will have a higher survival chance when the sum of the competitive strength of all individuals within a cell
is low.
Reproduction
Each individual has on average three (λ) offspring. The exact number is drawn from a Poisson distribution with mean λ, including demographic stochasticity. During reproduction, the mutation rate for each gene under selection is 0.001, allowing evolution. In case a mutation occurs, the value for the offspring of that gene is sampled out of the following interval: [parental value – mutation size, parental value + mutation size] with the mutation size being 0.5 for σdisp and 5 for xadap. For Tbreadth, the mutation size equals 0.5 when the thermal optimum is not evolvable, but 0.05 when it is evolvable. The different mutation sizes are chosen in such a way that the speed of reaching equilibrium is optimized, reducing computational effort. These chosen mutation sizes do not affect the outcome of our model (see Supplementary material part 2). As the implemented species is considered to be semelparous, an individual dies after reproducing.
Dispersal
The dispersal distance is drawn from a Gaussian probability distribution with standard deviation (σdisp). The larger the value of σdisp, the wider the tail of the Gaussian distribution resulting in an individual dispersing further and more frequently. The direction of dispersal is random [Citation10,Citation11]. Individuals who arrived outside the climate window will not be able to reproduce and expire.
Simulations
Initialization of individuals
Each simulation starts with the initialization of 2000 individuals within the first 100 columns of the landscape. Until equilibrium is reached in the evolving traits, the population is only allowed to survive in this restricted range. During initialization, the values of the parameters under selection are randomly drawn from a uniform distribution with values between 0 and 5 for σdisp and between −50 and 50 for xadap. The interval from which the values of Tbreadth are drawn depends on whether the thermal optimum is evolvable or not. In the former case, the interval is [0–0.5], whereas in the latter case it is [0–6] when a equals 1 or 5 or [0–2] when a equals 10.
Static environment
During the first 1000 generations of each simulation, the climate window is fixed along the first 100 columns of the x-axis to reach a state of equilibrium in the evolving traits.
Range shifting
When range shifting is initiated, local temperatures increase and the optimum starts to move at a constant speed (1.3 columns per generation) along the x-axis.
Determining evolution
In all simulations, 10,000 individuals were randomly sampled per replicate just before the global optimum starts to move, and again 1000 generations later. The timing at which equilibrium is reached in the evolving traits at the leading edge was visually identified (see Figures and ). Of the sampled individuals, the values of the genes encoding the traits under selection were determined. For all figures represented in the next section five replicas are used, which is justified considering the low degree of variation between replicates (see Figures and ). Moreover, in order to efficiently use computing power and given our pilot analyses demonstrating low levels of variability among replicates, we performed extensive sensitivity analyses to gain insights on the generality of our results. Generality was confirmed (see Supplementary material) since all sensitivity analyses yielded the same qualitative results. To be complete, the course of evolution was investigated from the moment range shifting starts for the back, middle and front of the population. To achieve this, the mean values for Tbreadth and σdisp were determined within five columns at the back, middle and front of the climate window for each time step using five replicates. The thermal optimum was either fixed or static and a always equalled 1.
Sensitivity analyses
gives an overview of all parameters and their definition, their fixed value in the final figures and extra tested values as part of the sensitivity analyses. The parameters of which the effect was tested on evolution were the following: mutation rate, carrying capacity (N*), speed of range shifting (cws) and mean number of offspring per individual (λ). As there is no exact reason to put the competition event before the displacement-of-the-optimum event in the life cycle or vice versa, we also ran simulations in which the order of both was switched. For all figures shown in the Supplementary material, two replicas were used. Also, as there is no general consensus on the shape of a TPC in nature, we used two additional functions to describe this TPC (see Supplementary material part 2). Finally, the effect of landscape type on the course of evolution was also examined (see Supplementary material part 1).
Table 1. Overview and definition of all parameters.
Results
Our results highlight that the inclusion of other evolvable traits (here thermal optimum and thermal breadth) might be critical for studying the evolution of dispersal during range shifting.
Part I: evolution of thermal breadth and dispersal
In a static environment, individuals with the narrowest thermal breadth occur near the global optimum, independent of the strength of the trade-off (). With increasing distance from the static global optimum, individuals develop a higher dispersal capacity and wider thermal breadth (). As expected, the maximum thermal breadth within a population decreases with increasing strength (a) of the competition-thermal breadth trade-off ().
When inducing range shifting, the level of dispersal is globally increased within the population (). As can be inferred from , this occurs initially at equal speeds for the back, middle and front of the population. However, after less than 200 generations of range shifting, the increase in dispersal ability levels off near the front whereas it still increases in the middle and back of the population (). Surprisingly, the least dispersive individuals having the widest thermal breadth dominate at the leading edge (). Depending on the applied TPC function, the thermal breadth of these individuals is equally wide or even wider than the thermal breadth of the individuals at the back of the population and their dispersal ability is equally low or lower than individuals near the centre (see Supplementary material part 2).
The individuals at the front differ genetically from the rest of the population in dispersal ability (Figures and ). Dependent on the TPC function, this is also true for thermal breadth especially when the strength of the trade-off is weak (a = 1) ( and Supplementary material part 2). Overall, this results in the coexistence of two different genotypes just behind or at a larger distance from the leading edge ( and Supplementary material part 2), which has been observed within each replicate.
Individuals with the narrowest thermal breadths occur near the optimum. Also, these individuals are less dispersive than the rest of the population except for those from the leading edge (Figures and ). The increase in thermal breadth with increasing distance to the global optimum is clearly maintained during range shifting (). As within a stationary range, the maximum thermal breadth observed within a population decreases with elevated strength of the performance – thermal breadth trade-off (). When the speed of range shifting is increased, dispersal within the entire range elevates as well (Supplementary material part 2: figures S2.7, S2.16 and S2.23). Further, no qualitative changes of the main results are observed within the sensitivity analyses (Supplementary material part 2).
Part II: evolution of thermal breadth, dispersal and thermal optimum
When the environment is static, the thermal breadth and dispersal capacity are overall low within the population (). The mean level of thermal breadth decreases with increasing strength of the performance-thermal breadth trade-off (). As shown in figure S2.27 (Supplementary material part 2), an individual's local thermal optimum coincides almost completely with its own location. As expected, this relationship is more accurate with increasing strength of the performance-thermal breadth trade-off (Supplementary material part 2: figure S2.27). This pattern is highly consistent among the five replicated runs ().
When range shifting is induced, both the mean thermal breadth and dispersal capacity increase within the population (). However, when the strength of the performance-thermal breadth trade-off is weak (or other conditions: see Supplementary material part 2), individuals at the leading edge are observed to have a narrower thermal breadth than the rest of the population (). Dispersal is always homogeneously distributed throughout the range (Figures and ). As within the previous part, dispersal elevates within the entire range when the speed of range shifting is increased (Supplementary material part 2: figures S2.30, S2.39 and S2.48). Further, the deviation of an individual's position to the location of its local thermal optimum is larger during range shifting than within a static range (Supplementary material part 2: figure S2.27).
Discussion
As the TPC is repeatedly cited as a critical evolvable trait under global warming [Citation2,Citation3,Citation18,Citation30,Citation32,Citation45,Citation57], it is surprising that no clear predictions exist so far of its evolution during range shifting. Especially, since its joint evolution with dispersal might induce a strong genetic load [Citation1]. So far, theory demonstrated evolution of dispersal retrieved a positive selection at the leading edge during range shifting [Citation10,Citation27]. The underlying mechanism may either be natural or spatial selection [Citation51,Citation58]. Intrinsic trade-offs are known to affect these eco-evolutionary dynamics [Citation14]. Here we show that considering the joint evolution with traits related to local performance is equally important.
Within our study, we considered the evolution of thermal breadth and thermal optimum to be independent. This is realistic as both result from different processes [Citation4]. A broadening of the thermal breadth might be caused by the duplication of particular genes, resulting in paralogous isozymes [Citation54]. Instead, the optimum temperature can change due to an alteration within the structure of an enzyme resulting in orthologous allozymes [Citation52]. As such, the performance function (TPC) will shift along the temperature axis.
Although the thermal optimum evolves independently from the thermal breadth, this is not the case for the maximum performance at this optimum. Maximum performance and thermal breadth have been known to be negatively correlated, being referred to as the ‘jack-of-all-trades is a master of none’ hypothesis [Citation24]. Since the exact cost for a broadening of thermal breadth on maximum performance is hardly quantifiable [Citation34], we included an extra parameter (a) allowing for the relaxation of this trade-off.
Part I: Evolution of thermal breadth and dispersal
As expected, in a static range when only thermal breadth and dispersal are evolvable, the individuals with the narrowest thermal breadth occur near the global optimum. These are also less dispersive than the individuals with the widest thermal breaths occurring near the edge. Logically, this follows from the fact that individuals with narrower thermal breadths experience an extra selection force against dispersal [Citation39,Citation48,Citation59]. These results also support the statement that the realized niche of a genotype might not always represent its fundamental niche, which is especially true for the individuals near the range margin [Citation5].
Initially after the onset of range shifting, dispersal increases due to spatial sorting and natural selection [Citation51,Citation58]. However, after less than 200 generations it is clear that both individuals at the leading edge and individuals near the optimum experience a weaker selection for dispersal than the rest of the population. As a result, dispersal ability is always higher at the trailing edge than the leading edge during range shifting. This result contrasts with earlier work studying the evolution of dispersal during range shifting [Citation10,Citation27]. Although the evolution of dispersal has proven to interact with local adaptation in order to minimize gene swamping [Citation22,Citation38,Citation39,Citation48], this evolutionary feedback was ignored so far when studying dynamics during range shifting [Citation10,Citation27]. By ignoring such joint evolutionary dynamics, all individuals are equally adapted to the conditions at the front and the only factor which results in an important competitive advantage is being the first to colonize the newly available habitat at the front [Citation10,Citation27]. This is achieved by having a higher dispersal rate or further dispersal distance than your neighbours. This strategy, however, might not be the most optimal one as it involves the cost of arriving outside the climate window (i.e. in habitat which is not yet suitable for reproduction or still occupied by other species), resulting in contracting (i.e. elastic) range margins when range shifting is stopped [Citation27,Citation29,Citation42]. When the evolution of a second important trait (here thermal breadth) is allowed, the most dispersive individuals will no longer prevail at the front. Instead, the favoured strategy is to be thermally adapted to the conditions at the leading edge and as such, outcompete previously settled but less adapted individuals without taking the risk of dispersing outside the climate window. As such, the elasticity of range margins will be lower when the evolution of this extra trait is included than when only dispersal is evolvable.
When the climate window continues shifting, a time lag occurs before the individuals who first colonized the newly available habitat are outcompeted by better adapted genotypes. As such, two different strategies coexist within an area just behind the leading edge representing non-equilibrium dynamics [Citation17]. Also, under some conditions, this time lag prevents individuals near the trailing edge from obtaining their locally optimal thermal breadth (see Supplementary material part 2).
Globally, a genotype occupies a broader range along the x-axis within the range shifting scenario than the static one. This is mainly due to the elevated level of dispersal during range shifting generating an increased immigration load [Citation22]. Further, none of these discussed results differed qualitatively among all implemented trade-off functions.
Part II: Evolution of thermal breadth, thermal optimum and dispersal
Before range shifting, when local adaptation of the thermal optimum is allowed, all individuals have an optimum which coincides with their location. Further, they have a very small thermal breadth in order to maximize their competitive strength at their location. In conjunction with this, their dispersal ability is also low resulting in minimal levels of gene swamping [Citation13]. With increasing strength of the performance – thermal breadth trade-off, individuals clearly develop narrower thermal breadths without becoming noticeably less dispersive.
During range shifting, temporal variability is increased favouring higher levels of niche breadth [Citation34]. As this temporal variability is experienced between rather than within generations (i.e. coarse grained variation sensu Levins [Citation43]), the TPC curve is shaped by underlying traits which are only plastic during the early stages of development but fixed during the adult stages (i.e. developmental plasticity) [Citation34,Citation37,Citation64]. Simultaneously, dispersal increases globally during range shifting. Still, evolution interacts with the strength of the performance-thermal breadth trade-off as dispersal and thermal breadth are respectively higher and broader when the trade-off is weak.
Remarkably, individuals at the leading edge do not evolve levels of dispersal which are higher than the rest of the population. As such, the levels of dispersal are homogeneously distributed throughout the range. Importantly, while in the previous scenario maximal adaptation to conditions at the leading edge occurred by developing the widest thermal breadths of the entire population, this is now achieved by developing the narrowest. When comparing the level of dispersal between individuals with wide and small thermal niches, the former always evolved higher levels (see Figures –). This contrast with other studies [Citation32,Citation41] which state that during climate warming generalists will lag further behind their optimum environment than specialists. These studies assume thermal breadth, however, to be fixed and not subject to local adaptation. Hence, generalists are not selected for to keep track with their optimal location. This highlights the importance of not only comparing evolution between populations with a fixed TPC but also including it as an evolvable feature.
In first instance, our result are critical for studies focussing on eco-evolutionary dynamics during range shifting. For obvious reasons, our results cannot be extended to studies studying range expansion or invasion dynamics.
In order for our results to be applicable to real populations, several conditions should be met. First, variation within thermal performance should exist. This has been supported at different levels of organization (e.g. [Citation15,Citation36,Citation65]). Secondly, all features of a TPC should be evolvable in response to natural selection. As outlined above, this is the case for thermal breadth and optimum. Although lower thermal limits of terrestrial ectoderms, endotherms and plants are observed to decline at a greater rate towards the poles than upper thermal limits [Citation60], this does not necessarily imply that the latter are less evolvable than the former [Citation5]. Especially, since the upper thermal limits of marine ectothermic species have been observed to decrease with latitude at a higher speed than terrestrial species [Citation60]. This observation is due to the absence of microhabitats in marine ecosystems which allow escape to high temperatures [Citation60]. Additionally, the mean summer temperatures in the sea decline with latitude at a greater rate than on the land strengthening the force of selection [Citation19,Citation60]. Finally, another prerequisite for our study is that evolution within TPC occurs fast enough to be relevant within the context of climate warming. This also has been supported by several studies [Citation8,Citation35].
Conclusion
Our results highlight that the inclusion of other evolvable traits (here thermal optimum and thermal breadth) might be critical for studying the evolution of dispersal during range shifting. Under conditions where only the thermal breadth and dispersal are evolvable, maximal adaptation at the shifting front occurs by developing the widest thermal breadth. Instead, when the thermal optimum is also evolvable, individuals near the front have the narrowest thermal breadths and a thermal optimum which coincides with their own location. By being thermally adapted to the conditions at the front, individuals are allowed to develop lower rates of dispersal at the shifting range front than expected based on previous studies. This strategy is beneficial as it reduces an individual's risk of ending up in habitat that is not yet suitable for reproduction or still occupied by other species.
Disclosure statement
No potential conflict of interest was reported by the authors.
Supplemental data
Supplemental data for this article can be accessed 10.1080/17513758.2015.1078503.
Availability of supporting data
The source code of this study is available at https://github.ugent.be/jrhillae/evolution_dispersal_TPC.
ORCID
D. Bonte http://orcid.org/0000-0002-3320-7505
Supplementary_material_part_1_.docx
Download MS Word (5.5 MB)Supplementary_material_part_2_.docx
Download MS Word (47 MB)Additional information
Funding
References
- A.L. Angert, S.N. Sheth, and J.R. Paul, Incorporating population-level variation in thermal performance into predictions of geographic range shifts, Integr. Compar. Biol. 51(5) (2011), pp. 733–750. doi: 10.1093/icb/icr048
- M.J. Angilletta, Thermal Adaptation: A Theoretical and Empirical Synthesis, Oxford University Press, Oxford, 2009.
- M.J. Angilletta, R.B. Huey, and M.R. Frazier, Thermodynamic effects on organismal performance: Is hotter better? Physiol. Biochem. Zool. 83(2) (2010), pp. 197–206. doi: 10.1086/648567
- M.J. Angilletta, R.S. Wilson, C.A. Navas, and R.S. James, Tradeoffs and the evolution of thermal reaction norms, Trends Ecol. Evol. 18(5) (2003), pp. 234–240. doi: 10.1016/S0169-5347(03)00087-9
- M.B. Araujo, F. Ferri-Yanez, F. Bozinovic, P.A. Marquet, F. Valladares, and S.L. Chown, Heat freezes niche evolution, Ecol. Lett. 16(9) (2013), pp. 1206–1219. doi: 10.1111/ele.12155
- K.E. Atkins and J.M.J. Travis, Local adaptation and the evolution of species’ ranges under climate change, J. Theor. Biol. 266(3) (2010), pp. 449–457. doi: 10.1016/j.jtbi.2010.07.014
- J.R. Auld, A.A. Agrawal, and R.A. Relyea, Re-evaluating the costs and limits of adaptive phenotypic plasticity, Proc. R Soc. Lond. B Biol. Sci. 277 (2009), pp. 503–511. doi: 10.1098/rspb.2009.1355
- R.D.H. Barrett, A. Paccard, T.M. Healy, S. Bergek, P.M. Schulte, D. Schluter, and S.M. Rogers, Rapid evolution of cold tolerance in stickleback, Proc. R Soc. Lond. B Biol. Sci. 278(1703) (2011), pp. 233–238. doi: 10.1098/rspb.2010.0923
- A.F. Bennett and R.E. Lenski, Evolutionary adaptation to temperature .2. Thermal niches of experimental lines of Escherichia-Coli, Evolution. 47(1) (1993), pp. 1–12. doi: 10.2307/2410113
- J. Boeye, J.M.J. Travis, R. Stoks, and D. Bonte, More rapid climate change promotes evolutionary rescue through selection for increased dispersal distance, Evol. Appl. 6(2) (2013), pp. 353–364. doi: 10.1111/eva.12004
- D. Bonte, T. Hovestadt, and H.J. Poethke, Evolution of dispersal polymorphism and local adaptation of dispersal distance in spatially structured landscapes, Oikos. 119(3) (2010), pp. 560–566. doi: 10.1111/j.1600-0706.2009.17943.x
- D. Bonte, J. Vanden Borre, L. Lens, and J.-P. Mealfait, Geographical variation in wolf spider dispersal behaviour is related to landscape structure, Anim. Behav. 72(3) (2006), pp. 655–662. doi: 10.1016/j.anbehav.2005.11.026
- J.R. Bridle and T.H. Vines, Limits to evolution at range margins: When and why does adaptation fail? Trends Ecol. Evol. 22(3) (2007), pp. 140–147. doi: 10.1016/j.tree.2006.11.002
- O.J. Burton, B.L. Phillips, and M.J. Travis, Trade-offs and the evolution of life-histories during range expansion, Ecol. Lett. 13(10) (2010), pp. 1210–1220. doi: 10.1111/j.1461-0248.2010.01505.x
- L.E. Castaneda, M.A. Lardies, and F. Bozinovic, Adaptive latitudinal shifts in the thermal physiology of a terrestrial isopod, Evol. Ecol. Res. 6(4) (2004), pp. 579–593.
- T. Chaianunporn and T. Hovestadt, Concurrent evolution of random dispersal and habitat niche width in host-parasitoid systems, Ecol. Modell. 247 (2012), pp. 241–250. doi: 10.1016/j.ecolmodel.2012.09.005
- P.L. Chesson and T.J. Case, Overview: Nonequilibrium community theories: Chance, variability, history, and coexistence, in Community Ecology, J. Diamond and T. Case, eds., Harper and Row, New York, 1986, 229–239.
- L.M. Chevin and R. Lande, When do adaptive plasticity and genetic evolution prevent extinction of a density-regulated population? Evolution. 64(4) (2010), pp. 1143–1150. doi: 10.1111/j.1558-5646.2009.00875.x
- A. Clarke, Marine Macroecology, J. Witman and K. Roy, eds. The University of Chicago Press, Chicago, 2009.
- M.B. Davis, R.G. Shaw, and J.R. Etterson, Evolutionary responses to changing climate, Ecology. 86(7) (2005), pp. 1704–1714. doi: 10.1890/03-0788
- T.J. DeWitt, A. Sih, and D.S. Wilson, Costs and limits of phenotypic plasticity, Trends Ecol. Evol. 13(2) (1998), pp. 77–81. doi: 10.1016/S0169-5347(97)01274-3
- G. GarciaRamos and M. Kirkpatrick, Genetic models of adaptation and gene flow in peripheral populations, Evolution. 51(1) (1997), pp. 21–28. doi: 10.2307/2410956
- P. Gienapp, C. Teplitsky, J.S. Alho, J.A. Mills, and J. Merila, Climate change and evolution: Disentangling environmental and genetic responses, Mol. Ecol. 17(1) (2008), pp. 167–178. doi: 10.1111/j.1365-294X.2007.03413.x
- G.W. Gilchrist, A quantitative genetic analysis of thermal senitivity in the locomotor performance curve of Aphidius ervi, Evolution. 50(4) (1996), pp. 1560–1572. doi: 10.2307/2410892
- I. Hanski and M. Heino, Metapopulation-level adaptation of insect host plant preference and extinction-colonization dynamics in heterogeneous landscapes, Theor. Popul. Biol. 64(3) (2003), pp. 281–290. doi: 10.1016/S0040-5809(03)00093-5
- S.K. Heinz, R. Mazzucco, and U. Dieckmann, Speciation and the evolution of dispersal along environmental gradients, Evol. Ecol. 23(1) (2009), pp. 53–70. doi: 10.1007/s10682-008-9251-7
- R.C. Henry, G. Bocedi, and J.M.J. Travis, Eco-evolutionary dynamics of range shifts: Elastic margins and critical thresholds, J. Theor. Biol. 321 (2013), pp. 1–7. doi: 10.1016/j.jtbi.2012.12.004
- R.D. Holt, The microevolutionary consequences of climate change, Trends Ecol. Evol. 5(9) (1990), pp. 311–315. doi: 10.1016/0169-5347(90)90088-U
- R.D. Holt, On the evolutionary ecology of species’ ranges, Evol. Ecol. Res. 5(2) (2003), pp. 159–178.
- R.D. Holt, Bringing the Hutchinsonian niche into the 21st century: Ecological and evolutionary perspectives, Proc. Natl. Acad. Sci. U.S.A. 106 (2009), pp. 19659–19665. doi: 10.1073/pnas.0905137106
- R.B. Huey and P.E. Hertz, Is a jack-of-all-temperatures a master of none, Evolution. 38(2) (1984), pp. 441–444. doi: 10.2307/2408502
- R.B. Huey and J.G. Kingsolver, Evolutionary responses to extreme temperatures in ecototherms, Am. Nat. 143 (1993), pp. S21–S46. doi: 10.1086/285521
- R.B. Huey and R.D. Stevenson, Integrating thermal physiology and ecology of ectotherms–Discussion of approaches, Am. Zool. 19(1) (1979), pp. 357–366.
- R. Kassen, The experimental evolution of specialists, generalists, and the maintenance of diversity, J. Evol. Biol. 15(2) (2002), pp. 173–190. doi: 10.1046/j.1420-9101.2002.00377.x
- T. Ketola, L. Mikonranta, J. Zhang, K. Saarinen, A.M. Ormala, V.P. Friman, J. Mappes, and J. Laakso, Fluctuating temperature leads to evolution of thermal generalism and preadaptation to novel environments, Evolution. 67(10) (2013), pp. 2936–2944.
- J.G. Kingsolver, G.J. Ragland, and J.G. Shlichta, Quantitative genetics of continuous reaction norms: Thermal sensitivity of caterpillar growth rates, Evolution. 58(7) (2004), pp. 1521–1529. doi: 10.1111/j.0014-3820.2004.tb01732.x
- O. Kinne, Irreversible nongenetic adaptation, Comp. Biochem. Physiol. 5(4) (1962), pp. 265–282. doi: 10.1016/0010-406X(62)90056-7
- M. Kirkpatrick and N.H. Barton, Evolution of a species’ range, Am. Nat. 150(1) (1997), pp. 1–23. doi: 10.1086/286054
- E. Kisdi, Dispersal: Risk spreading versus local adaptation, Am. Nat. 159(6) (2002), pp. 579–596. doi: 10.1086/339989
- H. Kokko and A. Lopez-Sepulcre, From individual dispersal to species ranges: Perspectives for a changing world, Science. 313(5788) (2006), pp. 789–791. doi: 10.1126/science.1128566
- A. Kubisch, T. Degen, T. Hovestadt, and H.J. Poethke, Predicting range shifts under global change: The balance between local adaptation and dispersal, Ecography. 36(8) (2013), pp. 873–882. doi: 10.1111/j.1600-0587.2012.00062.x
- A. Kubisch, T. Hovestadt, and H.J. Poethke, On the elasticity of range limits during periods of expansion, Ecology. 91(10) (2010), pp. 3094–3099. doi: 10.1890/09-2022.1
- R. Levins, Evolution in Changing Environments, Princeton University Press, Princeton, 1968.
- M. Lynch, W. Gabriel, and A.M. Wood, Adaptive and demographic responses of plankton populations to environmental change, Limnol. Oceanogr. 36(7) (1991), pp. 1301–1312. doi: 10.4319/lo.1991.36.7.1301
- M. Lynch and R. Lande, Evolution and extinction in response to environmental change, in Biotic Interactions and Global Change, P. Kareiva, J. Kingsolver, and R. Huey, eds., Sinauer Assocs., Inc. Sunderland, MA, 1993, pp. 234–250.
- V. Nilsson-Ortman, R. Stoks, M. De Block, and F. Johansson, Generalists and specialists along a latitudinal transect: Patterns of thermal adaptation in six species of damselflies, Ecology. 93(6) (2012), pp. 1340–1352. doi: 10.1890/11-1910.1
- T. Nurmi, and K. Parvinen, Joint evolution of specialization and dispersal in structured metapopulations, J. Theor. Biol. 275(1) (2011), pp. 78–92. doi: 10.1016/j.jtbi.2011.01.023
- A. Palaima, The fitness cost of generalization: Present limitations and future possible solutions, Biol. J. Linn. Soc. 90(4) (2007), pp. 583–590. doi: 10.1111/j.1095-8312.2007.00745.x
- C.M. Pease, R. Lande, and J.J. Bull, A model of population growth, dispersal and evolution in a changing environment, Ecology. 70(6) (1989), pp. 1657–1664. doi: 10.2307/1938100
- B.L. Phillips, G.P. Brown, and R. Shine, Evolutionarily accelerated invasions: The rate of dispersal evolves upwards during the range advance of cane toads, J. Evol. Biol. 23(12) (2010), pp. 2595–2601. doi: 10.1111/j.1420-9101.2010.02118.x
- D.A. Powers and P.M. Schulte, Evolutionary adaptations of gene structure and expression in natural populations in relation to a changing environment: A multidisciplinary approach to address the million-year saga of a small fish, J. Exp. Zool. 282(1–2) (1998), pp. 71–94. doi: 10.1002/(SICI)1097-010X(199809/10)282:1/2<71::AID-JEZ11>3.0.CO;2-J
- D. Reznick, L. Nunney, and A. Tessier, Big houses, big cars, superfleas and the costs of reproduction, Trends Ecol. Evol. 15(10) (2000), pp. 421–425. doi: 10.1016/S0169-5347(00)01941-8
- K. Rungruangsak-Torrissen, G.M. Pringle, R. Moss, and D.F. Houlihan, Effects of varying rearing temperatures on expression of different trypsin isozymes, feed conversion efficiency and growth in Atlantic salmon (Salmo salar L.), Fish Physiol. Biochem. 19(3) (1998), pp. 247–255. doi: 10.1023/A:1007731717021
- J. Schaefer, Hatch success and temperature-dependent development time in two broadly distributed topminnows (Fundulidae), Naturwissenschaften. 99(7) (2012), pp. 591–595. doi: 10.1007/s00114-012-0936-y
- K. Schiffers, E.C. Bourne, S. Lavergne, W. Thuiller, and J.M.J. Travis, Limited evolutionary rescue of locally adapted populations facing climate change, Philos. Trans. R Soc. Lond. B Biol. Sci. 368(1610) (2013). doi:doi:10.1098/rstb.2012.0083.
- P.M. Schulte, T.M. Healy, and N.A. Fangue, Thermal performance curves, phenotypic plasticity, and the time scales of temperature exposure, Integr. Comp. Biol. 51(5) (2011), pp. 691–702. doi: 10.1093/icb/icr097
- R. Shine, G.P. Brown, and B.L. Phillips, An evolutionary process that assembles phenotypes through space rather than through time, Proc. Natl. Acad. Sci. U.S.A. 108(14) (2011), pp. 5708–5711. doi: 10.1073/pnas.1018989108
- S.E. Sultan and H.G. Spencer, Metapopulation structure favors plasticity over local adaptation, Am. Nat. 160(2) (2002), pp. 271–283. doi: 10.1086/341015
- J.M. Sunday, A.E. Bates, and N.K. Dulvy, Global analysis of thermal tolerance and latitude in ectotherms, Proc. R Soc. Lond. B Biol. Sci. 278(1713) (2011), pp. 1823–1830. doi: 10.1098/rspb.2010.1295
- J.M.J. Travis, M. Delgado, G. Bocedi, M. Baguette, K. Barton, D. Bonte, I. Boulangeat, J.A. Hodgson, A. Kubisch, V. Penteriani, M. Saastamoinen, V.M. Stevens, and J.M. Bullock, Dispersal and species’ responses to climate change, Oikos. 122(11) (2013), pp. 1532–1540. doi: 10.1111/j.1600-0706.2013.00399.x
- M.E. Visser, Keeping up with a warming world; assessing the rate of adaptation to climate change, Proc. R Soc. Lond. B Biol. Sci. 275 (2008), pp. 649–659. doi: 10.1098/rspb.2007.0997
- S.B. Weber, A.C. Broderick, T.G.G. Groothuis, J. Ellick, B.J. Godley, and J.D. Blount, Fine-scale thermal adaptation in a green turtle nesting population, Proc. R Soc. Lond. B Biol. Sci. 279(1731) (2012), pp. 1077–1084. doi: 10.1098/rspb.2011.1238
- D.W. Whitman and A.A. Agrawal, What is phenotypic plasticity and why is it important? in Phenotypic Plasticity of Insects: Mechanisms and Consequences, D.W. Whitman and T.N. Ananthakrishna, eds., Science, Enfield, NH, 2009, pp. 1–63.
- S.J. Willott and M. Hassall, Life-history responses of British grasshoppers (Orthoptera: Acrididae) to temperature change, Funct. Ecol. 12(2) (1998), pp. 232–241. doi: 10.1046/j.1365-2435.1998.00180.x