
 ?Mathematical formulae have been encoded as MathML and are displayed in this HTML version using MathJax in order to improve their display. Uncheck the box to turn MathJax off. This feature requires Javascript. Click on a formula to zoom.
ABSTRACT
This study focuses on the potential of treated avocado seed to remove azoic organic dyes (basic yellow 28 and tartrazine). The treated avocado seed was characterized, and batch adsorption studies were carried out to evaluate the effects of several removal dye parameters (contact time, ionic strength, initial concentration, adsorbent dose, and temperature). The adsorption kinetics of the dyes examined showed that the adsorption mechanism on the two selected catalysts followed pseudo-second-order kinetics (R2 > 0.999). The adsorption process of each dye was reported to fit using five non-linear regressions. Freundlich and Temkin adsorption isotherms described well the adsorption of basic yellow 28, and Freundlich adsorption isotherms described well the adsorption of tartrazine on the Treated Avocado Seed. The results suggested that the maximum amount adsorbed was 49.30 mg/g for basic yellow 28 and 38.43 mg/g for tartrazine and a high removal rate of 89.93% for BY 28 and 93.22% for tartrazine and that a chemical, spontaneous and endothermic process of adsorption occurred. Boyd’s expression demonstrated a mechanism of film diffusion for adsorption. Based on the findings, we suggest the application of activated avocado seeds for the removal of azoic dyes in aqueous solutions.
GRAPHICAL ABSTRACT

Highlights
TAS is an efficient adsorbent for the removal of basic yellow 28 and tartrazine from aqueous solutions.
Equilibrium data were well described by the Temkin and Freundlich isotherm model for BY 28 and the Freundlich isotherm model for Tartrazine.
The maximum uptake capacity was found to be 49, 30 mg/g for BY28 and 38.43 mg/g for Tartrazine.
1. Introduction
The textile industry generates untreated effluents that contain a wide range of organic pollutants and pose serious ecotoxicological dangers to human health. Azo dyes are important aquatic pollutants that are harmful to both ecological predators and people. Any exposure of humans and other animals, as well as oral ingestion and inhalation, can cause acute toxicity to textile dyes. It is perilous for textiles to be acutely poisonous. A few mutagenesis events and the genotoxic effects of dyes are essential to the concept of cancer. Aromatic amine disposal may cause allergic dermatitis (Citation1, Citation2).
Various industries (carpet, textile, paper, cosmetics, etc.) discharge dyes, which are detrimental to the environment, because of their aromatic structures, making them more stable and difficult to biodegrade (Citation2). Each year, about 200,000 tonnes of dyes are discharged as untreated effluent, For this reason, wastewater treatment is important. The removal of dyes in water can be achieved using physical, chemical, and biological techniques; among these, adsorption by natural adsorbents is one of the best methods (Citation3, Citation4).
In the past few decades, a variety of technologies have been used to remove dyes from wastewater, including coagulation-flocculation, sedimentation, ionexchange, membrane separation, floatation, reverse-osmosis, microbial degradation, Electrochemical technique, photocatalysis, and advanced oxidation. However, the majority of these methods have drawbacks, including high energy, high costs, low efficiency, incomplete decolorization, and the continued presence of toxic sludge (Citation5–7). The adsorption method offers a wide range of applications in the treatment of dye wastewater due to its favorable overall effects, low secondary contamination, ease of use, and preservation of the environment and economy (Citation7).
Various forestry and agricultural leftovers build up in significant quantities with no apparent use, posing an environmental threat. Therefore, it is imperative to do research that leads to the use and utilization of this waste to facilitate the decontamination of water resources impacted by improper wastewater disposal (Citation8).
The adsorption technique, including different types of adsorbents, has drawn attention since its introduction to industrial wastewater treatment. Many natural adsorbents, such as almond shell (Citation9), apricot kernel shell, argan nutshell (Citation10), jujube shell (Citation11), eggshell (Citation12), wood waste (Citation13), peanut shells (Citation14), have been analyzed for their capacity to remove dyes from wastewater.
In a study by Tsegay Hiwot (Citation15), he extracted oil and biodiesel from avocado seeds; the operation generated a large quantity of avocado seeds that could not be used. This is why we have thought of reusing this waste for the treatment of wastewater, such as the elimination of dyes by adsorption (a practical and economical method). This study therefore aims to remove the textile basic yellow28 (BY 28) cationic azo dye and the food anionic azo dye tartrazine from water using treated avocado seeds as a low cost adsorbents. Various parameters are studied, such as pH, adsorbent dose, temperature, common ions, initial concentration, and contact time. The kinetics models, isotherms models, and thermodynamics of adsorption are determined.
The second objective is to enrich scientific research in the field of water treatment and to establish the relationship between the structural parameters of the TAS and its adsorption characteristics (capacity, selectivity, kinetic parameters, and isotherm) concerning the ions of the dyes and several parameters characterizing the adsorption conditions.
2. Materials and methods
2.1. Biosorbate
The chemical formulas of BY28 and tartrazine are shown in and , respectively. Some properties of the two dyes are presented in .
Figure 1. Chemical structure of BY 28.
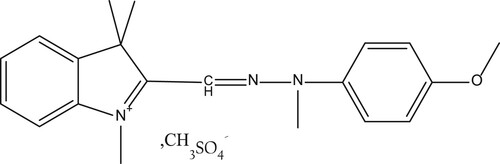
Figure 2. Chemical structure of Tartrazine.
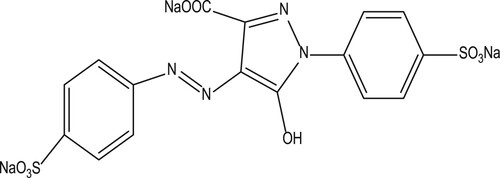
Table 1. Properties of BY 28 and Tartrazine dye (Citation12, Citation16).
The two dyes employed basic yellow 28 (BY28) and tartrazine in aqueous solutions with a purity of 99% and used without additional purification, as well as Sigma-Aldrich Hexane, NaOH, NaCl, and HCL.
The stock solution of BY28 and tartrazine were prepared by dissolving a specific amount of the tow dyes powder in 1000 mL of distilled water in a volumetric flask then we made series of dilution to obtain the desired concentrations.
2.2. Preparation of the solution dye
2.2.1. Biosorbent
Seeds from avocado cultivated in Morocco were washed several times with running tap water to remove impurities stuck to the surface and with distilled water before being dried at room temperature overnight and then crushed. The mass obtained was sifted, and particles of mesh size < 100 µm were taken. The oil was extracted from fine avocado seeds using a Soxhlet extractor, using hexane as the solvent. The system was heated to 68°C (the boiling point of hexane) for eight cycles. After extraction, the oil and hexane were collected in a separate beaker and the powder obtained was filtered, washed with distilled water, and dried at 70°C for 12 hours, then ground and sieved to a particle size of < 100 µm. The sample obtained was called treated avocado seed (TAS).
2.3. Characterization of the samples
The adsorption efficiency of the materials is strongly affected by their physical and chemical properties. The physical characteristics of the prepared adsorbent, the TAS, were determined using X-ray fluorescence (XRF) analysis to identify elemental composition and mass concentrations. To determine the functional groups that exist in the TAS, Fourier transform infrared (FTIR) spectroscopy was carried out in the 500–4,000 cm−1 region using an FTIR IRAffinity-1S model (Shimadzu). The Brunauer-Emmett – Teller (BET) method was applied to measure surface area, and SEM was performed to study surface morphology. XRD was conducted to determine the structure within the sample using the Thermo Scientific Quattro ESEM, and XRD pattern recording was performed using an X-ray diffractometer.
2.4. pHZPC
The pH zero charge point of the TAS was measured using the salt addition technique, as described by Muhammad (Citation17) Of the TAS, 100 mg was added to 100 ml of NaCl 0.01M. The pH of the sample suspension was regulated to 2–12 by adding HCl 0.1N or NaOH 0.1N. The final pH of each mixed suspension was registered after 12 h of equilibration at 25°C using a pH meter. The pHPZC of the TAS was determined by tracing the final pH as a function of the initial pH.
2.5. Adsorption mechanism
Several parameters were studied using the batch adsorption technique to evaluate their effects on the mechanism of BY28 and tartrazine adsorption in the TAS (initial concentration, ionic strength, pH, temperature, contact time, and adsorbent mass). Thermodynamics and the kinetics of the adsorption (pseudo-first order, pseudo-second order, and interparticle diffusion). The adsorption isotherm model of this study was compared with various adsorption isotherms, such as Langmuir, Temkin, Freundlich, and Dubinin Radushkevich.
Adsorption was carried out in an aqueous solution in a discontinuous system. For BY 28, this was done by suspending a series of 0.75 mg TAS in 100 mL aqueous solution with a different dye concentration. The pH of the solution varied from 2 to12, the mass of the adsorbent from 25 to 150 mg/L, the initial color concentration from 10 to 60 mg/L, and the temperature from 20°C to 50°C. For tartrazine, this was done by suspending a series of 200 mg/L TAS in 100 ml of a sample of the different dye concentrations from 10 to 60 mg/L. The weight was from 100 to 300 mg/L, the temperature ranged from 20°C to 50°C, and the pH varied from 2 to 5.
The contact time of the two dyes varied from 1 to 60 min, with a uniform agitation speed of 400 rpm; the liquid and the adsorbent were then separated by centrifugation (at 12,000 rpm for 10 min). The concentration of the final dye in the liquid phase was determined using a UV-Vis spectrophotometer (JENWAY 6715) at a wavelength of maximum absorbance λmax of 437 nm for BY 28 and 427 nm for tartrazine.
The adsorption quantity qt (mg/g) adsorbed on the TAS at equilibrium was determined using Equation (1):
(1)
(1) Where C0 and Ct (mg/L) are the dye concentrations at the starting time and any instant t in the solution, respectively; V (L) is the volume of the solution; and W (g) is the TAS weight.
The efficiency of dye removal can also be expressed by Equation (2):
(2)
(2) where C0 and Ct are the initial concentrations at time t.
2.6. Biosorption kinetics
To investigate the adsorption mechanism, several kinetics models were used to examine and obtain information about the mass transfer, chemical reaction, and diffusion control (Citation18). Three models were utilized for this purpose: the pseudo-first-order, pseudo-second-order, and intraparticle diffusion models. The simplified forms of these equations were used to determine the mechanisms of BY 28 and tartrazine in the TAS.
The pseudo-first-order model is given by the following relation (Citation19)
(3)
(3) The linear form is
(4)
(4) The pseudo-second-order model is as follows (Citation20):
(5)
(5) The simplified form is
(6)
(6) where qe (mg/g) and qt (mg/g) are the adsorbed masses at the time of equilibrium and time t (min), respectively, and k1 (min−1) and k2 (g/mg.min) are the adsorption speed constants of the pseudo-first - and second-order models, respectively.
The intraparticle diffusion model (Citation21) is based on the Weber–Morris theory in 1962. It is a simple model that provides the precise mechanics of this flow in three stages: (a) the diffusion of coloring agents through the solution to the outside of the adsorbent’s surface, (b) the adsorption or intraparticle diffusion, and (c) the final equilibrium phase, in which intra-particle diffusion has begun to slow down because of the very low concentration remaining in the liquid. The model is identified by tracing Qt as a function of t0.5 according to the following expression (Citation22):
(7)
(7) Where Kp (mg/g.min1/2) is the intra-particle diffusion speed constant, and C (mg/g) is the intercept of the straight line, which is related to the thickness of the border layer.
It has been suggested that if the model graph provides a linear fit, the adsorption mechanism is governed solely by intraparticle diffusion. On the contrary, if the linear fit gives multiline curves, more steps affect the adsorption mechanism (Citation13).
2.7. Boyd’s model
In a previous study (Citation23) Boyd’s equation was used to determine the speed control stage of an adsorbent. The equation is expressed as follows:
For F values > 0.85.
(8)
(8) And for F values < 0.85
(9)
(9) where F represents the fraction of solute adsorbed at any time (t), as calculated using the equation
(10)
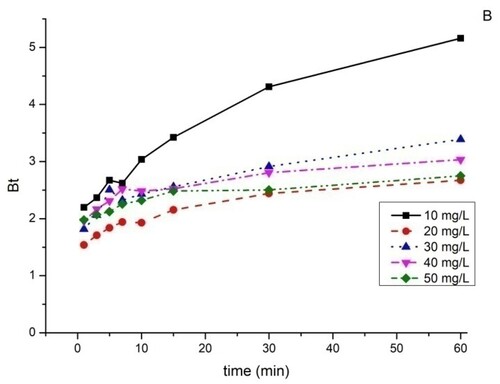
(10) If Bt as a function of (t) is a linear line and passes through the origin, pore diffusion controls the rate of mass transfer. If the curve is nonlinear or linear but does not pass through the origin, pore diffusion or external mass transport will be the dominant factor.
2.8. Biosorption isotherm models
Isotherms are mathematical models that characterize the equilibrium relation between the adsorbate and the adsorbent. The concentration of the solution and the weight adsorbed in the solid phase at a constant temperature are very effective in optimizing adsorbents. Several forms have been described in the literature (Citation24).
We applied the models of the Langmuir isotherm to the adsorption mechanism, which takes place on homogeneous surfaces and indicates the homogeneity of the surface and the repartition of site activities and their energies () (Citation25, Citation26). The Freundlich isotherm concerns adsorption phenomena that occur on heterogeneous surfaces and proposes a formula that defines surface heterogeneity and the repartition of the activated sites and their energies. Temkin’s isothermal model facilitates the effects of indirect exchanges between the adsorbent and the adsorbate on the adsorption phenomenon and considers that the heat of adsorption decreases proportionally to the increase in the surface occupied by the molecules (Citation27, Citation28). The Dubinin–Radushkevich isotherm is an adsorption model used to describe the phenomenon of adsorption with a Gaussian distribution of energy on in homogeneous surfaces (Citation29, Citation30).
Table 2. Expressions of these isothermal models.
2.9. Biosorption thermodynamics
Thermodynamic analysis of the adsorption phenomenon aims to determine the spontaneity of the mechanism from the variation in the Gibbs free energy ΔG. In addition to energy and entropy parameters, the enthalpy variation ΔH and the entropy variation ΔS must be considered to determine ΔG. The reactions occur spontaneously if ΔG is negative, taking into account the equilibrium of adsorption (Citation31).
(15)
(15) The value of the equilibrium constant was used to evaluate the thermodynamic factors. The relation between the free energy variation and the value of the equilibrium constant was provided by the following formula:
(16)
(16) Kd is the adsorption distribution coefficient defined as follows:
(17)
(17) Where R is the gas constant (8.314 J/mol.K), T (K) is the absolute temperature, qe (mg/g) is the weight of the adsorbed dye, Ce (mg/L) is the equilibrium concentration, and Kd is the distribution coefficient.
ΔS and ΔH were obtained from a plot of ln (Kd) versus 1/T.ΔG, which was determined from Formula (15).
3. Results and discussion
3.1. TAS characterization
X-ray fluorescence spectrometry was used to estimate the chemical composition of the adsorbent (TAS), and the results are shown in . The XRF analysis of the TAS shows a low yield of silicon dioxide, which is 2.033%. Potassium oxide is present at a high level of 36.5%. Among the elements, calcium oxide accounts for the largest proportion at 21%. Phosphorus pentoxide and sulfur trioxide are detected at significant values of 15.22% and 11.9%, respectively. ferric oxide is detected at 10.38%. Other elements are detected at low levels in the samples.
Table 3. X-ray Fluorescence of TAS.
Volumetry of nitrogen adsorption was conducted using the Brunauer–Emmett–Teller (BET) method, which is one of the most commonly used techniques to determine the specific surface. This approach involves adsorbing on a surface previously activated by thermal treatment (60°C in our analysis). The analysis shows that the TAS has a very low specific surface of about 3,000cm²/g.
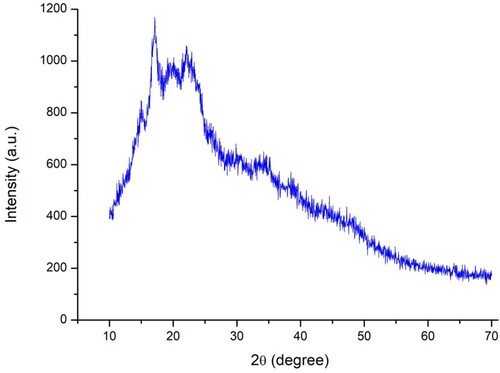
The XRD results of the matrix present unresolved peaks (), indicating the dominance of amorphous material.
Figure 3. Powder XRD Pattern of the TAS.
The FTIR spectra (4000–500 cm−1) of the TAS using the KBr pressed disc technique (a) before and after the adsorption of tartrazine (b) and BY 28 (c) are depicted in . It shows the main IR bands corresponding to the vibrations of the different clusters. The spectrum shows a broad band in the 3300–3500 cm−1 zone, which is attributed to the stretching vibrations of the hydroxyl OH groups. The band at 2910 cm−1 generally characterizes aliphatic C–H stretching vibrations (Citation32). The 1640 cm−1 band represents the flexure of the O-H of the water adsorbed (Citation33). The 1520 and 1440 cm−1 bands are assigned to the binding vibrations of the aromatic cycle (Citation34), and the 1422 and 1370 cm−1 bands are related to the C–H bond bending vibrations present in lignin and cellulose (Citation35). The band at 1155 cm−1 is attributed to the asymmetric stretch of the C–O-C bonds of cellulose. The band at 1080 cm−1 is caused by the elongation of the C–O bond (Citation36), and the band at 1020 cm−1 is related to the lengthening of the C–O bond in cellulose (Citation37).
Figure 4. FT-IR spectra of TAS (a), TAS-Tartrazine (b), and TAS-BY 28 (c).
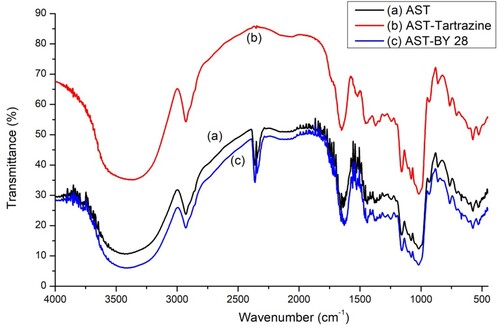
The FTIR analysis of avocado seeds treated after BY 28 and tartrazine adsorption shows that the structure of the TAS material has changed. The major bands are still present, indicating that there has been no breaking or bonding in the material, except for the difference in transmittance values.
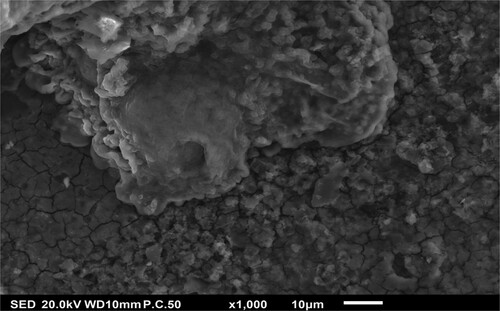
The surface morphology of the TAS is illustrated in , which shows that the material is composed of tiny particles of different sizes. This can facilitate the adsorption of micropollutants because of the irregular surface of the TAS, which makes it possible for dyes to be adsorbed on various parts of the TAS. It can therefore be concluded that this material has a suitable morphological profile to adsorb pollutants.
Figure 5. Scanning Electron Microscopy of TAS.
3.2. Determination of pHZPC
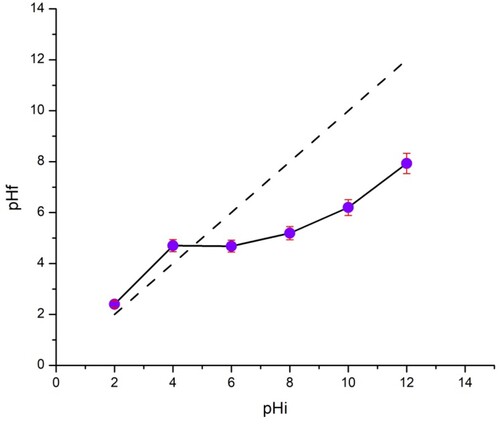
, presents the variation in pHf as a function of pHi in the adsorption test and shows that the pHzpc value is 4.7. This indicates that when the pH value is below pHzpc, the charge of the TAS surface is positive such that the attraction with cationic dye BY 28 is also positive, which means that adsorption does not take place properly. However, when the pH is higher than pHzpc, the TAS surface becomes more negatively charged, and cationic dye adsorption becomes more important.
Figure 6. Determination of pHZPC of the TAS.
3.3. Effect of initial pH
Since pH affects functioning and has the potential to limit sorption rates, it has a major impact on the process. The pH is one of the most crucial factors in the adsorption process because it can affect the properties of the metal in solution and the load on the surface of the active sites (Citation8).
As soon as the initial pH of the solution becomes high, the adsorbed amount of BY 28 increases from 9.19 mg/g at pH2 to 25.30 mg/g at pH 10, as shown in . According to basic condition favorability, the BY 28 dye solution has a lot of negatively charged hydroxyl groups in the solid–liquid phase, and the adsorbent's surface is primarily positively charged, which results in strong electrostatic attraction. On the other hand, when the pH drops, more hydrogen ions leak into the liquid phase, competing with the cationic dye for adsorbent sites and reducing the removal effectiveness. This explains why the retention rate of the dye increases with the pH, and adsorption is favorable in the basic medium because of the cationic dye form.
Figure 7. Effect of initial pH on BY 28 and tartrazine adsorption.
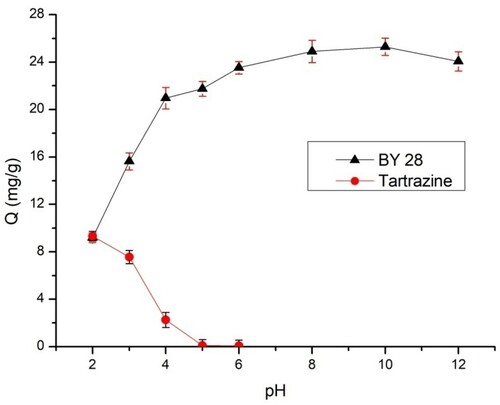
For tartrazine, when the pH increases, the adsorbed quantity of tartrazine decreases, which is zero at pH 5. Tartrazine’s maximum adsorption is achieved at pH 2. Comparable results have been reported by Sahnoun et al (Citation16). The pKa values of different attractant groups representing the tartrazine molecule are 2.0, 5.0, and 10.86 (Citation38). Therefore, for a pH > pKa solution, the molecules of tartrazine are in an anionic state, and for a pH < pKa solution, the molecules of tartrazine are in a cationic state (Citation39). The TAS pHZPC is close to 4.7. The surface is charged positively at pH < pHzpc and favors the adsorption of tartrazine, whereas the surface is charged negatively at pH > pHzpc.
The TAS has positively charged sites at pH 2. Consequently, adsorption occurs between the positively charged surface and the anion form of the dye. As the pH value increases, the number of negative sites also increases, and the surface is negatively charged. As a result, the repellency of the anionic dye with negative charges may be favored; therefore, the adsorption capacity decreases with the increasing pH of the tartrazine solutions, and from pH > 5, tartrazine does not adsorb on the TAS ().
3.4. Effect of adsorbent dosage
The weight of the adsorbent is a highly important factor that affects adsorption capacity and efficiency. The evolution of the adsorbed amounts of BY 28 and tartrazine by different masses is shown in and , respectively. The figures depict that equilibrium is reached within the first few minutes and that adsorption efficiency is increased by increasing the mass of the adsorbent. These results also show that the maximum amount adsorbed has 97% efficiency for BY 28 and tartrazine.
Figure 8. Dose effect of biosorbent on BY 28 removal by TAS.
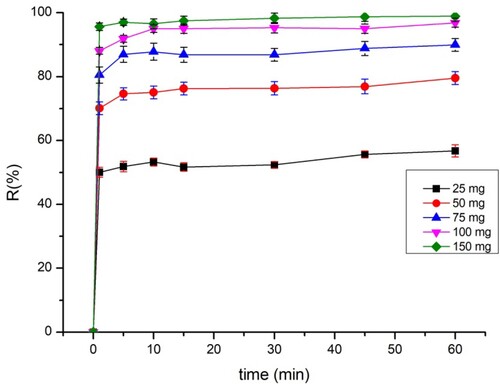
Figure 9. Dose effect of biosorbent on Tartrazine removal by TAS.
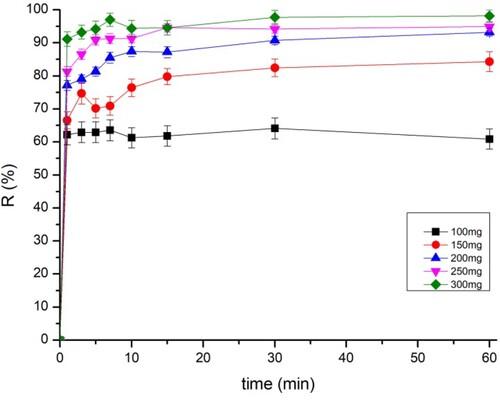
The increase in adsorption efficiency is dependent on the number of adsorption sites resulting from the increase in the adsorbent’s weight. As the adsorbent’s weight increases, the total quantity of the adsorbed dye decreases as a function of the adsorbent dose. This is attributed to the overlap or aggregation of the adsorption sites as a result of the crowding of the particulate adsorbent, causing a decrease in the total surface area of the adsorbent available for the dye (Citation40).
The dose of adsorbent was maintained at 75 mg for BY 28 and 200 mg for tartrazine in all the following experiments, which was found to be the best relation between the total quantity of the adsorbed dye and the percentage of elimination.
3.5. Effect of the initial dye concentration
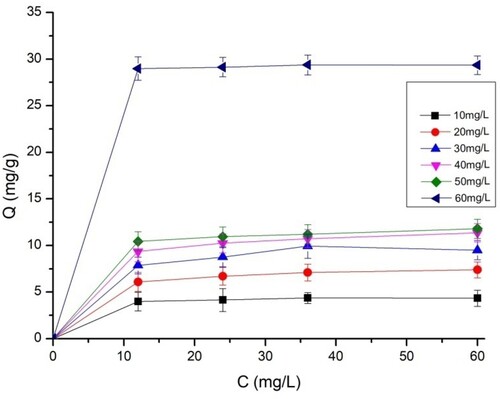
The effects of the concentration levels of BY 28 and tartrazine are shown in and , respectively. The adsorption efficiency of BY 28 increases from 12 to 60 mg/g, and that of tartrazine increases from 5 to 30 mg/g when the dye concentration varies between 10 and 60 mg/L. This shows the strong adsorption of the TAS for the removal of BY 28 and tartrazine. The adsorption capacity increases as the dye concentrations increase with two different slopes. The first one is very fast and occurs in the first moments of contact between the adsorbate and the adsorbent, while the second is very slow and can express the equilibrium of the adsorption. This mechanism may be explained by the faster diffusion of the dye molecules from the liquid to the surface of the adsorbent when the dye concentration increases (Citation41). Similarly, Slimani et al. (Citation12) found that the efficiency of BY28 adsorption when using calcined eggshells increases with increasing initial BY28 concentration levels.
Figure 10. Influence of the concentration of BY 28 dye on their removal by TAS.
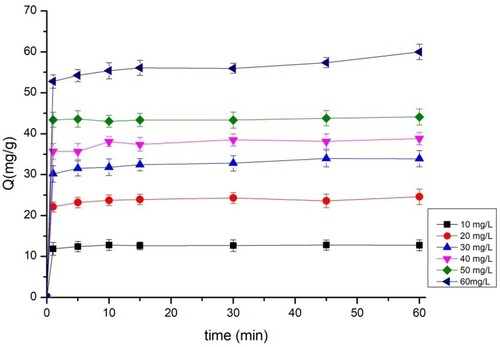
Figure 11. Influence of the concentration of Tartrazine dye on their removal by TAS.
3.6. Effect of temperature on biosorption
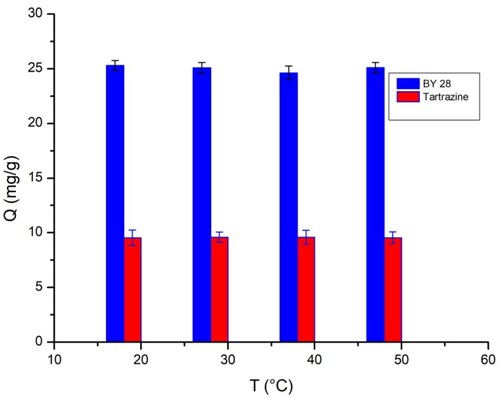
The effects of temperature on the removal of BY28 and tartrazine on the TAS were also examined. A temperature increase has no significant effect on adsorption efficiency because the adsorbed amount varies from 22 to 25 mg/g for BY 28 and from 8.5 to 9.5 mg/g for tartrazine when the temperature increases from 20°C to 50°C. As shown in , temperature does not significantly affect the adsorption mechanism.
Figure 12. Influence of temperature on BY 28 and tartrazine removal by TAS.
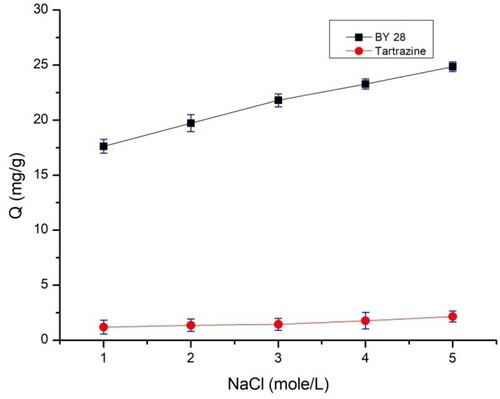
3.7. Effect of ionic strength on biosorption
As can be seen in , the adsorption of the two dyes increases with the addition of NaCl salt from 1 to 5 mol/L. The adsorption of BY 28 increases from 17.61 to 24.85 mg/g, while for tartrazine, an increase in the quantity adsorbed is observed with the augmentation of the ionic strength of the liquid from 1.3 to 2.3 mg/g. In theory, when electrostatic forces between the adsorbent surface and the adsorbed molecules are attracted, as in this case, an increase in ionic strength decreases adsorption capacity. Conversely, when the electrostatic force is repulsive, an increase in ionic strength increases adsorption efficiency (Citation42).
Figure 13. Influence of ionic strength on BY 28 and tartrazine removal by TAS.
3.8. Adsorption kinetics
The adsorption kinetic parameters of the two dyes are shown in . The closest coefficient of determination (R2) value to one was used to select the best fit (Citation43). The data show that the pseudo-first-order model ( and ) does not perfectly apply the adsorption kinetics of the two dyes on the TAS. As shown by the kinetic adsorption variables, the pseudo-second-order model has high correlation coefficient (R2) values for the removal of BY 28 () and tartrazine (), and the experimentally Qexp calculated adsorption amount values qe are equal to those calculated theoretically. This confirms that the adsorption kinetics of BY 28 and tartrazine by TAS are described correctly by the pseudo-second-order model. The pseudo-second-order kinetic model suggests the existence of chemisorption involving electrons sharing or exchange between sorbate and adsorbent, considered an adsorption rate-limiting step. The reaction rate is directly proportional to the number of active sites on the adsorbent surface. It also assumes heterogeneity of binding sites, absence of interactions between adsorbed molecules, and relatively high adsorption energy (Citation44).
Figure 14. Pseudo-first-order adsorption kinetics of BY 28 on TAS.
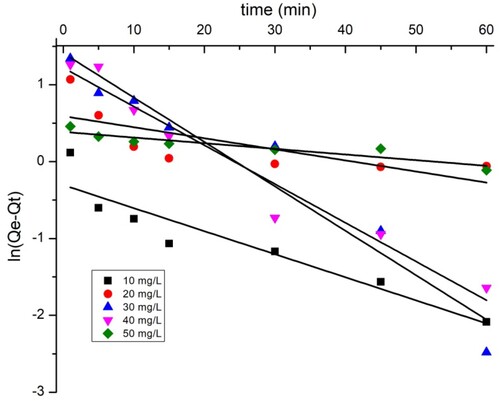
Figure 15. Pseudo-second-orderadsorption kinetics of BY 28 on TAS.
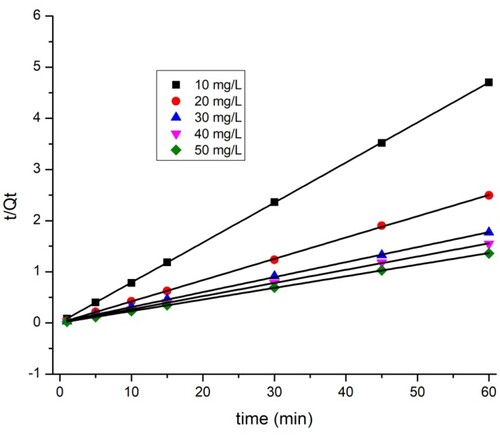
Figure 17. Pseudo-first-order adsorption kinetics of Tartrazine on TAS.
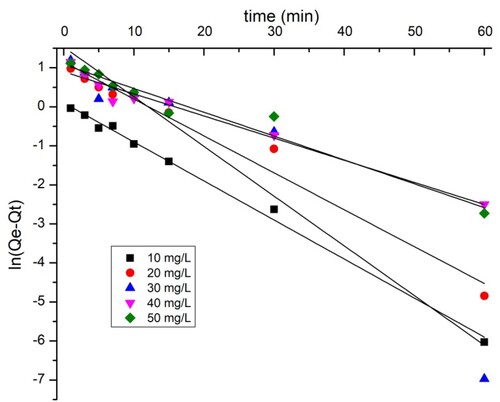
Figure 18. Pseudo-second-order adsorption kinetics of Tartrazine on TAS.
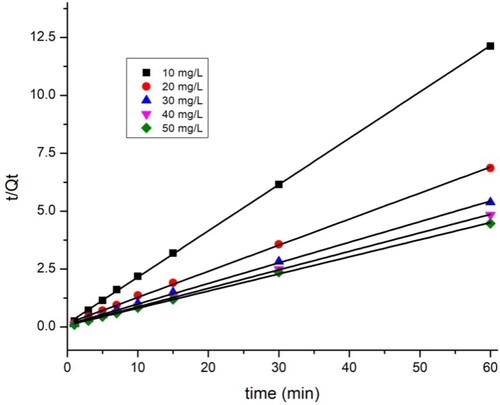
Table 4. Biosorption kinetic parameters for BY 28 and Tartrazine on TAS.
The plots of intra-particle diffusion kinetic models for the adsorption of BY 28 and tartrazine onto the TAS are shown in and , while the intraparticle diffusion constants and regression coefficients are given in . and show that there are two regions in the graphs, which means that more steps occur in adsorption. This suggests that dye adsorption on the TAS is not solely controlled by intraparticle diffusion; other adsorption mechanisms probably occur as well. Furthermore, the linear lines for the two dyes do not pass through the origin. These trends imply that the influence of boundary film thickness on dye adsorption cannot be ignored. More important factors, such as mass transfer, affect the adsorption mechanism. To confirm this result, the introduction of the Boyd model is necessary.
Figure 16. Intraparticle diffusion adsorption model of BY 28 on TAS.
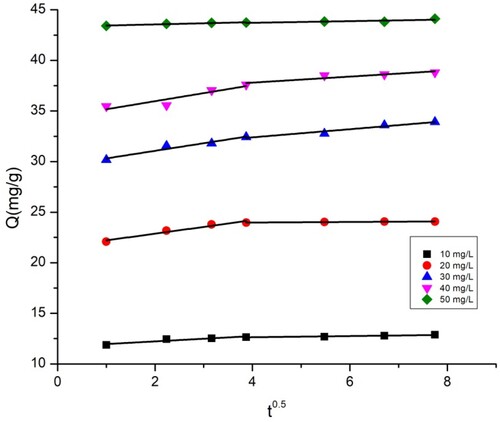
Figure 19. Intraparticle diffusion adsorption model of Tartrazine on TAS.
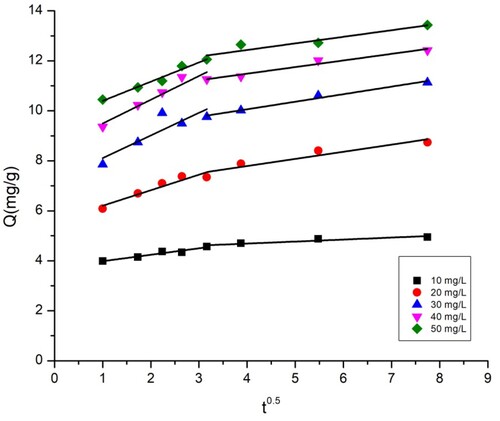
Table 5. Intraparticle diffusion model parameters for BY 28 and Tartrazine on TAS.
3.9. Boyd model
As can be seen in and , the curves are all non-linear and do not pass through the origin. From these results, we can conclude that the adsorption of BY 28 and tartrazine on the TAS is a film diffusion mechanism.
Figure 20. Boyd kinetic plot of BY 28 adsorption on the TAS.
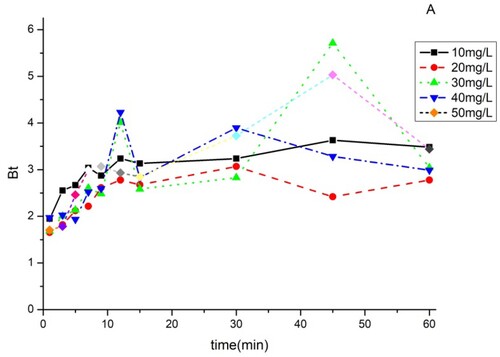
Figure 21. Boyd kinetic plot of Tartrazine adsorption on the TAS.
3.10. The adsorption isotherm
The isothermal data from this study were adjusted to four models using non-linear modeling. summarizes all the models studied and their constants. The fit curves for the four isotherms are also shown in and for BY 28 and tartrazine, respectively.
Figure 22. Plots of adsorption isotherms for the elimination of BY 28 by TAS.
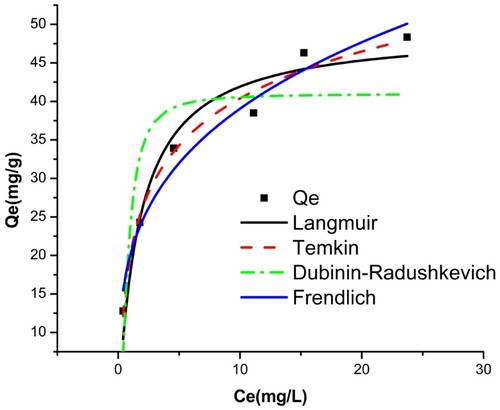
Figure 23. Plots of adsorption isotherms for the elimination of Tartrazine by TAS.
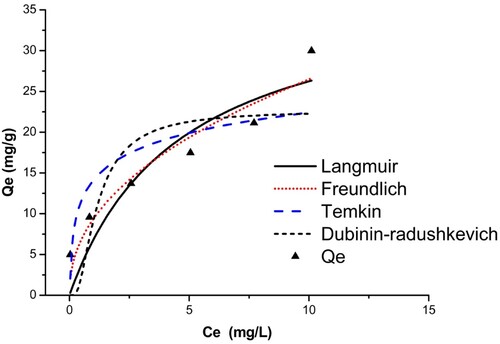
Table 6. Isotherm parameters.
Based on the correlation coefficient values R2 obtained, the Temkin (R2 > 0.981) and Freundlich (R2 > 0.964) models fit the equilibrium data better for the adsorption of BY 28. The molecules are heterogeneously adsorbed on the adsorption sites on the adsorbent surface, so there are indirect interaction effects between the adsorbate and the adsorbate. As a result, the adsorption heat of all molecules in the film linearly decreases with coverage. The maximum adsorption capacity is 49.30 mg/g.
The adsorption value of the tartrazine dye on the TAS is best described using Freundlich’s model (R2 > 0.901), which shows that tartrazine molecules adsorb on heterogeneous multilayer surfaces. The value of heterogeneity factor n = 3.47 > 1 indicates that both tartrazine is favorably adsorbed by TAS (Citation45), showing improved adsorption with the formation of high bonds between the adsorbates and the adsorbent. This indicates favorable adsorption with a maximum adsorption capacity reached 38.43 mg/g. This finding is also consistent with the results of the dye adsorption kinetics analysis, which shows that the adsorption process is chemical.
3.11. Adsorption thermodynamics
The results of Gibbs free energy change ΔG, enthalpy change ΔH, and entropy change ΔS are presented in . The negative values of ΔG from −7.07 to −9.14 kJ/mol for BY 28 and from −5.9 to −6.5 kJ/mol for tartrazine with an increase in temperature from 293 K to 323 K suggest process feasibility and the spontaneous character of adsorption and affected by temperature favorably. because higher temperatures provide greater opportunities for advantageous collisions and a more potent driving force, which enhances adsorption capacity (Citation45). The positive enthalpy change value ΔH 13.15 kJ/mol for BY 28 and 92.88 J/mol for tartrazine shows that the biosorption is endothermic (Citation46). The positive value of the entropy ΔS for BY 28 and tartrazine demonstrates the TAS's strong attraction for the adsorbent and reflects the increasing randomization at the solid/solution interface during dye adsorption on the TAS (Citation47).
Table 7. Thermodynamic parameters.
3.12. Regeneration
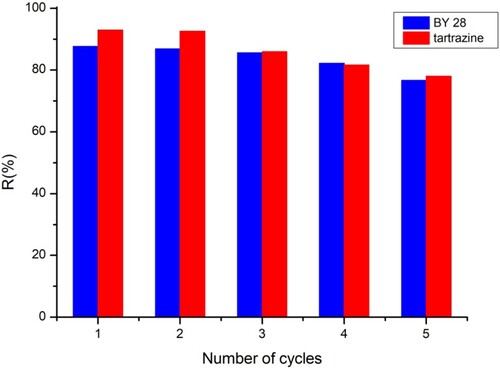
Regeneration is essential in testing the performance of adsorbents, as it allows the used adsorbent to return to its original conditions for further use and to restore its adsorption capacity. If our adsorbent could be regenerated and reused without reducing its adsorption performance of tartrazine dye and BY 28, it would be very cost-effective. To evaluate reuse in this study, a NaOH (0.1M) solution was used as the eluent to recover the tartrazine molecules and CH3COOH (1M) was used for BY 28, accumulated on the saturated adsorbent. As shown in , the adsorption yields were 76.67% for BY 28 and 78% for tartrazine after five adsorption–desorption cycles. Therefore, the TAS demonstrated satisfactory reusability. Therefore, we can state that the TAS material as developed has potential application prospects as an effective adsorbent for BY 28 and tartrazine dyes.
Figure 24. Adsorption-desorption cycles.
3.13. Comparison of adsorbents
The comparison study of the maximum adsorption capacity of some adsorbent was reported in the literature for adsorption of azo dyes as given in . The adsorption capacities of the adsorbents used in this study were not among the highest available, but the adsorption capacity of the adsorbent TAS is still significant when compared to other adsorbent.
Table 8. Maximum adsorption capacity of various azo dyes by some adsorbents.
4. Conclusion
The present study shows that the adsorption capacities of BY 28 and tartrazine on the TAS differed depending on the nature of each dye. which is significantly affected by pH, the initial ion concentration and the dose of adsorbent. The maximum uptake capacity was found to be 49, 30 mg/g at pH 10 for BY 28 and 38.43 mg/g at pH 2 for Tartrazine. In general, the dye wascrucial, as it dictated the ability of the adsorption mechanism to attach the functional groups andbreak the aromatic cycle of the dye. The adsorption of BY 28 and tartrazine on the TAS followed pseudo-second-order kinetics (R2 > 0.99), The adsorption of dyes ions on TAS was consistent with the Freundlich and Temkin isotherm adsorption model for BY 28 and a Freundlich isotherm for tartrazine. the adsorption process is feasibility, endothermic spontaneous character and the Boyd formula indicated that adsorption was a film diffusion mechanism. The TAS demonstrated a satisfactory reusability. The findings led to the conclusion that TAS had a great deal of potential for utilizing the adsorption approach to remove basic color from wastewater.
Acknowledgments
The authors gratefully acknowledge the support for this project from the This study is supported via funding from Prince sattam bin Abdulaziz University project number (PSAU/2023/R/1445) and CNRST of Morocco URAC 32.
Disclosure statement
No potential conflict of interest was reported by the author(s).
Additional information
Funding
References
- Hemashenpagam, N.; Selvajeyanthi, S. Textile Dyes and Their Effect on Human Beings. In Nanohybrid Materials for Treatment of Textiles Dyes; Ahmad, A., Jawaid, M., Mohamad Ibrahim, M.N., Yaqoob, A.A., Alshammari, M.B., Eds.; Springer Nature Singapore: Singapore, 2023; pp 41–60. doi:10.1007/978-981-99-3901-5_3.
- Kishor, R.; Purchase, D.; Saratale, G.D.; Saratale, R.G.; Ferreira, L.F.R.; Bilal, M.; Chandra, R.; Bharagava, R.N. Ecotoxicological and Health Concerns of Persistent Coloring Pollutants of Textile Industry Wastewater and Treatment Approaches for Environmental Safety. J. Environ. Chem. Eng. 2021, 9 (2), 105012. doi:10.1016/j.jece.2020.105012.
- Ahmed, S.F.; Mofijur, M.; Nuzhat, S.; Chowdhury, A.T.; Rafa, N., Uddin, M.A.;, Inayat, A.; Mahlia , T. M.I.; Ong, H.C.; Chia, W.Y.; Show, P.L. Recent Developments in Physical, Biological, Chemical, and Hybrid Treatment Techniques for Removing Emerging Contaminants from Wastewater. J. Hazard. Mater. 2021, 416, 125912. doi:10.1016/j.jhazmat.2021.125912.
- Valli Nachiyar, C.; Rakshi, A.D.; Sandhya, S.; Britlin Deva Jebasta, N.; Nellore, J. Developments in Treatment Technologies of dye-Containing Effluent: A Review. Case Stud. Chem. Environ. Eng. 2023, 7, 100339. doi:10.1016/j.cscee.2023.100339.
- Sun, Z.; Qu, K.; Cheng, Y.; You, Y.; Huang, Z.; Umar, A.; Ibrahim, Y.S.A.; Algadi, H.; Castañeda, L.; Colorado, H. A.; Guo, Z. Corncob-derived Activated Carbon for Efficiently Adsorption Dye in Sewage. ES Food Agrofor. 2021. https://doi.org/10.30919/esfaf473.
- Mandal, S.; Muralidharan, C.; Mandal, A.B. Water Pollution Remediation Techniques with Special Focus on Adsorption. In Advanced Research in Nanosciences for Water Technology: Prasad, R., Karchiyappan, T., Eds.; Nanotechnology in the Life Sciences; Springer International Publishing: Cham, 2019; pp 40–63. doi:10.1007/978-3-030-02381-2.
- Vojnović, B.; Cetina, M.; Franjković, P.; Sutlović, A. Influence of Initial pH Value on the Adsorption of Reactive Black 5 Dye on Powdered Activated Carbon: Kinetics, Mechanisms, and Thermodynamics. Molecules 2022, 27 (4), 1349. doi:10.3390/molecules27041349.
- Cruz-Lopes, L.P.; Macena, M.; Esteves, B.; Guiné, R.P.F. Ideal pH for the Adsorption of Metal Ions Cr 6+, Ni 2+, Pb 2+ in Aqueous Solution with Different Adsorbent Materials. Open Agric. 2021, 6 (1), 115–123. doi:10.1515/opag-2021-0225.
- Ait Ahsaine, H.; Zbair, M.; Anfar, Z.; Naciri, Y.; El haouti, R., El Alem, N.;, Ezahri, M. Cationic Dyes Adsorption Onto High Surface Area ‘Almond Shell’ Activated Carbon: Kinetics, Equilibrium Isotherms and Surface Statistical Modeling. Mater. Today Chem. 2018, 8, 121–132. doi:10.1016/j.mtchem.2018.03.004.
- Zbair, M.; Bottlinger, M.; Ainassaari, K.; Ojala, S.; Stein, O., Keiski, R.L., Bensitel, M.; Brahmi, R. Hydrothermal Carbonization of Argan Nut Shell: Functional Mesoporous Carbon with Excellent Performance in the Adsorption of Bisphenol A and Diuron. Waste. Biomass. Valorization. 2018, 11, 1565–1584. doi:10.1007/s12649-018-00554-0.
- El Messaoudi, N.; El Khomri, M.; Goodarzvand Chegini, Z.; Chlif, N.; Dbik, A.; Bentahar, S.; Iqbal, M.; Jada, A.; Lacherai, A. Desorption Study and Reusability of raw and H2SO4 Modified Jujube Shells (Zizyphus Lotus) for the Methylene Blue Adsorption. Int. J. Environ. Anal. Chem. 2023, 103 (16), 3762–3778. doi:10.1080/03067319.2021.1912338.
- Slimani, R.; El Ouahabi, I.; Abidi, F.; El Haddad, M.; Regti, A., Laamari, M.R., El Antri, S.; Lazar, S. Calcined Eggshells as a new Biosorbent to Remove Basic dye from Aqueous Solutions: Thermodynamics, Kinetics, Isotherms and Error Analysis. J. Taiwan Inst. Chem. Eng. 2014, 45 (4), 1578–1587. doi:10.1016/j.jtice.2013.10.009.
- Zhou, X.; Shi, L.; Moghaddam, T.B.; Chen, M.; Wu, S.; Yuan, X. Adsorption Mechanism of Polycyclic Aromatic Hydrocarbons Using Wood Waste-Derived Biochar. J. Hazard. Mater. 2022, 425, 128003. doi:10.1016/j.jhazmat.2021.128003.
- Tomul, F.; Arslan, Y.; Kabak, B.; Trak, D.; Kendüzler, E., Lima, E.C., Tran, H.N. Peanut Shells-Derived Biochars Prepared from Different Carbonization Processes: Comparison of Characterization and Mechanism of Naproxen Adsorption in Water. Sci. Total Environ. 2020, 726, 137828. doi:10.1016/j.scitotenv.2020.137828.
- Hiwot, T. Determination of oil and Biodiesel Content, Physicochemical Properties of the oil Extracted from Avocado Seed (Persea Americana) Grown in Wonago and Dilla (Gedeo Zone), Southern Ethiopia. Chem. Int. 2017, 3 (3), 311–319. doi:10.31221/osf.io/247t8.
- Sahnoun, S.; Boutahala, M.; Tiar, C.; Kahoul, A. Adsorption of Tartrazine from an Aqueous Solution by Octadecyltrimethylammonium Bromide-Modified Bentonite: Kinetics and Isotherm Modeling. C. R. Chim. 2018, 21 (3–4), 391–398. doi:10.1016/j.crci.2018.01.008.
- Muhammad, S.; Hussain, S.T.; Waseem, M.; Naeem, A.; Hussain, J.; Jan, M.T. Surface Charge Properties of Zirconium Dioxide. Iran. J. Sci. Technol. 2012, 481–486. doi:10.22099/IJSTS.2012.2110.
- Samimi, M.; Shahriari-Moghadam, M. Isolation and Identification of Delftia Lacustris Strain-MS3 as a Novel and Efficient Adsorbent for Lead Biosorption: Kinetics and Thermodynamic Studies, Optimization of Operating Variables. Biochem. Eng. J. 2021, 173, 108091. doi:10.1016/j.bej.2021.108091.
- Lagergren, S. Handlingar. Band 1898, 24 (4), 1–39.
- Ho, Y.S.; Mckay, G. The Kinetics of Sorption of Divalent Metal Ions Onto Sphagnum Moss Peat. Wat. Res 2000, 34 (3), 735–742. doi:https://doi.org/10.1016/S0043-1354(99)00232-8.
- Weber, W.J.; Morris, J.C. Kinetics of Adsorption on Carbon from Solution. J. Sanit. Eng. Div. 1963, 89 (2), 31–59. doi:10.1061/JSEDAI.0000430
- Wang, J.; Guo, X. Rethinking of the Intraparticle Diffusion Adsorption Kinetics Model: Interpretation, Solving Methods and Applications. Chemosphere 2022, 309, 136732. doi:10.1016/j.chemosphere.2022.136732.
- Fatima, S.S.; Borhan, A.; Ayoub, M.; Ghani, N.A. Modeling of CO2 Adsorption on Surface-Functionalized Rubber-Seed Shell Activated Carbon: Isotherm and Kinetic Analysis. Processes 2023, 11 (10), 2833. doi:10.3390/pr11102833.
- Al-Ghouti, M.A.; Da’ana, D.A. Guidelines for the use and Interpretation of Adsorption Isotherm Models: A Review. J. Hazard. Mater. 2020, 393, 122383. doi:10.1016/j.jhazmat.2020.122383.
- Langmuir, I. The Adsorption of Gases on Plane Surfaces of Glass, Mica and Platinum. J. Am. Chem. Soc. 1918, 40 (9), 1361–1403. doi:10.1021/ja02242a004.
- Alafnan, S.; Awotunde, A.; Glatz, G.; Adjei, S.; Alrumaih, I.; Gowida, A. Langmuir Adsorption Isotherm in Unconventional Resources: Applicability and Limitations. J. Petrol. Sci. Eng. 2021, 207, 109172. doi:10.1016/j.petrol.2021.109172.
- Temkin, M.J.; Pyzhev, V. Recent Modifications to Langmuir Isotherms. Acta Physicochim. URSS 1940, 12, 217–222.
- Rajahmundry, G.K.; Garlapati, C.; Kumar, P.S.; Alwi, R.S.; Vo,D.-V.N. Statistical Analysis of Adsorption Isotherm Models and its Appropriate Selection. Chemosphere 2021, 276, 130176. doi:10.1016/j.chemosphere.2021.130176.
- Dubinin, M.M. The Equation of the Characteristic Curve of Activated Charcoal. Dokl. Akad. Nauk. SSSR 1947, 55, 327–329.
- Ragadhita, R.; Nandiyanto, A.B.D. Curcumin Adsorption on Zinc Imidazole Framework-8 Particles: Isotherm Adsorption Using Langmuir, Freundlich, Temkin, and Dubinin-Radushkevich Models. J. Eng. Sci. Technol. 2022, 17.
- Pang, Y.L.; Tan, J.H.; Lim, S.; Chong, W.C. A State-of-the-Art Review on Biowaste Derived Chitosan Biomaterials for Biosorption of Organic Dyes: Parameter Studies, Kinetics, Isotherms and Thermodynamics. Polymers 2021, 13 (17), 3009. doi:10.3390/polym13173009.
- Kubo, S.; Kadla, J.F. Hydrogen Bonding in Lignin: A Fourier Transform Infrared Model Compound Study. Biomacromolecules 2005, 6 (5), 2815–2821. doi:10.1021/bm050288q.
- Li, X.; Wei, Y.; Xu, J.; Xu, N.; He, Y. Quantitative Visualization of Lignocellulose Components in Transverse Sections of Moso Bamboo Based on FTIR Macro- and Micro-Spectroscopy Coupled with Chemometrics. Biotechnol. Biofuels 2018, 11 (1), 1–16. doi:10.1186/s13068-018-1251-4.
- Bazzo, A.; Adebayo, M.A.; Dias, S.L.P.; Lima, E.C.; Vaghetti, J.C.P.; De Oliveira, E.R.; Anderson J.B.L.; Pavan, F. A. Avocado Seed Powder: Characterization and its Application for Crystal Violet dye Removal from Aqueous Solutions. Desalin. Water Treat. 2016, 57 (34), 15873–15888. doi:10.1080/19443994.2015.1074621.
- Sills, D.L.; Gossett, J.M. Using FTIR to Predict Saccharification from Enzymatic Hydrolysis of Alkali-Pretreated Biomasses. Biotechnol. Bioeng. 2012, 109 (2), 353–362. doi:https://doi.org/10.1002/bit.23314.
- Alencar, W.S.; Acayanka, E.; Lima, E.C.; Royer, B.; de Souza, F.E., Lameira, J., Alves, C.N. Application of Mangifera Indica (Mango) Seeds as a Biosorbent for Removal of Victazol Orange 3R dye from Aqueous Solution and Study of the Biosorption Mechanism. Chem. Eng. J. 2012, 209, 577–588. doi:10.1016/j.cej.2012.08.053.
- Da Silva, F.M.; Santana, S.A.A.; Bezerra, C.W.B.; Silva, H.A.d.S. adsorption of Textile dye Blue Remazol r by Banana (Musa sp) Pseudostem. Cadernos de Pesquisa 2011, 17 (3), 71–79.
- Klett, C.; Barry, A.; Balti, I.; Lelli, P.; Schoenstein, F.; Jouini, N. Nickel Doped Zinc Oxide as a Potential Sorbent for Decolorization of Specific Dyes, Methylorange and Tartrazine by Adsorption Process. J. Environ. Chem. Eng. 2014, 2 (2), 914–926. doi:10.1016/j.jece.2014.03.001.
- Honorine, A.T.; Daouda, A.; T, D.; Richard, D.; Guy Bertrand, N. Efficient Adsorption of Tartrazine from an Aqueous Solution Using a low-Cost Orange Peel Powder. J. Water Health 2023, 21 (8), 1017–1031. doi:10.2166/wh.2023.033.
- Yadav, B.S.; Dasgupta, S. Effect of Time, pH, and Temperature on Kinetics for Adsorption of Methyl Orange dye Into the Modified Nitrate Intercalated MgAl LDH Adsorbent. Inorg. Chem. Commun. 2022, 137, 109203. doi:10.1016/j.inoche.2022.109203.
- Benkaddour, S.; El ouahabi, I.; Hiyane, H.; Essoufy, M.; Driouich, A., El antri, S.; El Hajjaji, S.; Slimani, R.; Lazar, S. Removal of Basic Yellow 28 by Biosorption Onto Watermelon Seeds, Part I: The Principal Factors Influencing by Plackett-Burman Screening Design. Surf. Interfaces 2020, 21, 100732. doi:10.1016/j.surfin.2020.100732.
- Aranda-García, E.; Chávez-Camarillo, G.Ma.; Cristiani-Urbina, E. Effect of Ionic Strength and Coexisting Ions on the Biosorption of Divalent Nickel by the Acorn Shell of the Oak Quercus Crassipes Humb. & Bonpl. Processes 2020, 8 (10), 1229. doi:10.3390/pr8101229.
- Balarak, D.; Zafariyan, M.; Igwegbe, C.A.; Onyechi, K.K.; Ighalo, J.O. Adsorption of Acid Blue 92 Dye from Aqueous Solutions by Single-Walled Carbon Nanotubes: Isothermal, Kinetic, and Thermodynamic Studies. Environ. Processes 2021, 8 (2), 869–888. doi:10.1007/s40710-021-00505-3.
- Ho, Y.S.; McKay, G. A Comparison of Chemisorption Kinetic Models Applied to Pollutant Removal on Various Sorbents. Process Saf. Environ. Prot. 1998, 76 (4), 332–340. doi:10.1205/095758298529696.
- Bai, C.; Wang, L.; Zhu, Z. Adsorption of Cr(III) and Pb(II) by Graphene Oxide/Alginate Hydrogel Membrane: Characterization, Adsorption Kinetics, Isotherm and Thermodynamics Studies. Int. J. Biol. Macromol. 2020, 147, 898–910. doi:10.1016/j.ijbiomac.2019.09.249.
- Lacin, O.; Haghighatnia, A.; Sevim, F. Adsorption Characteristics and Behaviors of Natural Red Clay for Removal of BY28 from Aqueous Solutions. Int. J. Trend Sci. Res. Dev. 2019, 3 (2), 1037–1047. doi:10.31142/ijtsrd21544.
- Balarak, D.; Al-Musawi, T.J.; Mohammed, I.A.; Abasizadeh, H. The Eradication of Reactive Black 5 dye Liquid Wastes Using Azolla Filiculoides Aquatic Fern as a Good and an Economical Biosorption Agent. SN Appl. Sci. 2020, 2 (6), 1–11. doi:10.1007/s42452-020-2841-x.
- El Ouahabi, I.; Slimani, R.; Benkaddour, S.; Hiyane, H.; Rhallabi, N.; Cagnon, B.; El Haddad, M.; El Antri, S.; Lazar, S.. Adsorption of Textile dye from Aqueous Solution Onto a low Cost Conch Shells. J. Mater. Environ. Sci. 2018, 9 (7), 1987–1998.
- Aragaw, T.A.; Angerasa, F.T. Synthesis and Characterization of Ethiopian Kaolin for the Removal of Basic Yellow (BY 28) Dye from Aqueous Solution as a Potential Adsorbent. Heliyon 2020, 6 (9), e04975. doi:10.1016/j.heliyon.2020.e04975.
- El Kassimi, A.; Boutouil, A.; El Himri, M.; Rachid Laamari, M.; El Haddad, M. Selective and Competitive Removal of Three Basic Dyes from Single, Binary and Ternary Systems in Aqueous Solutions: A Combined Experimental and Theoretical Study. J. Saudi Chem. Soc. 2020, 24 (7), 527–544. doi:10.1016/j.jscs.2020.05.005.
- Banerjee, S.; Chattopadhyaya, M.C. Adsorption Characteristics for the Removal of a Toxic dye, Tartrazine from Aqueous Solutions by a low Cost Agricultural by-Product. Arab. J. Chem. 2017, 10, S1629–S1638. doi:10.1016/j.arabjc.2013.06.005.
- Zhang, L.; Sellaoui, L.; Franco, D.; Dotto, G.L.; Bajahzar, A., Belmabrouk, H., Bonilla-Petriciolet, A.; Oliveira, M.L.S.; Li, Z. Adsorption of Dyes Brilliant Blue, Sunset Yellow and Tartrazine from Aqueous Solution on Chitosan: Analytical Interpretation via Multilayer Statistical Physics Model. Chem. Eng. J. 2020, 382, 122952. doi:10.1016/j.cej.2019.122952.
- Cuba, R.M.F.; Paula, B.M.d.; Vale, G.B.d.; Braga, T.C.; Terán, F.J.C. Biocarvão ativado produzido a partir de lodo anaeróbio de estação de tratamento de efluentes para remoção do corante tartrazina. Matéria (Rio de Janeiro) 2022, 26, e13109. doi:10.1590/S1517-707620210004.1309.
- Ortega Toro, R.; Tejada Tovar, C.; Villabona-Ortíz, A.; Aguilar-Bermúdez, F.; Pájaro-Moreno, Y. Effective Adsorption of Tartrazine by Modified Biomaterial from Wheat Residues. Ingeniería y Competitividad 2021, 24 (1). doi:10.25100/iyc.v24i1.11139.