
ABSTRACT
Accurate quantity and distribution estimates of permafrost soil organic carbon (SOC) stocks are needed to project potential feedbacks to climate, following warming. Still, upscaling from local field observations to regional estimates to circumarctic assessments remains a challenge. Here we explore elevation-based upscaling techniques for High-Arctic permafrost SOC stocks. We combine two detailed, high-resolution SOC inventories on Spitsbergen (Svalbard) with regional validation data. We find a clear relationship between elevation and SOC content, and use this observed exponential correlation, as well as discrete elevation classes, as upscaling models for Spitsbergen. We estimate the total amount of permafrost SOC currently present in soils on Spitsbergen to be 105.36 Tg (0.11 Pg), with a mean SOC content of 2.84 ± 0.74 kg C m−2 (mean ± 95% confidence interval). Excluding glaciers and permanent snowfields, exposed land is currently estimated to contain 6.26 ± 1.47 kg C m−2.
Introduction
Organic C stored in permafrost soils plays an important role in the global terrestrial C cycle and thereby has a direct impact on global climate. Carbon remobilization in permafrost terrain caused by warming of the Arctic could lead to extensive greenhouse gas release. In response to this release, further atmospheric warming could result in more OM decomposition, and potentially lead to a positive climate feedback (Davidson & Janssens Citation2006; Schuur et al. Citation2015). Despite ongoing efforts like the NCSCD (Tarnocai et al. Citation2009; Hugelius, Bockheim et al. Citation2013; Hugelius, Tarnocai et al. Citation2013), uncertainties in permafrost SOC estimates remain high (Hugelius et al. Citation2014). One reason for this is that soil C inventories are more often carried out in low- and sub-Arctic regions (), as these regions contain most of the Arctic permafrost C (Bliss & Matveyeva Citation1992; Shaver et al. Citation1992; Howarth Burnham & Sletten Citation2010; Yoshitake et al. Citation2011; Palmtag et al. Citation2015). Like the more common soil C inventories in the low- and sub-Arctic, High-Arctic SOC inventories are usually undertaken at established field sites and research stations for logistical reasons (Johnson et al. Citation2011) and often focus on relatively C-rich environments, such as peatlands, aeolian deposits, river terraces, and other vegetated ‘oases.’ As a result, data sets do not always accurately reflect the range of landforms and landcover types in a region and tend to underrepresent bare rock, scree slopes, and recently deglaciated terrain.
Figure 1. NCSCD 0–3 m SOC content and locations, and overall extent (Hugelius, Bockheim et al. Citation2013; Hugelius, Tarnocai et al. Citation2013). Zero–1 m pedon locations are unavailable but show a similar pattern (G. Hugelius, pers. comm.). The High Arctic is based on data from the Circumpolar Arctic vegetation map (CAVM Team Citation2003).
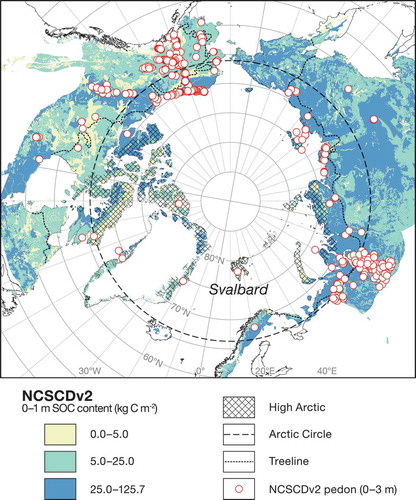
Overall, High-Arctic C storage estimates vary considerably. Some studies indicate a potential overestimation caused by local deviation from the regional mean (Palmtag et al. Citation2015), whereas others report possible underestimations in earlier work (Howarth Burnham & Sletten Citation2010). For the entire circumarctic permafrost region, previous estimates have shown drastic revisions. For example, the mean SOC content in the Svalbard Archipelago went from 38.4 kg C m−2 to 3.8 kg C m−2 between the first and second versions of the NCSCD (Tarnocai et al. Citation2009; Hugelius, Bockheim et al. Citation2013; Hugelius, Tarnocai et al. Citation2013). Other parts of the High Arctic, however, such as large parts of north-eastern Greenland and the Canadian High Arctic, are still estimated around 25 kg C m−2, and vast parts of Devon Island are currently mapped as 66.6 kg C m−2 in the top 1 m (Hugelius, Tarnocai et al. Citation2013). Despite local anomalies, the NCSCD holds great value, as it has provided considerable improvements on overall permafrost SOC estimates during the last decade.
LSMs require a large amount of (digital) soil information in order to assess and predict soil–vegetation–atmosphere interactions (Sanchez et al. Citation2009). C storage, distribution, and cycling data (e.g., turnover times), for example, are essential in global climate models (Ciais et al. Citation2013; Luo et al. Citation2016). Accurate representation of size and distribution of permafrost SOC is therefore crucial in narrowing down uncertainties concerning the permafrost C climate feedback (e.g., Johnson et al. Citation2011; Boike et al. Citation2012; Burke et al. Citation2012; Mishra et al. Citation2013; Mishra et al. Citation2016). A major challenge lies in the incorporation of small-scale processes in heterogeneous permafrost terrain to the coarse spatial resolution used in LSMs (Johnson et al. Citation2011; Chadburn et al. Citation2015; Parmentier et al. Citation2017). Models are becoming better at including detailed environmental processes (e.g., Melton & Arora Citation2014), but exploring ways to bridge this gap by obtaining simple, yet accurate, upscaling tools could increase model efficiency and accuracy.
Latitudinal gradients primarily control ecosystem distribution in the Arctic, and thereby influence temperature and hydrologic factors that are linked to C storage (Ping et al. Citation2008; Mishra & Riley Citation2012). At regional scales, topographic variables, such as slope, aspect, and elevation, determine environmental characteristics and have been demonstrated to predict C content in a wide range of permafrost environments (Howarth Burnham & Sletten Citation2010; Johnson et al. Citation2011; Mishra et al. Citation2016). C stock upscaling is often based on landcover and landform classifications from soil maps and/or satellite imagery, especially in extensive C-rich lowlands with little relief (). Landcover classifications build on the assumption that spatial SOC variability is a function of soil type and vegetation cover, which can be deduced from remote-sensing data (Kuhry et al. Citation2002; Hugelius Citation2012). Although cryoturbation is known to transport large amounts of C down in the soil and permafrost (Bockheim Citation2007; Ping et al. Citation2008), most C is often found in the active layer or top organic layer (e.g., Palmtag et al. Citation2015; Siewert et al. Citation2015; Palmtag et al. Citation2016), warranting the use of surface landcover classes for upscaling. Strong geomorphologic activity, such as extensive solifluction sheets (Harris et al. Citation2011) and frequent avalanches (Eckerstorfer et al. Citation2013; De Haas et al. Citation2015), regularly redistributes and buries slope material (including SOC), which advocates the use of landform classifications. Inactive landforms are furthermore susceptible to other periglacial processes, like patterned ground formation and frost weathering, while still prone to reworking by more catastrophic slope processes (De Haas et al. Citation2015). The combination of less developed top organic layers, and repeated burial of biomass and OM, causes deep SOC to be relatively more abundant in High-Arctic soils (Howarth Burnham & Sletten Citation2010; Yoshitake et al. Citation2011; Palmtag et al. Citation2015; Wojcik et al. unpubl. ms).
In this study, we explore elevation as a parameter that can be linked to SOC storage and try to deduct a simple but effective upscaling scheme. This model should effectively constrain uncertainties for remote regions with limited available observations, as opposed to local SOC assessments which predict (point specific) SOC storage more accurately, but cannot simply be extrapolated to larger regions. We use SOC data from two intensively studied areas in central Spitsbergen, and compare these to additional areas in the region, to assess their representability. We then use these data to develop elevation classification models, and estimate total SOC storage and landscape distribution, which we present in an SOC map of Spitsbergen (Supplementary Fig. S1).
Methods
Regional setting
Spitsbergen, the largest island in the Svalbard Archipelago (ca. 37 520 km2), consists of folded igneous, metamorphic and sedimentary Precambrian–Lower Palaeozoic basement rock (Worsley Citation2008). The central part of southern Spitsbergen is overlain by Tertiary sedimentary formations set in the central basin, flanked by uplifted basement material along the fold-and-thrust belt on the Barents shelf margin (Dallman et al. Citation1993; Worsley Citation2008). Svalbard was glaciated intermittently during the Pleistocene and became partly ice-free around 10 000 years BP (Landvik et al. Citation1998). At present, approximately 60% of the landmass is covered by ice caps, ice fields, and glaciers (Humlum et al. Citation2003; Ingólfsson Citation2011). Svalbard has a polar tundra climate with mean annual air temperatures of −6 °C at sea level, and −15 °C further inland at higher elevation (Ingólfsson Citation2011). The mean annual precipitation is ca. 200 mm water equivalent in central Spitsbergen, and ca. 400–600 mm water equivalent in the eastern and western coastal regions (Ingólfsson Citation2011).
Field methods
Fieldwork was carried out during two separate field campaigns, in 2013 and 2014. In June 2013, local SOC inventories were conducted in Adventdalen (Lampiris Citation2016) and on the peninsula of Brøggerhalvøya (Wojcik et al. unpubl. ms.). In a stratified semi-random sampling scheme, sites were established equidistantly at 100–150 m intervals along transects that were predetermined to include major landforms and landcover types (,). Soil samples were collected to a depth of ca. 1 m, or down to maximum soil depth (often <1 m because of rocks or bedrock). Three organic layer replicates were collected within a 5 m radius, to capture landcover heterogeneity. The active layer was sampled using fixed volume cylinders, from the sides of a soil pit that was dug down to the permafrost table. Permafrost samples were collected using a steel pipe that was incrementally driven down with a hammer (Weiss et al. Citation2016).
Figure 2. Sampling locations of local studies in (a) Adventdalen, (b) on Brøggerhalvøya and (c) in central Spitsbergen.
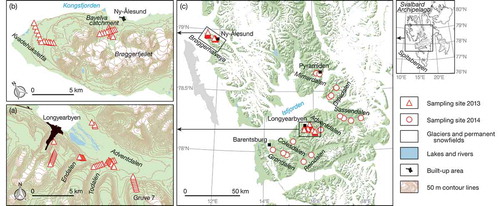
In April 2014, samples were collected in Adventdalen and six other valleys located in different parts of central Spitsbergen. Sampling sites were chosen in areas comparable with those assessed in 2013: in valley floors and adjacent foot slopes of six valleys (). Additional sites were sampled in Adventdalen, further inland than in 2013. Samples were retrieved using a motorized Stihl drilling engine with expandable drill strings and a 40 cm-long core barrel with drill head. Samples were 1–21 cm long (mean 9.7 cm) and were stored below 0 °C in plastic sample bags, after documentation.
Sample analyses
Physical parameters such as volume, gravimetric ice content, bulk density and mineral fraction >2 mm (coarse fragments) were determined for all samples. Elemental C analysis was performed on a selection of samples, which was then used to estimate C content for the remainder, using ‘loss on ignition’ (Dean Citation1974; Heiri et al. Citation2001). Sample-specific SOC density (ρC, g C cm−3) was determined using the equation:
where C is C content (in wt%), BD is bulk density (g cm−3), and CF is the fraction coarse fragments (wt%). ρC can then be used to calculate SOC content per sample or horizon depth (cm) and to obtain overall SOC storage (SOCC, kg C m−2) to 1 m or maximum soil depth:
Because of different field conditions and sampling strategy (in winter), fewer sites were sampled, and fewer samples were obtained in 2014. To avoid potential errors by interpolation and gap filling in soil profiles, SOC density was used to compare areas and assess representativeness.
Upscaling
Geographic vector data (shapefiles) from the Norwegian Polar Institute (Citation2014a) were used to delineate Spitsbergen and its glaciers, permanent snowfields, lakes and rivers. A 20-m-resolution DEM (Norwegian Polar Institute Citation2014b) raster was reduced to the extent of Spitsbergen, and glaciers, permanent snowfields, and water bodies were subtracted (cropped) using R 3.3.2 (R Core Team Citation2016). Based on the DEM and combined SOCC data from the 2013 Adventdalen and Brøggerhalvøya inventories, we explored three pragmatic classification models. The first model was based on the mean SOCC for three broad elevation ranges (classes) with contrasting SOCC values. The second model used more classes, to assess whether narrower ranges would constrain uncertainties and improve model outcomes. The third model was based on the best-fitting correlation between SOCC and elevation, to obtain an SOCC value for each DEM grid cell. Reclassifications and area calculations were done in R, using the ‘raster’ package (Hijmans Citation2016). Model parameters are described in more detail after presentation of the SOCC results.
Statistical analyses
In order to examine whether SOC storage in Adventdalen and Brøggerhalvøya is representative for other parts of Spitsbergen, results from the detailed studies were compared with data from the additional sites that were sampled in 2014. SOC density (ρC) data were grouped per sampling location and analysed for homogeneity of variance and normality. Failing normality, the Kruskal–Wallis test was performed to test significant differences between areas, and the pairwise Wilcoxon rank-sum test to identify differences between individual areas/valleys. Ninety-five per cent CIs of class parameters were calculated and combined by weighting to proportional area coverage, following
where t is the upper α/2 of a normal distribution (t ≈ 1.96 for a 95% CI), ai is the fraction of the area for class i, si is the standard deviation for class i, and ni is the number of replicates in class i (Hugelius Citation2012).
Further model validation was obtained using the RMSE (in kg C m−2) between observed (field data) and simulated values (model outcome). RMSE and Spearman’s correlation coefficients (Spearman’s r) were calculated in R, using the ‘caret’ package (Kuhn et al. Citation2016).
Mixing model
A mixing model was used to assess the effect of proportional representation (allotment) of data from Adventdalen and Brøggerhalvøya on the combined data set. In our study, 48% of the sites are from Adventdalen (n = 28) and 52% from Brøggerhalvøya (n = 30); hence this ratio (48/52%) is directly linked to model-class means and SOC estimates. Although detailed terrain assessment could provide an accurate (realistic) ratio of what part of Spitsbergen is expected to resemble Adventdalen, and what part Brøggerhalvøya, we used widely available satellite imagery (e.g., Landsat/Google Earth), which can be replicated for other High-Arctic regions. The mixing model was then applied to estimate (hypothetical) SOCC estimates resulting from either allotment extreme, i.e., if only Adventdalen or only Brøggerhalvøya data were used to obtain the class SOCC value. These ranges give an indication of the potential error that could be introduced by inaccurate distribution of samples from either contrasting area.
Results
Local C inventories
Local 2013 SOC inventories show considerably higher SOCC in Adventdalen than on Brøggerhalvøya. Mean results for 0–1 m depth in Adventdalen were 4.19 ± 0.69 kg C m−2 (landform based) and 4.77 ± 0.55 kg C m−2 (landcover based) (Lampiris Citation2016), and 0.96 ± 0.31 (landcover based) and 1.04 ± 0.31 kg C m−2 (landform based) for Brøggerhalvøya (Wojcik et al. unpubl. ms). Landform and landcover upscaling did not produce significantly different estimates. lists the landcover classes used in the two local studies, and their respective SOC estimates in kg C m−2 down to 1 m depth. Both areas’ predominant landcover types contain little SOC: 0.3 kg C m−2 in bedrock/bare soil/water and 0.4 kg C m−2 in bare gravel (). Although vegetated sites store most C (), both areas show high SOCC in geomorphologically active landforms, like solifluction slopes (6.7 kg C m−2 on Brøggerhalvøya, and 20.7 kg C m−2 in Adventdalen). In both areas, SOCC decreased with depth, and no evidence was found of cryogenic OM burial, indicating that surface horizons primarily determine total landscape C stocks. Glaciers and permanent snowfields are underrepresented in both the Adventdalen (3%) and Brøggerhalvøya (29%) study areas, compared with the overall 54% ice cover of Spitsbergen.
Table 1. Landcover classes with corresponding areal extent and SOCC attributes, as calculated in previous contributions.
Regional C content assessment
To address whether or not results from Adventdalen and Brøggerhalvøya (2013) can be considered representative for a larger region, and therefore appropriate for upscaling, we compare ρC data in these areas with results from sampling sites throughout central Spitsbergen, collected in 2014 (). The Kruskal–Wallis rank-sum test indicates a significant overall difference in valley ρC distributions (H = 97.7, p = 0.01). Individual comparisons between valleys show that Adventdalen and Brøggerhalvøya are significantly different (H = 77.0, p = 0.01). Other than that, only two valleys show significant differences to Adventdalen, and only one differs significantly from Brøggerhalvøya (). Furthermore, none of the valleys appears to be significantly different from both Adventdalen and Brøggerhalvøya.
Table 2. Matrix showing p values of pairwise Wilcoxon rank-sum test, comparing mean SOC. All tests were carried out in R, and significance levels are reported with a single (p < 0.05) or double asterisk (p < 0.01) after correcting for false discovery rate (Benjamini & Hochberg Citation1995).
Figure 3. Sample C density (ρC) distribution per sampling area (). ‘2014’ results were collected in the winter of 2014, and ‘2013’ indicates results from the detailed SOC inventories carried out in 2013. Boxes indicate the second and third quartile, and the vertical line inside the box represents the median. Whiskers show the minimum and maximum within 1.5 times the interquartile range.
C density comparison does not account for the origin of sampled material (e.g., organic layer, active layer or permafrost) or differentiate between sampled landcover types (e.g., bare ground, patchy vegetation, moist tundra). Even so, density distributions indicate no major differences between the detailed local inventories and validation sites from valleys across central Spitsbergen. Middle quartiles of all valleys or regions fall within a range of ca. 0.02 g C cm−3 from the detailed inventory (2013) means (). Lower quartiles, however, show a clear difference between high-detail studies (2013) and additional areas (2014), as data from areas sampled in 2014 include more sites with no SOC.
Landscape SOC distribution
With increasing elevation, vegetation and organic soil become less abundant, which is reflected in C content as a function of elevation (). In Adventdalen, sites with high SOCC (up to 43 kg C m−2) are common below ca. 100 m asl (). On Brøggerhalvøya, SOCC shows a similar pattern, with its highest values in the same altitudinal range, although with lower absolute amounts than in Adventdalen (). This corresponds to general differences in mean SOCC and total estimated stocks between the areas. Both Adventdalen and Brøggerhalvøya, however, show a distinct drop in SOCC for sites above ca. 100 m asl ().
Figure 4. Local-inventory SOC content as a function of site elevation in m asl.
In accordance with field observations, this change in C content seems to correspond with the transition from vegetated valley floors to geomorphically more active and less vegetated slopes. In Adventdalen, SOCC decreases strongly between 100 and 400 m asl, but still displays maxima of 17.3 kg C m−2 (close to 100 m asl) and 13.1 kg C m−2 (342 m asl) (). These sites represent stable surfaces where OM locally accumulates in or around topographic irregularities, acting as sediment traps (e.g., moraine ridges, avalanche paths, or bedrock outcrops).
Above ca. 400 m asl, most sites contain less than 2 kg C m−2, and a large part is (close to) 0. This elevation range reflects higher alpine terrain and sedimentary mountain plateaus that are common in parts of central Spitsbergen (Eckerstorfer et al. Citation2013; Oliva et al. Citation2014; De Haas et al. Citation2015). Data from slopes and mountains on Brøggerhalvøya have not been collected, as the more alpine environment and corresponding lack of soil and vegetation made sampling at higher elevations unfeasible. Sites at 80 and 134 m asl contained no C, suggesting SOCC to reach negligible levels around 100 m asl. Despite local topographic heterogeneity (as observed in Adventdalen), our data indicate no substantial SOC stocks above 100 m asl on Brøggerhalvøya.
Based on the detailed, high-resolution Adventdalen and Brøggerhalvøya SOC inventory data, the three upscaling models were defined by: (i) ‘3-class’ model with three primary elevation classes, broadly relating to the more vegetated valley floors and foot slopes (0–100 m asl), steeper mountain slopes (100–400 m asl), and mountain plateaus and alpine terrain (>400 m asl) that were observed in Adventdalen and on Brøggerhalvøya, and are common throughout central Spitsbergen; (ii) ‘7-class’ model, which, because of the high variability in SOCC in the 0–100 m asl class, was subdivided into 20 m vertical steps (0–20 m asl, 20–40 m asl, etc.), and above 100 m asl classes were identical to those of the 3-class model; (iii) ‘exp’ model, based directly on the observed exponential relationship between SOCC and elevation of the combined Adventdalen and Brøggerhalvøya SOCC data set ().
shows model fits and spatial upscaling results for the three approaches. Corresponding mean SOCC estimates for Spitsbergen (total surface) and unglaciated terrain are provided, with validation indices RMSE and Pearson’s r, as well as 95% CIs for the class-based methods.
Figure 5. Upscaling model comparison with C storage estimates and validation indices: mean SOC content for all of Spitsbergen and for unglaciated terrain on Spitsbergen, Pearson’s correlation coefficient (r), and RMSE. (a) Model fits; (b) 3-class model: 0–100, 100–400, and >400 m asl; (c) 7-class model: same as 3-class but 0–100 m asl divided in 20 m intervals; (d) model based on exponential relationship ().
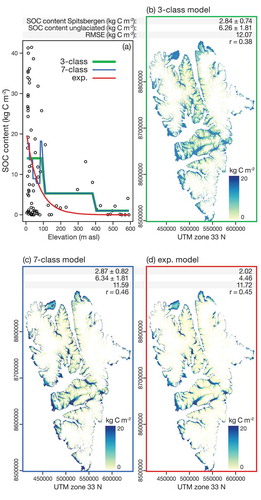
The 3- and 7-class models provide very similar overall estimates (2.84 and 2.87 kg C m−2, respectively), whereas the exponential correlation-based model is considerably lower (2.02 kg C m−2). Model fits confirm that over the entire range, the exp-model is lower than the class means in the 3- and 7-class models (). The 7-class model is strongly influenced by the small number of sites in low-elevation classes, most clearly illustrated by the sudden peak between 80 and 100 m asl.
Pearson’s correlation coefficient and RMSE are slightly lower for the 3-class model than for the 7-class and exp-model. Uncertainty (proportional to class data and extent) is comparable for the discrete classification models. CIs for mean values for each class, however, are more constrained for the 3-class than for the 7-class model, because of the difference in class widths and number of observations in each class. The mean ± 95% CI for the 0–100 m asl class in the 3-class model is 14.01 ± 3.68 kg C m−2 (), whereas the mean SOCC and CI for the five classes between 0 and 100 m asl in the 7-class model is 17.66 ± 19.37 kg C m−2, largely driven by very high values for the 80–100 class with an SOCC estimate of 18.22 ± 95.96 kg C m−2.
Figure 6. Mean SOC content per elevation class for the 3-class model. Error bars indicate 95% CIs. Elevation in m asl.
Discussion
Landscape SOC distribution
Previous studies demonstrated that topographic factors contribute strongly to controls over (High-)Arctic SOC content (e.g., Ping et al. Citation2008; Johnson et al. Citation2011; Palmtag et al. Citation2015; Mishra et al. Citation2016). Many of these studies consider and quantify a large number of ecologic and topographic variables, such as that by Howarth Burnham & Sletten (Citation2010), who found that total vegetation cover and elevation combined explained a third of the SOC variance observed in the Thule region.
The goal of this study is to explore SOC upscaling methods using easily accessible parameters, and with limited available field observations. The observed empirical relationship between elevation and SOCC meets the requirements of simplicity, and DEMs are widely available. Vegetated, geomorphologically stable lowlands store the majority of the total SOC stocks, slope material contains less SOC but reveals local peaks (sediment/C traps), and mostly unvegetated uplands and alpine terrain contain little to no SOC. A vegetation map of Svalbard indicates ca. 2.5 times more above-ground biomass in lowlands (<200 m) than in uplands (>200 m) in central Spitsbergen (Johansen & Tømmervik Citation2014). This gradient in vegetation is likely further amplified in SOCC, as slope material (including OM) collects in foot slopes, alluvial fans, and other accreting sediments lower in the landscape (Oliva et al. Citation2014; De Haas et al. Citation2015). Uplands and lowlands might furthermore show a contrasting response to climate warming, as increased biomass production in terrain that contains little SOC (like alpine and High-Arctic permafrost) could turn into C sinks (Fuchs et al. Citation2015). High-Arctic lowlands could, like other low- and sub-Arctic permafrost regions, turn into a sink or a source, although this remains uncertain and open to further scientific investigation (Abbott et al. Citation2016; Hobbie et al. Citation2000).
Within High-Arctic lowlands, however, we encountered contrasting landscape types in Adventdalen and on Brøggerhalvøya. Adventdalen is a broad lowland valley with a braiding river system, river terraces, and vegetated polygonal features in Holocene aeolian deposits (Oliva et al. Citation2014). At similar elevations on the Brøggerhalvøya, we investigated vegetated moraines with unsorted circles and mudboils in the Bayelva catchment (Boike et al. Citation2008) and the Kvadeuksletta coastal plain on the north-western tip of the peninsula (). The raised beach ridges on Kvadehuksletta consist of silt-rich, fine grained materials, as well as coarse marine gravels and pebbles. Various pedologic and cryogenetic processes have developed into C-poor, scarcely vegetated patterned ground (Etzelmüller & Sollid Citation1991). Similar to the broad lowland valleys (), raised beaches are common landforms on Spitsbergen (Salvigsen Citation1984; Bondevik et al. Citation1995; Long et al. Citation2012). Remote-sensing techniques have shown promising results in mapping vegetation units, as well as unvegetated terrain (Johansen & Tømmervik Citation2014), which can be related to raised beaches (Johansen et al. Citation2012). As discussed earlier, however, vegetation and SOC storage are not necessarily related, which means that differentiating between vegetation and landcover types within lowland areas would reintroduce a vast degree of complexity.
Classification and upscaling approaches
The two elevation-class based upscaling models explored in this study show similar SOCC estimates (ca. 2.8 kg C m−2), whereas the exponential correlation-based model result is lower (2.0 kg C m−2) (). The exponential decrease forced by the full data set provides a stronger negative response in the correlation, which is not the case in the categorical model-class means. It is furthermore difficult to compare discrete and continuous models, as validation indices are often assumed to be discrete (Foody Citation2002). For example, 95% CIs of elevation-class-based estimates (commonly used in SOC upscaling and landcover classification studies) require discrete classes and surface areas (Hugelius Citation2012).
Besides statistical validation, we believe that the performance of these models should be discussed in terms of mechanistic accuracy (based on geomorphologic understanding), even though this is extremely difficult to quantify. One example is the local SOCC peak values found on slopes in Adventdalen. In the class-based models, these sites weigh more heavily in the class mean, as it is independent of data outside the class. The exponential model, on the other hand, counterbalances these maxima by the weight of the complete data set. Model relevance, therefore, depends on a holistic understanding of landscape processes, which is not necessarily equivalent to statistical model accuracy. Increasing numbers of observations will logically improve estimates towards more realistic values, as well as improve model accuracy. However, model performance with limited data is essential for the High Arctic, so a degree of supervised classification related to model parameterization can be preferable.
Although the two elevation-class models produce similar SOC stock estimates, the relatively small data set results in large CIs in the more narrowly ranged 7-class model (). Since overall predictions and model validation parameters indicate no major differences between the elevation-class models, we would advocate the use of the more robust 3-class model over the narrower and more uncertain classes in the 7-class model. For example, the peak between 80 and 100 m asl in the 7-class model is not expected to indicate a naturally occurring phenomenon, but is expected to simply be a consequence of the small number of samples in the 80–100 class (SOCC = 18.22 ± 95.96 kg C m−2, n = 2). The upper marine limit in Svalbard is located around 30–90 m asl (Bondevik et al. Citation1995; Long et al. Citation2012) and could influence SOC accumulation, but we do not expect this to be responsible for this peak, and it is therefore not further considered in this study.
Increasing the number of classes to obtain a better model fit, or adding additional factors to a classification, will likely yield better results, although this requires more data. A promising approach used in large-scale Alaskan environmental permafrost assessments is to include terrain attributes (e.g., elevation, slope and aspect) to create a geographic landscape position classification (Mishra & Riley Citation2012; Mishra et al. Citation2016), which can be done using elevation data. These classifications indirectly include other environmental factors that are related to elevation, like wetness and physical OM accumulation, which might better explain SOC storage than elevation alone. To use this method for regional upscaling, we would require additional observations, especially since our current data set is concentrated on two local field studies. With a limited number of densely clustered observations, it is probable that certain classes or features are not represented by the data. Classes with too few or no data might not only impair model (class) accuracy but also complicate comparison with other High-Arctic assessments, which could limit the possibilities of improving circumarctic estimates without depending on large amounts of additional field data. As observed with the 7-class model, landscape position classification can increase accuracy but requires additional data, which makes it less suitable for our current data set and perhaps for data-scarce High-Arctic permafrost regions in general.
Spitsbergen SOC estimates
Although the three models produced comparable results, we find the trade-off between simplicity, representativeness, and accuracy best for the 3-class model. Despite the high level of simplification, it is able to reflect a certain degree of the observed and reported landscape processes relating to SOC storage. Having two or more classes increases the model’s ability to represent the distinct contrast between upland and lowland sites, which we expected to be beneficial for SOC upscaling in the High Arctic.
Based on mean SOCC values for the 3-class elevation model upscaling (), we estimate the total amount of SOC stored on Spitsbergen to be 105.36 Tg (0.11 Pg), with a mean SOCC of 2.84 ± 0.74 kg C m−2 for 0–1 m depth (). Excluding the areas presently covered by ice masses, Spitsbergen is estimated to contain on average 6.26 ± 1.47 kg C m−2. Despite the local accumulation of deep, organic-rich sediments, like mid-Holocene peat layers covered by aeolian deposits in Adventdalen (Oliva et al. Citation2014), we do not expect overall estimates for greater depths (e.g., 0–3 m, used in the NCSCD) to be much higher, based on the observed decrease of SOCC with depth and general lack of evidence of buried C. Compared with the individual uncertainty levels of the elevation classes, overall Spitsbergen SOCC estimates are rather well constrained. Because of the relatively large number of sampling sites between 0 and 100 m asl, high in-class variability does not result in exceptionally high uncertainty, which would be more pronounced with more and smaller upscaling classes, such as in the 7-class model. A map of permafrost SOC storage on Spitsbergen based on the 3-class model is provided as Supplementary Fig. S1.
Table 3. Upscaling class areal distribution and SOCC attributes.
Mixing model
By combining data from Adventdalen and Brøggerhalvøya, two highly contrasting landscape types, a large SOCC variability is introduced within the 0–100 m asl elevation class. Based on ad hoc classification, we estimated that broad lowland valleys occupy ca. 37% (ca. 1800 km2) of the land surface below 100 m asl on Spitsbergen (ca. 4923 km2). Smaller valleys and vegetated parts of coastal plains (e.g., alluvial fans, wetlands, and deltas) are not included, though, so the actual allocation of high-SOCC terrain could be larger. We therefore predict that the high SOCC values found in Adventdalen are representative for 40–50% of Spitsbergen between 0 and 100 m a.s.l, which can then be used to correct for proportional data contribution. For this study, we did not apply a correction, since our data set distribution (48/52%) falls within the predicted realistic range.
shows SOCC estimates as a function of proportional contribution of Adventdalen–Brøggerhalvøya (100/0% on one side and 0/100% on the other). If the data set consisted only of Adventdalen sites (100% Adventdalen), the mean SOCC between 0 and 100 m asl (SOCC0−100) would be 25.8 kg C m−2 (indicated by the circle with error bars on the right-hand side of the dashed line in ). The other extreme would be that SOCC0−100 were based only on data from Brøggerhalvøya (100% Brøggerhalvøya), which would result in an SOCC0−100 of 3.0 kg C m−2 (left circle with error bars on the dashed line; ). The middle marker with error bars on the dashed line indicates the observed SOCC0−100 class mean, based on the aforementioned observed 48/52% allocation in our data set. The vertical grey band in is the 40–50% Adventdalen range (=60–50% Brøggerhalvøya), estimated to be a realistic ratio of broad lowland valleys to coastal plains on Spitsbergen. This range corresponds to SOCC0−100 class estimate of 12.1–14.4 kg C m−2 (upper horizontal grey band in ). This means that the effect of misclassification (incorrect allocation) of the surface represented by either Adventdalen or Brøggerhalvøya (12.1–14.4 kg C m−2) is considerably smaller than the SOCC0−100 CI (14.01 ± 3.68 kg C m−2). Although this is no model validation, it suggests that errors resulting from merging data from contrasting landscapes into one class do not strongly influence class estimates.
Figure 7. SOCC theoretic mixing model based on Adventdalen/Brøggerhalvøya sampling site distribution (as percentage within the 0–100 m class). The upper × marks the calculated mean SOCC for the 0–100 m asl class for this study, and the ○s to either side mark the class mean if based on data from only one site. The dashed line is the hypothetical response between the two extremes. The same is presented for the response of the mean (overall) Spitsbergen SOCC estimate if the 0–100 class mean was based on either hypothetical extreme as well as the observed mean. The vertical grey band indicates the expected distribution of area represented by either group (allotment) on Spitsbergen, and the horizontal grey bands indicate the SOCC range corresponding to this estimate. Error bars indicate 95% CIs.
A similar theoretic exercise shows that the overall Spitsbergen SOCC estimate would be 4.3 kg C m−2 if the 0–100 class were purely based on Adventdalen (the right circle with error bars on the dotted line, ) and 1.4 kg C m−2 with 100% Brøggerhalvøya representation (left circle with error bars on the dotted line, ). The expected realistic 40–50% Adventdalen allotment range (vertical grey band) returns overall Spitsbergen SOCC estimates between 2.6 and 2.9 kg C m−2 (lower grey band), indicating a limited response to overall SOCC estimates caused by errors introduced by combining data from contrasting landscapes.
Comparison with regional and circumpolar SOC stock estimates
Comparisons between SOC assessments are challenging, as studies tend to use different sampling techniques, soil depths, biological boundaries, and upscaling methods (Howarth Burnham & Sletten Citation2010), and model accuracy lacks standard definitions (Foody Citation2002). Our study scale sits between local high-resolution assessments and circumarctic upscaling estimates. Although our results do not display the high-degree precision that detailed SOC inventories do, we are able to estimate landscape SOC distribution for a permafrost region for which, until now, such data did not exist. Compared with the NCSCD, our models are better at spatial SOCC prediction, as circumarctic SOC maps do not include any spatial distribution or partitioning (Hugelius, Bockheim et al. Citation2013; Hugelius, Tarnocai et al. Citation2013). For the whole Svalbard Archipelago, the NCSCD uniformly estimates a mean SOCC of 3.8 kg C m−2, consisting of four polygons (dissected by coastlines). Our estimate of 2.84 kg C m−2 is lower than the current NCSCD estimate, although considering the scale and inherent uncertainties involved, still relatively comparable.
Local SOC inventories from Spitsbergen indeed show detail that is no longer discernible in our regional assessment. In low-elevation parts of the Brøggerhalvøya, for example, Yoshitake et al. (Citation2011) found SOCC values between 1.1 and 7.9 kg C m−2. For low elevations, our estimate for Spitsbergen is considerably higher (14.0 kg C m−2), but this is to be expected, since our estimate includes contrasting data from Adventdalen. Looking at however, we see that our estimate for just Brøggerhalvøya would be 3.0 kg C m−2, which is closer to the mean estimate of 4.3 kg C m−2 by Yoshitake et al. (Citation2011). However, we wish to stress that this is no actual validation of our model, since we do not specifically report this 3.0 kg C m−2, but merely use it to average out the SOCC0−100 estimate. We have no local comparisons for our Adventdalen estimates specifically, but looking at a study from Zackenberg, north-east Greenland, Palmtag et al. (Citation2015) estimate 17.8 kg C m−2 for the vegetated parts of the landscape. This is lower than our estimate for 0–100 m asl in Adventdalen (25.8 kg C m−2, ), but the Zackenberg mean for vegetated landcover classes could include sites at higher elevations, which (in our case) would result in a lower mean. The mean for all landcover classes combined in Zackenberg was 8.3 kg C m−2, which is somewhat higher than our estimate for all land on Spitsbergen (6.26 kg C m−2, glaciers excluded). Howarth Burnham & Sletten (Citation2010) compared several earlier High-Arctic SOCC estimates, which reported mean values of 7.2 kg C m−2, 10.8 kg C m−2, and 11.0 kg C m−2 (i.e., Miller et al. Citation1983; Tarnocai Citation2000; Elberling et al. Citation2004, respectively). As mentioned before, these results are difficult to compare, since they come from different High-Arctic ecosystems and used different depth intervals (e.g., 0–0.5 m in Elberling et al. Citation2004). Nevertheless, it is indicative that all these estimates are higher than ours. In the same study, Howarth Burnham & Sletten (Citation2010) report their own results from the Thule region (north-west Greenland), ranging from 0.5 kg C m−2 to 26.4 kg C m−2, with mean values of 15.4 kg C m−2 for mire sites, 7.9 kg C m−2 for polar semidesert, and 2.2 kg C m−2 in polar desert. These groups can be compared to earlier work by Bliss & Matveyeva (Citation1992), who reported 10.29 kg C m−2 in mire sites, 0.97 kg C m−2 in semidesert, and 0.02 kg C m−2 in polar desert. However, because this study was based only on shallow soil profiles (0–0.25 m) and did not include the substantial source of deeper C (due to cryoturbation and other slope processes), it is thought to underestimate overall C stocks (Howarth Burnham & Sletten Citation2010).
Our model outcome of 6.2 kg C m−2 for unglaciated land on Spitsbergen is lower than most reported High-Arctic estimates, and our estimate is even lower (2.8 kg C m−2) when we include glaciated terrain. However, it is possible that SOC-poor landscapes are more common in the High Arctic than is represented by most permafrost SOC inventory studies, which is corroborated by the comparably low estimates reported throughout the High Arctic in the NCSCD. This emphasizes the need for upscaling techniques that are less dependent on small-scale, high-detail SOC upscaling products. Depending on the purpose of the assessment, an appropriate method can be selected. Models such as those in this study will be far less accurate in predicting local heterogeneity and point-specific SOC content. For certain goals, however, this level of accuracy is not required, and simple (elevation-based) upscaling can provide an important improvement in level of spatial distribution and overall estimates compared with circumarctic data sets.
Conclusions
This study shows that widely available elevation data can be used to scale local SOC field estimates up to larger areas in the high-relief landscapes of the High Arctic. Without geographic surface classification or manual mapping, a simple DEM reclassification can efficiently provide an accurate SOCC model tile scheme.
Our SOC estimates are lower than those currently predicted for the Svalbard Archipelago, and much lower than many other High-Arctic regions that still show very high SOCC estimates in circumarctic assessments (e.g., parts of northern Greenland; ). A simple upscaling model could easily address some of these possible overestimations, and generate more detailed and accurate landscape SOC maps than those based on polygons used in circumpolar assessments. Local studies are area specific and as such do not claim to represent larger areas. Using these studies outside their original bounds should therefore be done with care, and regional validation data can help address representativeness issues. In this study, using exclusively one of the two areas would have either underrepresented or overrepresented our estimates. However, the relative small area of the most variable and C-rich terrain limits the resulting error. Considering the dominance of C-poor terrain types in the High-Arctic, other regions might prove to be similarly unaffected by variability within a small, but C-rich elevation class.
Several apparent improvements could be made to the upscaling models presented in this study. It would be evident to add or split up current elevation classes, or to classify geographic landscape position based on elevation data. Such steps will improve the estimates but at the same time compromise the aim for simplicity. Adding observations, however, in this case from areas such as northern and southern Spitsbergen will expand the geographic footprint of this data set and further constrain uncertainties. With relatively limited amounts of soil data, this method was able to provide a first landscape SOC distribution estimate that can be used in models and serve as a basis for further development. For regional SOC upscaling, the ratio of C-poor to C-rich sites in future data collection should more accurately reflect the High-Arctic landscape. Although it seems unconventional to conduct costly C inventories in remote regions that are not expected to contain large amounts of C, addressing the current deficit of C-poor sites will increase overall accuracy and likely reduce total SOC stock estimates. Furthermore, by sampling more diverse regions and including a wide range of landscape positions, elevation-based upscaling could be further developed to include important topographic variables (e.g., slope and aspect) that could improve High-Arctic SOC estimates.
The presented upscaling method is deliberately basic. In general, landscape process studies and other high-resolution investigations benefit greatly from sophisticated data and modern techniques. Without dismissing such efforts, we demonstrate that for certain purposes, such as obtaining pragmatic estimates of High-Arctic SOC stocks and landscape distribution, a simple, low-resolution approach is adequate and accurate.
Supplementary material
Download MS Word (10.8 MB)Acknowledgements
We would like to thank Peter Kuhry and Gustaf Hugelius (Department of Physical Geography, Stockholm University), and Hildred Crill (Department of Geological Sciences, Stockholm University) for their constructive feedback, as well as Dorota Medrzycka, Juri Palmtag, and others for their time and contribution in the field. We also thank the University Centre in Svalbard Arctic Geology and Logistics departments in Longyearbyen, Svalbard, for their logistical support. Finally, we would like to thank two anonymous referees for their efforts and valuable contribution to this work. At the time of the research, RW was at the Department of Physical Geography, Stockholm University.
Disclosure statement
No potential conflict of interest was reported by the authors.
Supplemental data
Supplemental data for this article can be accessed here.
Additional information
Funding
References
- Abbott B.W., Jones J.B., Schuur E.A.G., Chapin F.S. III, Bowden W.B., Bret-Harte M.S., Epstein H.E., Flannigan M.D., Harms T.K., Hollingsworth T.N., Mack M.C., McGuire A.D., Natali S.M., Rocha A.V., Tank S.E., Turetsky M.R., Vonk J.E., Wickland K.P., Aiken G.R., Alexander H.D., Amon R.M.W., Benscoter B.W., Bergeron Y., Bishop K., Blarquez O., Bond-Lamberty B., Breen A.L., Buffam I., Cai Y., Carcaillet C., Carey S.K., Cooper L.W., Chen H.Y.H., Christensen T.R., Cornelissen J.H.C., de Groot W.J., DeLuca T.H., Dorrepaal E., Fetcher N., Finlay J.C., Forbes B.C., French N.H.F., Gauthier S., Girardin M.P., Goetz S.J., Goldammer J.G., Gough L., Grogan P., Guo L., Higuera P.E., Hinzman L., Hu F.S., Hugelius G., Jafarov E.E., Jandt R., Johnstone J.F., Karlsson J., Kasischke E.S., Kattner G., Kelly R., Keuper F., Kling G.W., Kortelainen P., Kouki J., Kuhry P., Laudon H., Laurion I., Macdonald R.W., Mann P.J., Martikainen P.J., McClelland J.W., Molau U., Oberbauer S.F., Olefeldt D., Paré D., Parisien M.-A., Payette S., Peng C., Pokrovsky O.S., Rastetter E.B., Raymond P.A., Raynolds M.K., Rein G., Reynolds J.F., Robards M., Rogers B.M., Schädel C., Schaefer K., Schmidt I.K., Shvidenko A., Sky J., Spencer R.G.M., Starr G., Striegl R.G., Teisserenc R., Tranvik L.J., Virtanen T., Welker J.M. & Zimov S.A.A. 2016. Biomass offsets little or none of permafrost carbon release from soils, streams, and wildfire: an expert assessment. Environmental Research Letters 11, article no. 034014, doi: 10.1088/1748-9326/11/3/034014.
- Benjamini Y. & Hochberg Y. 1995. Controlling the false discovery rate: a practical and powerful approach to multiple testing. Journal of the Royal Statistical Society, Series B 57, 1–14.
- Bliss L.C. & Matveyeva N.V. 1992. Circumpolar Arctic vegetation. In Chapin F.S. III et al. (eds.): Arctic ecosystems in a changing climate: an ecophysiological perspective. Pp. 59–90. San Diego: Academic Press.
- Bockheim J.G. 2007. Importance of cryoturbation in redistributing organic carbon in permafrost-affected soils. Soil Science Society of America Journal 71, 1335–1342.
- Boike J., Ippisch O., Overduin P.P., Hagedorn B. & Roth K. 2008. Water, heat and solute dynamics of a mud boil, Spitsbergen. Geomorphology 95, 61–73.
- Boike J., Langer M., Lantuit H., Muster S., Roth K., Sachs T., Overduin P.P., Westermann S. & McGuire A.D. 2012. Permafrost – physical aspects, carbon cycling, databases and uncertainties. In R. Lal et al. (eds.): Recarbonization of the biosphere: ecosystems and the global carbon cycle. Pp. 159–185. Dordrecht: Springer.
- Bondevik S., Mangerud J., Ronnert L. & Salvigsen O. 1995. Postglacial sea-level history of Edgeøya and Barentsøya, eastern Svalbard. Polar Research 14, 153–180.
- Burke E.J., Hartley I.P. & Jones C.D. 2012. Uncertainties in the global temperature change caused by carbon release from permafrost thawing. Cryosphere 6, 1063–1076.
- CAVM Team 2003. Circumpolar Arctic vegetation map. 1:7,500,000 scale. Conservation of Arctic Flora and Fauna Map no. 1. Anchorage: US Fish and Wildlife Service.
- Chadburn S.E., Burke E.J., Essery R.L.H., Boike J., Langer M., Heikenfeld M., Cox P.M. & Friedlingstein P. 2015. Impact of model developments on present and future simulations of permafrost in a global land-surface model. Cryosphere 9, 1505–1521.
- Ciais P., Sabine C., Bala G., Bopp L., Brovkin V., Canadell J.G., Chhabra A., DeFries R., Galloway J., Heimann M., Jones C., Quéré C.L., Myneni R., Piao S. & Thornton P. 2013. Carbon and other biogeochemical cycles. In T. Stocker et al. (eds.): Climate change 2013. The physical science basis. Contribution of Working Group I to the fifth assessment report of the Intergovernmental Panel on Climate Change. Pp. 465–570. Cambridge: Cambridge University Press.
- Dallman W.K., Andresen A., Bergh S.G., Maher Jr. H.D. & Ohta Y. 1993. Tertiary fold-and-thrust belt of Spitsbergen, Svalbard. Norsk Polarinstitutt Meddelelser 128. Oslo: Norwegian Polar Institute.
- Davidson E.A. & Janssens I.A. 2006. Temperature sensitivity of soil carbon decomposition and feedbacks to climate change. Nature 440, 165–173.
- De Haas T., Kleinhans M.G., Carbonneau P.E., Rubensdotter L. & Hauber E. 2015. Surface morphology of fans in the High-Arctic periglacial environment of Svalbard: controls and processes. Earth-Science Reviews 146, 163–182.
- Dean W.E.J. 1974. Determination of carbonate and organic matter in calcareous sediments and sedimentary rocks by loss on ignition: comparison with other methods. Journal of Sedimentary Petrology 44, 242–248.
- Eckerstorfer M., Christiansen H.H., Vogel S. & Rubensdotter L. 2013. Snow cornice dynamics as a control on plateau edge erosion in central Svalbard. Earth Surface Processes and Landforms 38, 466–476.
- Elberling B., Jakobsen B.H., Berg P., Søndergaard J. & Sigsgaard C. 2004. Influence of vegetation, temperature, and water content on soil carbon distribution and mineralization in four High Arctic soils. Arctic, Antarctic, and Alpine Research 36, 528–538.
- Etzelmüller B. & Sollid J.L. 1991. The role of weathering and pedological processes for the development of sorted circles on Kvadehuksletta, Svalbard – a short report. Polar Research 9, 181–191.
- Foody G.M. 2002. Status of land cover classification accuracy assessment. Remote Sensing of Environment 80, 185–201.
- Fuchs M., Kuhry P. & Hugelius G. 2015. Low below-ground organic carbon storage in a Subarctic alpine permafrost environment. Cryosphere 9, 427–438.
- Harris C., KernLuetschg M., Christiansen H.H. & Smith F. 2011. The role of interannual climate variability in controlling solifluction processes, Endalen, Svalbard. Permafrost and Periglacial Processes 22, 239–253.
- Heiri O., Lotter A.F. & Lemcke G. 2001. Loss on ignition as a method for estimating organic and carbonate content in sediments: reproducibility and comparability of results. Journal of Paleolimnology 25, 101–110.
- Hijmans R.J. 2016. Raster: geographic data analysis and modeling. R package, version 2.5-8. http://CRAN.R-project.org/package=raster.
- Hobbie S.E., Schimel J.P. & Trumbore S.E. 2000. Controls over carbon storage and turnover in high-latitude soils. Global Change Biology 6, 196–210.
- Howarth Burnham J. & Sletten R.S. 2010. Spatial distribution of soil organic carbon in northwest Greenland and underestimates of High Arctic carbon stores. Global Biogeochemical Cycles 24, GB3012, doi: 10.1029/2009GB003660.
- Hugelius G. 2012. Spatial upscaling using thematic maps: an analysis of uncertainties in permafrost soil carbon estimates. Global Biogeochemical Cycles 26, GB2026, doi: 10.1029/2011GB004154
- Hugelius G., Bockheim J.G., Camill P., Elberling B., Grosse G., Harden J.W., Johnson K., Jorgenson T., Koven C.D., Kuhry P., Michaelson G.J., Mishra U., Palmtag J., O’Donnell J.A., Schirrmeister L., Schuur E.A.G., Sheng Y., Smith L.C., Strauss J. & Yu Z. 2013. A new data set for estimating organic carbon storage to 3 m depth in soils of the northern circumpolar permafrost region. Earth System Science Data 5, 393–402.
- Hugelius G., Strauss J., Zubrzycki S., Harden J.W., Schuur E.A.G., Ping C.-L., Schirrmeister L., Grosse G., Michaelson G.J., Koven C.D., O’Donnell J.A., Elberling B., Mishra U., Camill P., Yu Z., Palmtag J. & Kuhry P. 2014. Estimated stocks of circumpolar permafrost carbon with quantified uncertainty ranges and identified data gaps. Biogeosciences 11, 6573–6593.
- Hugelius G., Tarnocai C., Broll G., Canadell J.G., Kuhry P. & Swanson D.K. 2013. The northern circumpolar soil carbon database: spatially distributed 700 datasets of soil coverage and soil carbon storage in the northern permafrost regions. Earth System Science Data 5, 3–13.
- Humlum O., Instanes A. & Sollid J.L. 2003. Permafrost in Svalbard: a review of research history, climatic background and engineering challenges. Polar Research 22, 191–215.
- Ingólfsson O. 2011. Fingerprints of Quaternary glaciations on Svalbard. In I.P. Martini et al. (eds.): Ice-marginal and periglacial processes and sediments. Pp. 15–31. London: Geological Society.
- Johansen B. & Tømmervik H. 2014. The relationship between phytomass, NDVI 708 and vegetation communities on Svalbard. International Journal of Applied Earth Observations and Geoinformation 27, 20–30.
- Johansen B.E., Karlsen S.R. & Tømmervik H. 2012. Vegetation mapping of Svalbard utilising Landsat TM/ETM+ data. Polar Record 244, 47–63.
- Johnson K.D., Harden J., McGuire A.D., Bliss N.B., Bockheim J.G., Clark M., Nettleton-Hollingsworth T., Jorgenson M.T., Kane E.S., Mack M., O’Donnell J., Ping C.L., Schuur E.A.G., Turetsky M.R. & Valentine D.W. 2011. Soil carbon distribution in Alaska in relation to soil-forming factors. Geoderma 167–168, 71–84.
- Kuhn M., Wing J., Weston S., Williams A., Keefer C., Engelhardt A., Cooper T., Mayer Z., Kenkel B., Core Team R., Benesty M., Lescarbeau R., Ziem A., Scrucca L., Tang Y., Candan C. & Hunt T. 2016. Caret: classification and regression training. R package version 6.0-73. https://CRAN.R-project.org/package=caret.
- Kuhry P., Mazhitova G., Forest P., Deneva S., Virtanen T. & Kultti S. 2002. Upscaling soil organic carbon estimates for the Usa Basin (northeast European Russia) using GIS-based landcover and soil classification schemes. Danish Journal of Geography 102, 11–25.
- Lampiris N. 2016. Upscaling soil organic carbon estimates in continuous permafrost terrain of Svalbard using landform and land cover classification schemes. Msc thesis, Stockholm University.
- Landvik J.Y., Bondevik S., Elverhøi A., Fjeldskaar W., Mangerud J., Salvigsen O., Siegert M.J., Svendsen J.I. & Vorren T.O. 1998. The last glacial maximum of Svalbard and the Barents sea area: ice sheet extent and configuration. Quaternary Science Reviews 17, 43–75.
- Long A.J., Strzelecki M.C., Lloyd J.M. & Bryant C.L. 2012. Dating High Arctic Holocene relative sea level changes using juvenile articulated marine shells in raised beaches. Quaternary Science Reviews 48, 61–66.
- Luo Y., Ahlström A., Allison S.D., Batjes N.H., Brovkin V., Carvalhais N., Chappell A., Ciais P., Davidson E.A., Finzi A., Georgiou K., Guenet B., Hararuk O., Harden J.W., He Y., Hopkins F., Jiang L., Koven C., Jackson R.B., Jones C.D., Lara M.J., Liang J., Mcguire A.D., Parton W., Peng C., Randerson J.T., Salazar A., Sierra C.A., Smith M.J., Tian H., Todd-Brown K.E.O., Torn M., Groenigen K.J., Wang Y.P., West T.O., Wei Y., Wieder W.R., Xia J., Xu X., Xu X. & Zhou T. 2016. Toward more realistic projections of soil carbon dynamics by Earth system models. Global Biogeochemical Cycles 30, 40–56.
- Melton J.R. & Arora V.K. 2014. Sub-grid scale representation of vegetation in global land surface schemes: implications for estimation of the terrestrial carbon sink. Biogeosciences 11, 1021–1036.
- Miller P.C., Kendall R. & Oechel W.C. 1983. Simulating carbon accumulation in northern ecosystems. Simulation 40, 119–131.
- Mishra U., Drewniak B., Jastrow J.D., Matamala R.M. & Vitharana U.W.A. 2016. Spatial representation of organic carbon and active-layer thickness of high latitude soils in CMIP5 earth system models. Geoderma 300, 55–63.
- Mishra U., Jastrow J.D., Matamala R., Hugelius G., Koven C.D., Harden J.W., Ping C.L., Michaelson G.J., Fan Z., Miller R.M., McGuire A.D., Tarnocai C., Kuhry P., Riley W.J., Schaefer K.M., Schuur E.A.G., Jorgenson M.T. & Hinzman L.D. 2013. Empirical estimates to reduce modeling uncertainties of soil organic carbon in permafrost regions: a review of recent progress and remaining challenges. Environmental Research Letters 8. article no. 35020. doi:10.1088/1748-9326/8/3/035020.
- Mishra U. & Riley W.J. 2012. Alaskan soil carbon stocks: spatial variability and dependence on environmental factors. Biogeosciences 9, 3637–3645.
- Norwegian Polar Institute 2014a. Kartdata Svalbard 1:100 000. S100 Kartdata. Svalbard map data set available on the internet at https://data.npolar.no/dataset/645336c7-adfe-4d5a-978d-9426fe788ee3.
- Norwegian Polar Institute 2014b. Terrengmodell Svalbard. S0 Terrengmodell. Terrain model data set available on the internet at https://data.npolar.no/dataset/dce53a47-c726-4845-85c3-a65b46fe2fea.
- Oliva M., Vieira G., Pina P., Pereira P., Neves M. & Freitas M.C. 2014. Sedimentological characteristics of ice-wedge polygon terrain in adventdalen (Svalbard) environmental and climatic implications for the late Holocene. Solid Earth 5, 901–914.
- Palmtag J., Hugelius G., Lashchinskiy N., Tamstorf M.P., Richter A., Elberling B. & Kuhry P. 2015. Storage, landscape distribution, and burial history of soil organic matter in contrasting areas of continuous permafrost. Arctic, Antarctic, and Alpine Research 47, 71–88.
- Palmtag J., Ramage J., Hugelius G., Gentsch N., Lashchinskiy N., Richter A. & Kuhry P. 2016. Controls on the storage of organic carbon in permafrost soil in northern Siberia. European Journal of Soil Science 67, 478–491.
- Parmentier F.-J.W., Christensen T.R., Rysgaard S., Bendtsen J., Glud R.N., Else B., Van Huissteden J., Sachs T., Vonk J.E. & Sejr M.K. 2017. A synthesis of the Arctic terrestrial and marine carbon cycles under pressure from a dwindling cryosphere. Ambio 46, 53–69.
- Ping C.-L., Michaelson G.J., Jorgenson M.T., Kimble J.M., Epstein H., Romanovsky V.E. & Walker D.A. 2008. High stocks of soil organic carbon in the North American Arctic region. Nature Geoscience 1, 615–619.
- R Core Team 2016. R: a language and environment for statistical computing. Vienna: R Foundation for Statistical Computing.
- Salvigsen O. 1984. Occurrence of pumice on raised beaches and Holocene shoreline displacement in the inner Isfjorden area, Svalbard. Polar Research 2, 107–113.
- Sanchez P.A., Ahamed S., Carré F., Hartemink A.E., Hempel J., Huising J., Lagacherie P., McBratney A.B., McKenzie N.J., de Lourdes Mendonça-Santos M., Minasny B., Montanarella L., Okoth P., Palm C.A., Sachs J.D., Shepherd K.D., Vågen T., Vanlauwe B., Walsh M.G., Winowiecki L.A. & Zhang G.-L. 2009. Digital soil map of the world. Science 325, 680–681.
- Schuur E.A.G., McGuire A.D., Schädel C., Grosse G., Harden J.W., Hayes D.J., Hugelius G., Koven C.D., Kuhry P., Lawrence D.M., Natali S.M., Olefeldt D., Romanovsky V.E., Schaefer K., Turetsky M.R., Treat C.C. & Vonk J.E. 2015. Climate change and the permafrost carbon feedback. Nature 520, 171–179.
- Shaver G.R., Billings W.D., Chapin F.S., Giblin A.E., Nadelhoffer K.J., Oechel W.C. & Rastetter E.B. 1992. Global change and the carbon balance of Arctic ecosystems. BioScience 42, 433–441.
- Siewert M.B., Hanisch J., Weiss N., Kuhry P., Maximov T.C. & Hugelius G. 2015. Comparing carbon storage of Siberian tundra and taiga permafrost ecosystems at very high spatial resolution. Journal of Geophysical Research—Biogeosciences 120, 1973–1994.
- Tarnocai C. 2000. Carbon pools in soils of the Arctic, Subarctic and boreal regions of Canada. In R. Lal et al. (eds.): Global climate change and cold regions ecosystems. Pp. 91–103. Boca Raton, FL: CRC Press.
- Tarnocai C., Canadell J.G., Schuur E.A.G., Kuhry P., Mazhitova G. & Zimov S. 2009. Soil organic carbon pools in the northern circumpolar permafrost region. Global Biogeochemical Cycles 23, GB2023, doi: 10.1029/2008GB003327.
- Weiss N., Blok D., Elberling B., Hugelius G., Jørgensen C.J., Siewert M.B. & Kuhry P. 2016. Thermokarst dynamics and soil organic matter characteristics controlling initial carbon release from permafrost soils in the Siberian Yedoma region. Sedimentary Geology 340, 38–48.
- Worsley D. 2008. The post-Caledonian development of Svalbard and the western Barents Sea. Polar Research 27, 298–317.
- Yoshitake S., Uchida M., Ohtsuka T., Kanda H., Koizumi H. & Nakatsubo T. 2011. Vegetation development and carbon storage on a glacier foreland in the High Arctic, Ny-Ålesund, Svalbard. Polar Science 5, 391–397.