
ABSTRACT
Geovisualisation is a knowledge-intensive art in which both providers and users need to possess a wide range of knowledge. Current syntactic approaches to presenting visualisation information lack semantics on the one hand, and on the other hand are too bespoke. Such limitations impede the transfer, interpretation, and reuse of the geovisualisation knowledge. In this paper, we propose a knowledge-based approach to formally represent geovisualisation knowledge in a semantically-enriched and machine-readable manner using Semantic Web technologies. Specifically, we represent knowledge regarding cartographic scale, data portrayal and geometry source, which are three key aspects of geovisualisation in the contemporary web mapping era, coupling ontologies and semantic rules. The knowledge base enables inference for deriving the corresponding geometries and portrayals for visualisation under different conditions. A prototype system is developed in which geospatial linked data are used as underlying data, and some geovisualisation knowledge is formalised into a knowledge base to visualise the data and provide rich semantics to users. The proposed approach can partially form the foundation for the vision of web of knowledge for geovisualisation.
1. Introduction
Geovisualisation is a fundamental, core application of Geographic Information Systems (GIS), and a key enabler for the vision of Digital Earth (Goodchild et al. Citation2012). It allows users to explore, synthesise, present, and analyse the underlying geospatial data in an interactive manner. Geovisualisation is a knowledge-intensive art where both providers and users are required to possess substantial knowledge about how the geospatial data are visualised, and such knowledge pertains to a wide range of cartographic theories of scaling, portrayal (styles and symbols), etc. For the providers, the knowledge is required to derive sensemaking and cartographically satisfactory applications; for the users, the knowledge is required to interpret the presented data in a meaningful way. Sometimes the users need to reach a high level of cognitive consensus with the providers to better comprehend the information delivered from the geovisualisation applications (MacEachren Citation2004).
However, geovisualisation knowledge is usually embedded implicitly in complex programs or in the mind of cartographers, which renders the knowledge difficult to be transferred, interpreted, expanded, and reused. To this end, several efforts have been made to standardise the syntaxes used for storing and sharing visualisation information. For example, the Open Geospatial Consortium (OGC) proposed the styled layer descriptor (SLD) standard (Lupp Citation2007) to represent portrayal information, as used in, for example, the OGC web map service (WMS). However, such syntactic and structural standardisation lacks semantics (meaning of the information), which plays a pivotal role in knowledge representation and information interpretation. The lack of semantics increases the possibility of misinterpretation of the information (Decker et al. Citation2000; Fellah Citation2015). The semantic challenge of geovisualisation was also identified by Janowicz et al. (Citation2010), who regarded visualisation as a sink where semantics transferred through all the components of spatial data infrastructures (SDIs) has to be aggregated, interpreted and visualised in a meaningful way. For example, during visualisation, symbols bear abundant semantic information for the delivery of map content to users, and such semantics cannot be fully delivered by the SLD. Furthermore, syntactic approaches like the SLD are too bespoke, and rely on ad-hoc parsers, e.g. to parse the portrayal conditions; such a bespoke nature is also an obstacle in augmenting the transfer of visualisation knowledge to other domains, and its reuse.
Over the last decade, Semantic Web technologies have been increasingly adopted in the geospatial domain to address some long-standing issues, e.g. data integration and reuse (e.g. Schade and Smits Citation2012), and knowledge formalisation (e.g. Scheider, Ballatore, and Lemmens Citation2018). Consequently, the amount of geospatial data released as linked data is rapidly growing, a number of geo-ontologies have been designed, and the geospatial linked data query language GeoSPARQL has been standardised (Perry and Herring Citation2012). This trend fosters the need of representing the visualisation means for geospatial linked data. It also unveils a promising way to mitigate the abovementioned challenges of geovisualisation as the Semantic Web has inherent capacity to formally represent knowledge in a semantically-enriched manner, and such represented knowledge can foster semantic inference to diminish the need for ad-hoc parsers by instead utilising the versatile Semantic Web infrastructure. Moreover, the linked data paradigm provisions a mechanism for interlinking and consolidating distributed information, which produces an opportunity for visualising geospatial data reckoning on semantic and geometric information from diverse sources. These potentials imply the possibility for geovisualisation to move toward a knowledge-based approach.
The research questions that guide this study are: (1) How can a knowledge base for visualising geospatial linked data be designed? and (2) What are the advantages of the knowledge-based approach compared to other means of visualisation, e.g. using the SLD or procedural codes?
Knowledge-based geovisualisation with Semantic Web technologies implies using geospatial linked data as underlying data. Knowledge concerning how the data are visualised is formalised into a knowledge base consisting of ontologies and rules. Such a knowledge base guides the geovisualisation providers in producing satisfactory applications with formalised knowledge and semantic inference, and also enriches the knowledge represented to the users to ease their perception of map content, e.g. through a semantically-enriched legend with links and relevant resources. The knowledge bases can form part of a web of knowledge for geovisualisation, which would facilitate the transfer, reuse, and interpretation of such knowledge within the geospatial domain. This is also a way to augment the usage of such knowledge to other domains in various Digital Earth applications. For example, in the domain of disaster management, knowledge concerning how various geographic objects and events are visualised can be formalised and transferred across several sectors to foster mutual understanding; in the domain of heritage protection, knowledge transfer concerning how heritages are visualised on maps also plays an important role in cross-sector operations.
In this paper, we propose, develop, implement and evaluate a knowledge base in which geovisualisation knowledge is formally represented using ontologies and rules to enable knowledge-based geovisualisation, and to facilitate the transfer, interpretation, and reuse of the knowledge. The background and related work are presented in Section 2. Section 3 elaborates the formalisation of geovisualisation knowledge and the developed knowledge base. The experiments that evaluate the proposed methodology are presented in Section 4. The paper ends with a discussion (Section 5) and conclusions (Section 6).
2. Background and related work
2.1. Geospatial Semantic Web and linked data
The Semantic Web provides a common framework that allows data to be shared and reused across application, enterprise, and community boundaries (W3C Citation2013). The Semantic Web is underpinned by a collection of technologies. Linked data refers to a number of recommended best practices for exposing, sharing, and connecting pieces of data, information, and knowledge across the Semantic Web using Uniform Resource Identifiers (URIs) and Resource Description Framework (RDF). The applications of Semantic Web technologies have developed considerably in the geospatial domain in the last decade, and they have fostered a promising approach to connecting SDIs with mainstream IT to augment the application of geospatial data (Schade and Smits Citation2012). In this context, Vilches-Blázquez et al. (Citation2014) coined the term ‘Linked Digital Earth’ to represent the scenario where linked data empowers the vision of Digital Earth to facilitate geospatial data integration and retrieval.
With regard to the publication of geospatial linked data, Semantic Web researchers initially showcased the potential of linked data by transforming popular, third-party datasets to RDF, and then more linked data initiatives were run by governmental agencies and large-scale data infrastructures (Regalia et al. Citation2018). For instance, Ordnance Survey, the national mapping agency (NMA) in the UK, has released several geospatial datasets as linked data (Goodwin, Dolbear, and Hart Citation2008). In Europe, the e-Government and open data communities are increasingly adopting linked data approaches, and this has motivated the Joint Research Centre (JRC) of the European Commission to investigate the potentials of publishing INSPIRE-compliant data as linked data through the ARE3NA activities (INSPIRE Citation2017).
The increase in geospatial linked data has stimulated studies concerning techniques for visualising such data. The visualisation of linked data, in general, refers to techniques for visually presenting the links between entities to facilitate the intuitive discovery of underlying information and knowledge (Dadzie and Rowe Citation2011). For geospatial data, the spatial context is crucial for easing this perception and discovery process. Therefore, the visualisation of geospatial linked data is generally in the form of map mashups, in which the data are spatially presented as thematic data on top of various base maps. To this end, several tools for exploiting such data through visual and graphic interfaces have been developed. For instances, LOD4WFS (Jones et al. Citation2014) enables geospatial linked data to be queried through the web feature service (WFS) protocol and visualised in GIS programs. SexTant (Nikolaou et al. Citation2014) allows for visualising and browsing time-evolving geospatial linked data. Map4RDF (Leon et al. Citation2012) provides the possibility of editing the underlying data and connecting to statistical data. Nevertheless, these tools generally use predefined, hard-coded visualisation settings in their programs, and do not utilise a knowledge-based approach.
2.2. Knowledge representation using Semantic Web technologies
One prominent advantage of harnessing Semantic Web technologies is the inherent knowledge representation capacity equipped with the technology stack. Knowledge representation is a branch of symbolic artificial intelligence, which studies the formalisation of knowledge and its processing within machines (Grimm, Hitzler, and Abecker Citation2007). Since 1960s, the focus of knowledge representation has evolved through several stages, including general problem solver, expert systems, frame based languages, and rule-based systems, and currently one of the most active areas of knowledge representation research is the Semantic Web. The Semantic Web provisions us with the capacity for representing knowledge, supporting search queries on knowledge and inference. In the Semantic Web, knowledge is represented in different forms, and ontologies (description logics) and rules (horn logic) are the two main paradigms for knowledge representation (Hitzler and Parsia Citation2009).
Knowledge representation is a good means for precisely conveying long-term intended meaning for expressed information (Lauriault et al. Citation2007). Specifically, ontologies are controlled vocabularies that describe concepts and relations between concepts using well-understood formal constructs; such constructs formalise the intended meaning of the vocabularies and capture background knowledge about the domain (Horrocks Citation2008). Ontologies can be connected to further enrich the expressed semantics. Semantic rules are also grounded in formal logic and rich semantics; they can deduce further statements with explanations. Semantic rules are more manageable and understandable than procedural codes to lessen the semantic gap between different parties (Bassiliades Citation2018). In short, ontologies and rules can provide semantics to disambiguate the meaning of the information concerning how the geospatial data are visualised, and thus foster better transfer, interpretation, and reuse of such knowledge.
Knowledge representation using ontologies and rules has become increasingly prevalent in the geospatial domain, and studies on this subject span several research areas, e.g. visualisation, geoprocessing, semantic geospatial services, and information retrieval. For instance, Hofer et al. (Citation2017) developed a knowledge base to support the composition of geoprocessing workflow, in which ontologies were used to formalise the geooperators, and the Semantic Web rule language (SWRL) was used to formulate the rules associated with geooperator chaining. Scheider, Ballatore, and Lemmens (Citation2018) formalised both geoprocessing tools and the requirements from the users using ontologies and SPARQL CONSTRUCT queries. Falquet et al. (Citation2018) used ontologies and SPARQL CONSTRUCT queries to provide an abstract description for the process of geospatial linked data publication. Keßler, Raubal, and Wosniok (Citation2009) employed ontologies and SWRL rules for context-aware geographic information retrieval, where they used ontologies to organise semantically annotated data and rules for deriving inference for context detection. Gould and Mackaness (Citation2016) formalised knowledge for on-demand map generalisation using ontologies to facilitate the knowledge to be shared, expanded, and reused in the mapping systems.
2.3. Knowledge representation for geovisualisation
The idea of a map as a knowledge base of logical representations is intuitive in view of the implicit concepts and rules inherent in the maps (Kavouras and Kokla Citation2008). To this end, Varanka and Usery (Citation2018) proposed to semantically represent map content (raw geospatial features) using ontologies to form the knowledge base of maps. we argue that not only can the raw geospatial features be formally represented with this idea, but visualisation knowledge can also be formalised to enrich the knowledge base to clarify how raw data are converted to visualisations, and foster cross-domain and long-term understanding of the visualisations. In addition, several cartographic ontologies have been developed to model common cartographic concepts, e.g. for use in cartographic expert systems (see e.g. Iosifescu-Enescu and Hurni Citation2007; Smith Citation2010). However, such ontologies are more like taxonomies; no rule-based inference is enabled, and their models are not in line with the development of contemporary web-based geovisualisation applications.
Geovisualisation has a broad scope and involves multiple aspects of knowledge; from the visual perspective of contemporary web mapping, knowledge concerning cartographic scale, data portrayal and geometry source comprise the core of geovisualisation knowledge. Therefore, in this study, we focus mainly on the knowledge representation of these three aspects, and aim to develop a knowledge base to underpin knowledge-based visualisation.
The concept of scale resides at the very core of cartography and is essential to geovisualisation. It also plays a key role in knowledge representation and measurement (Goodchild and Proctor Citation1997). The modelling of cartographic scale is fundamental to enabling multiple representation of geospatial data, which is a prerequisite to deriving cartographically good visualisations. However, such knowledge is commonly modelled in an implicit way, e.g. by mapping agencies and cartographers. To address this issue, Carral et al. (Citation2013) designed an ontology for cartographic map scaling, which formalised scale information at the dataset level for representing the scale knowledge associated with geospatial datasets. Huang et al. (Citation2018) formalised the knowledge for both visualisation scales for geospatial features and the relations between thematic data and base maps using ontologies to enable geometrically self-adapting web maps.
The modelling of portrayal information is currently based on established standards, e.g. ISO 19117:2012 (ISO Citation2012), the SLD, symbol encoding (SE) (Müller Citation2006) (the SLD is commonly used in WMS, where it is used to link layers to portrayals, while the SE is used to define the portrayal in general; we mainly discuss the SLD in this paper, as they are very similar). The SLD is an XML-based markup language for modelling styles and symbols that are not intrinsically included in geospatial data. In practice, an SLD script is designed for a particular feature type and associated with specific geospatial layers; they must be processed by ad-hoc parsers in order to retrieve the visualisation methods. The SLD has limited capacity for expressing the semantics of the symbols, e.g. assuming a symbol is designed for heritage sites, a computer cannot know that this symbol may apply to a heritage building map. The SLD also has limitations regarding using distributed data, and it still is confined to the niche of layer-based geospatial data management. Moreover, the ad-hoc parsers for parsing the SLD are very few, and are embedded in complex programs, and the portrayal conditions (filters) are often translated to SQL queries so that specific underlying relational databases must be used. The bespoke nature is also revealed in the fact that different parsers handle the same SLD scripts differently (Andersson and Eklöf Citation2017).
In the context of linked data, it is worth revisiting portrayal information modelling and embracing a knowledge-based approach. This is also advocated by Janowicz et al. (Citation2010) and OGC Testbeds 11, 12, and 13 (Fellah Citation2015, Citation2017, Citation2018). The OGC Testbeds designed ontologies for portrayal information with the initial purpose of semantic mediation of multi-source portrayal data. The ontologies evolved in an SLD-inclined manner through the Testbeds. They mainly modularised the theories into four micro-theories (style, symbol, symboliser and graphic ontologies) to avoid enormous ontology and to underlay better reusability. These studies provide a solid ground for representing portrayal knowledge. In this study, we partially reuse the portrayal ontologies developed during the OGC Testbeds with substantial enrichment and improvement to develop a knowledge base for the representation of portrayal knowledge.
With regard to the geometry source, the linked data paradigm dramatically lowers the barriers to linking distributed data, mainly through the utilisation of URIs; data interlinking is also essential for creating valuable linked data (Berners-Lee Citation2009). Linked data interlinking has been performed for a number of geospatial linked datasets. For instance, the linked data gazetteer GeoNamesFootnote1 has been linked to DBpediaFootnote2; the LinkedGeoData (a linked data distribution of OpenStreetMap (OSM)) has been linked to GeoNames and United Nations Food and Agriculture Organization geospatial data (Stadler et al. Citation2012). Such interlinking brings up the opportunity for integrated visualisation. For instance, a dataset that has coarse (or even no) geometric information can be visualised with detailed geometries on maps through links with other datasets. This approach would benefit various geovisualisation applications, and thus the modelling of knowledge concerning which geometry source(s) is used for this visualisation application would be helpful in enhancing the visualisation knowledge base, particularly in a linked data environment.
3. Knowledge formalisation for geovisualisation
A knowledge-based approach for geovisualisation entails the employment of linked data as the underlying data model, and a knowledge base with knowledge of the means by which the data are visualised. In this section, we elaborate the representation of both geospatial data and visualisation knowledge. This section answers research question (1). The ontologies and example rules are available online.Footnote3
3.1. Vocabularies for representing geospatial data, metadata, and context
A number of vocabularies for geospatial data have been developed. The commonly used ones are the Basic Geo VocabularyFootnote4 and GeoSPARQL vocabulary. The GeoSPARQL vocabulary has become increasingly popular, as it allows for embedding spatial predicates in queries. The GeoSPARQL vocabulary is lightweight and represents only some fundamental concepts – essentially the concepts of feature and geometry; in this paper we use the prefixes geo and sf to represent the namespaces of GeoSPARQL vocabularyFootnote5 and its simple feature geometry part.Footnote6 Some other geospatial vocabularies with richer semantics and domain knowledge have been developed based on, or with interoperability for the GeoSPARQL vocabulary, e.g. the INSPIRE draft vocabularies.
In Europe, draft guidelines and vocabularies for representing INSPIRE geospatial data in RDF have been proposed, and most of the vocabularies are compatible with the GeoSPARQL query language through the reuse of certain predicates and subclass inheritance. In this study, we adopt the INSPIRE vocabularies that concern 2D buildings to represent geospatial data as linked data, and we showcase our approach through the visualisation of geospatial building data (cf. Section 4). Specifically, we mainly reuse the bu-base Footnote7 and bu-core2D Footnote8 vocabularies (cf. ).
The metadata for geospatial datasets is crucial for providing the context for the data. A common practice is to represent geospatial datasets with named graph(s). The named graph is a key concept of Semantic Web architecture, where a collection of RDF statements is organised in a graph with a URI for identification, allowing metadata to be associated with the dataset; the named graphs can also be treated as objects in triples. To this end, the JRC initiated a working group to develop an extension of the DCAT application profile for data portals in Europe (DCAT-APFootnote9), and this extension (GeoDCAT-APFootnote10) is used for describing geospatial datasets in this context. In this study, we use the developed GeoDCAT-AP as the vocabulary for metadata. Therefore, this work is also an investigation of the benefits obtained from these linked data development endeavours, with a particular focus on visualisation.
The visualisation of geospatial data can benefit from context information to adapt the results to the user’s current situation and personal preferences. Semantics plays a pivotal role in modelling context information (Keßler, Raubal, and Wosniok Citation2009). We aim to develop a knowledge-based approach for visualising geospatial data with context-awareness, i.e. an approach in which a computer is able to deduce different visualisation methods under different client visualisation situations. In this study, we model a lightweight visualisation context ontology with two types of context data: visualisation scale and visualisation phenomenon (theme). We create the class VisualisationContext, whose associated values (scale and phenomenon) are updated when the client requests data for visualisation, and these data are stored in a named graph as context information (for detailed usages, see Sections 3.3 and 3.4).
3.2. Formalisation of cartographic scale
A geospatial object can have multiple (geometric) representations with different levels of detail for a real geographic entity. The theory of multiple representation is one of the cornerstones in digital cartography era; representations with different levels of detail are visualised at different visualisation scales (zoom levels). The multiple representation of geospatial data can be organised in multiple representation databases (MRDBs, see e.g. Jones et al. Citation1996). Hahmann and Burghardt (Citation2010) compared MRDBs with linked data, and they identified several commonalities between these two technologies. They argued that the geospatial objects in both MRDBs and linked data consist of various representations, providing a set of different views of the same object. In this context, linked data eases the linking and reuse of representations of geospatial features.
Most vocabularies for representing geospatial data support the modelling of multiple representations. In the INSPIRE draft building vocabularies, an instance of the bu-core2d:Building can be linked to several instances of bu-base:BuildingGeometry2D through the object property bu-core2d:geometry2D to enable multiple representations (cf. ). However, the information for the cartographic scale in which the representations are rendered is not modelled in these vocabularies, and this is key information for multi-scale visualisation. In this study, we develop a vocabulary for formalising such knowledge (with the prefix cartographic-scale).
Figure 1. Diagram of the developed cartographic scale vocabulary. The vocabularies used for representing geospatial data are from INSPIRE draft vocabularies for 2D buildings. There can be multiple GeometrySet when the geometries are modelled in several levels of detail.
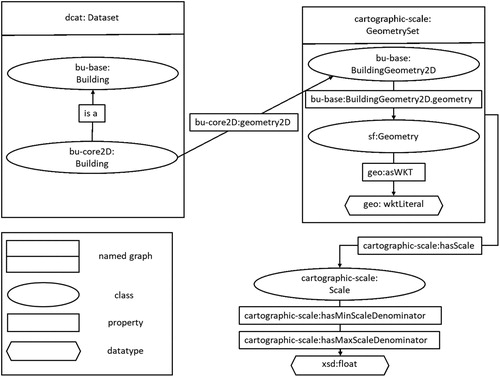
Unlike previous studies concerning the modelling of cartographic scales (cf. Carral et al. Citation2013; Huang et al. Citation2018), we model cartographic scales at the geometry set level. Specifically, geometric representations with the same level of detail usually have the same visualisation scales. According to this principle, we develop a cartographic scale vocabulary, where we introduce the concept GeometrySet, and encapsulate geometries with the same level of detail in a named graph of the type GeometrySet. In the meantime, a class CartographicScale is created, and each instance of this class can be linked to the visualisation scale through two datatype properties, hasMaxScaleDenominator and hasMinScaleDenominator; the object property hasScale is created to associate an instance of GeometrySet (a named graph) with instance(s) of CartographicScale. The cartographic scale information may be different when this knowledge is modelled by different providers and used for different applications. Hence, the metadata, e.g. the application field, is modelled by hasApplicationField (an object property whose range is skos:Concept), as well as SKOSFootnote11 and Dublin CoreFootnote12 vocabularies. illustrates these key concepts and their relations when employing INSPIRE draft building vocabularies for representing geospatial data.
3.3. Formalisation of data portrayal
The visual portrayal of geospatial data transforms raw information into an explanatory or decision-support tool, and plays an indispensable role in map content perception for users to make sense of the data (Müller Citation2006). The portrayal bears much semantic information for both information visualisation and retrieval. Janowicz et al. (Citation2010) proposed to semantically annotate the SLD to enrich the semantics and clarify the meaning of styles and symbols presented to users, and to facilitate the recommendation of styles for specific applications. This proposal was accomplished during the OGC Testbed 12, in which ontologies aligned with the SLD standard were developed. However, we argue that, in the linked data environment, a fully SLD-aligned modelling manner, particularly with regard to the modelling of portrayal rules, should be revisited.
Conditional portrayal is prevalent in geovisualisation, i.e. the symbol/symboliser used for visualising a feature depends on the visualisation scale and attribute/geometric data associated with the feature. In the SLD, portrayal rules are modelled by feature filtering using OGC Filter Encodings (ISO/TC211 Citation2009). The ontologies developed by OGC Testbeds also follow this mechanism; SPARQL ASK queries are recommended for modelling such conditions. However, this rule modelling approach has several limitations: (1) although SPARQL can be utilised for expressing rules in the Semantic Web, the queries on their own are not commonly accepted as rule modelling for knowledge representation and inference (W3C Citation2007), and thus this entails the development of ad-hoc parsers for the conditions; (2) the semantics could potentially be misinterpreted because SPARQL ASK constraints are generally used to check whether certain conditions currently hold in the linked data and thereby facilitating verification and inconsistency checks (Knublauch Citation2011). To address these limitations, we utilise rule-based inference, and thus augment the use of geospatial rules in other areas in mainstream IT.
Rules are a prominent modelling paradigm for the Semantic Web (Horrocks et al. Citation2005). They offer a simple model of knowledge representation for both domain experts and programmers. There are several approaches to rule modelling in the Semantic Web, and among them, SWRL rules have been used in several geospatial studies (cf. Section 2.2). The prevalence of SWRL is partly due to its support from the Protégé ontology editorFootnote13, and several rule engines and ontology reasoners. However, SWRL has some limitations in geospatial applications. First, SWRL adopts the open world assumption Footnote14, and thereof only supports monotonic semantics. In some geospatial applications, we need to tackle no data or voidable situations; for example, we cannot use SWRL to represent the rule: use this specific symboliser to symbolise the feature if the value of a particular attribute does not exist because this rule entails the handling of non-monotonic semantics. In contrast to SWRL, the object-oriented SPIN (SPARQL Inferencing Notation) rules, which combine concepts from object-oriented languages, SPARQL query language, and rule-based systems to model rules in the Semantic Web, has better expressiveness and several advantages in geospatial applications. For example, SPIN rules can address non-monotonic semantics, and readily allow spatial predicates to be embedded in the conditions within spatially enabled RDF stores (e.g. StardogFootnote15 and VirtuosoFootnote16). Therefore, we argue it is time for geospatial Semantic Web researchers to consider a transition from SWRL rules to SPIN rules (before its successor SHACLFootnote17 is better supported by tools). This rule modelling transition is also being advocated by some Semantic Web researchers; see e.g. Bassiliades (Citation2018). In this paper, we use SPIN rules (with the namespaces spin and sp; for details, see Knublauch (Citation2011)) to model the portrayal rules.
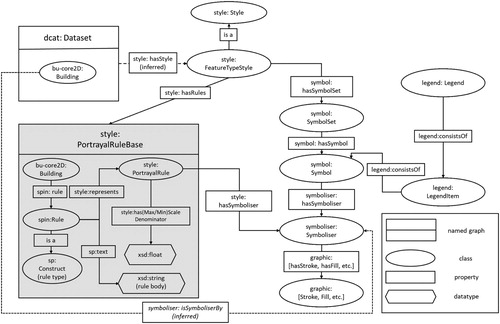
provides an overview of the portrayal knowledge base. We modularise the overall theory into five ontologies, i.e. style, symbol, symboliser, graphic, and legend ontologies; the symboliser and graphic ontologies are adopted from OGC Testbed 12; for details, see Fellah (Citation2017). A geospatial linked dataset can be associated with an instance of style: FeatureTypeStyle through the property style:hasStyle (this relation can be inferred based on semantic relations), the style: FeatureTypeStyle is associated with metadata, e.g. using style:hasApplicationField. A style:FeatureTypeStyle is associated with a portrayal rule base (a named graph whose type is style:PortrayalRuleBase), in which all the rules are represented as SPIN rules (spin:Rule); the rationale for encapsulating the rules into named graphs is that some RDF stores (e.g. Virtuoso) use the URIs of named graphs to identify the rules that are grouped in which named graphs should be invoked for inference. To facilitate data retrieval, each instance of spin:Rule is associated with an instance of style:PortrayalRule that is connected to the information about visualisation scale and the associated instance of symbol:Symbol (note these relations are modelled as the metadata of the rules and only for the purpose of information retrieval; the inference of SPIN rules relies only on the type and body of the rules). The instances of symbol:Symbol are connected to symbolisers and then graphic properties, e.g. the colours of stroke and fill; the graphic information is modelled in an SLD-aligned way. In the meantime, the symbol:Symbol instances are used to constitute a legend to enable the knowledge-based generation of map legends and map content retrieval. The labels of the instances in the legend ontology are used to generate the text in legend, and a number of properties, e.g. legend:represents (what the legend(item) represents in reality), as well as SKOS and Dublin Core vocabularies are used to model semantic information to facilitate the users interpretation of the map content.
Figure 2. Knowledge base for portrayal information. The grey shaded part is the rule base.
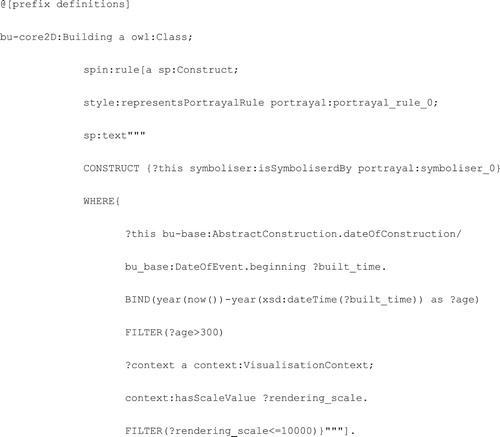
The SPIN rules are encapsulated in a named graph that is processed by the SPIN rule engine. Specifically, we use SPIN CONSTRUCT rules to infer the relation of symboliser:isSymboliserBy, and such a rule is attached to the concept describing the geospatial features (bu_core2D:Building in this case) due to the object-oriented nature of SPIN. In the main body of a SPIN rule, the inferred relations come first after the CONSTRUCT keyword, and the conditions come afterwards following the WHERE keyword. shows an example of a SPIN rule (in the syntax of TurtleFootnote18) which infers from the geospatial data and context data (rendering scale transferred from the client) to formulate the rule that if a building started to be built over 300 years ago, and the rendering scale is larger than 1:10,000, then use the symboliser_0 to symbolise the building. Furthermore, the FILTER NOT EXISTS can be used when it is necessary to deal with the no data situation, and spatial predicates (e.g. GeoSPARQL spatial predicates) can be used to develop spatial conditions in spatially enabled RDF stores.
Listing 1. An example of using SPIN rule to represent a portrayal rule in the Turtle syntax.
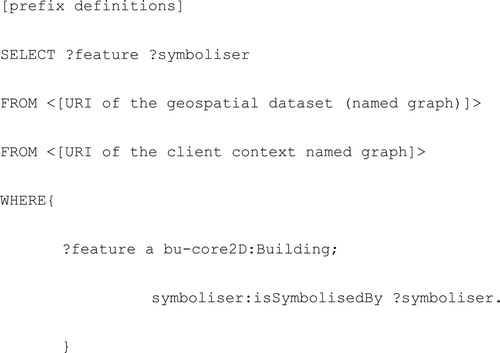
A set of rules can be created and associated with the class bu_core2D:Building to enable the usage of different symbols/symbolisers under different conditions. Such rules, when executed, would deduce how to symbolise each feature. The inferred relations can be retrieved through the SPARQL query in , which implies that although we define the portrayal rules and symbols only at the dataset level, the relations between features in the dataset and symbolisers are inferred.
Listing 2. The SPARQL query used to retrieve the inferred relations between features and symbolisers.
In addition, we develop a rule for finding appropriate styles according to the visualisation phenomenon; that is, if the visualisation phenomenon and the application field of a style are the same or have a relation among owl:sameAs, rdfs:subClassOf, skos:broader, and skos:exactMatch, then the rule-based inference would deduce that the style is applicable to the current visualisation context, and associate the instance of dcat:Dataset with style:FeatureTypeStyle through the inferred object property style:hasStyle.
3.4. Formalisation of geometry source for visualisation
The geometric representations contained in the geospatial data are one of the most important kinds of information for visualisation purposes. In traditional geovisualisation applications, generally only the geometries contained in the target dataset(s) are used. However, in the linked data environment, geospatial data are increasingly interlinked with each other and data from other domains. Hence, we can adopt an integrated visualisation strategy, that is, a strategy in which the visualisation of geospatial linked dataset relies on both the geometries modelled in its own dataset and geometries from other datasets. This is useful when the geometries modelled in the dataset are not sufficient or appropriate (mainly in terms of level of detail) for certain visualisation applications, then the visualisation could (partly) reckon on geometries from other linked datasets to foster better visualisation performance.
Therefore, the representation of knowledge concerning the geometry source(s) used for geovisualisation applications is important in this context. Such knowledge can also be represented by SPIN rules. Specifically, we develop a geometry source ontology (its prefix is denoted gs in this paper, and the core of it is demonstrated in ); a geospatial linked dataset can be associated with a GeometrySourceRuleBase instance (a named graph) (such an association can also be deduced through the same type of inference for style:hasStyle according to contextual information (cf. Section 3.3)), in which the SPIN rule(s) are used to represent the knowledge concerning which geometries should be used for visualisation under different conditions. Metadata are also modelled for instances of GeometrySourceRuleBase and spin:Rule for information retrieval, e.g. application field of the rule base. Furthermore, the property isVisualisedBy is defined to represent the relation between features and the geometries (in well-known text, WKT) used to present them, and this relation is inferred based on the rules.
Figure 3. Knowledge base of geometry source(s) used for geovisualisation. The grey shaded part is the rule base.
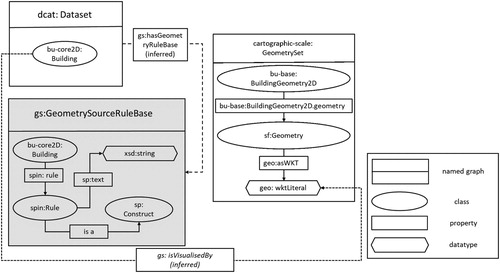
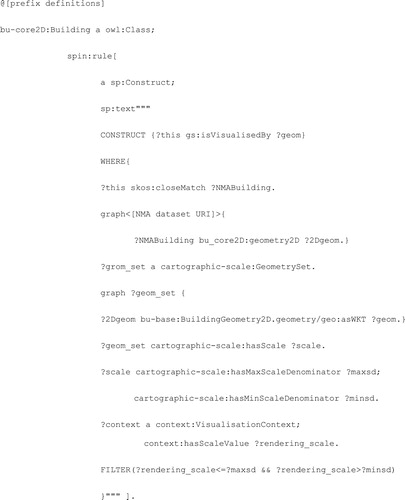
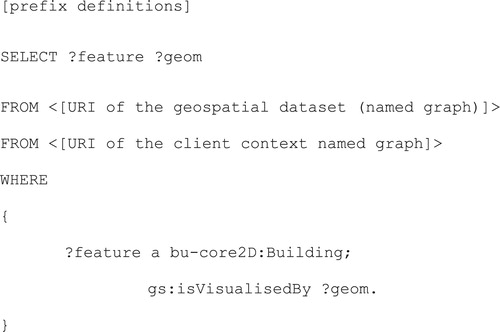
is an example of a rule that represents the geometry source information. In this example, there are two building datasets that are both modelled using INSPIRE draft building ontologies; one of them has only coarse geometries, and the other is from an NMA in which multi-scale geometries are stored. The features in these two datasets are linked through skos:closeMatch. The visualisation of the first dataset benefits from leveraging the geometries from the second dataset, thus the rule formulates the knowledge that the features are visualised by the multi-scale geometries from the NMA dataset. The rule is also scale-aware, i.e. it infers that different geometries should be rendered for features at different visualisation scales (the visualisation scale transferred from the clients). A set of such rules can be defined to specify that different geometry sources are used under different conditions, and the inferred relations between the features and geometries used for visualisation in WKT can be retrieved through the SPARQL query in . If the two datasets are distributed, the keyword SERVICE can be used to retrieve geometries from their distributed sources.
Listing 3. An example SPIN rule that represents the source of geometries used for visualisation in Turtle syntax. This rule formulates that multi-scale geometries in another dataset are used to render the features in this dataset, and the cartographic scale information modelled in that multi-scale dataset applies.
Listing 4. The SPARQL query used to retrieve the inferred relations between features and geometries used for visualisation.
4. Experimentation and evaluation
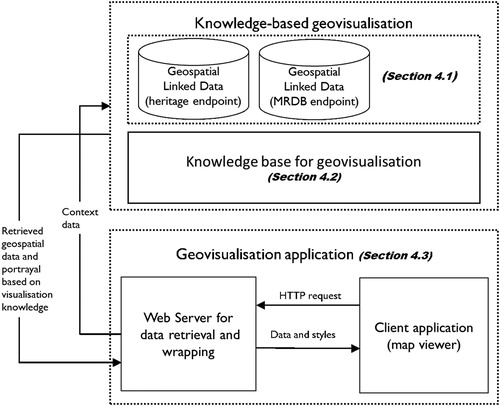
We test our knowledge-based approach for geovisualisation in a case study for visualising heritage building maps. demonstrates the abstract system architecture of the approach. The architecture comprises three components: data (distributed linked data from two endpoints), a knowledge base and a geovisualisation application (for presenting the visualisation). We implemented all three components in a distributed architecture in line with the vision of web of knowledge for geovisualisation. The implementation details for each part are described in the following sub-sections.
Figure 4. Abstract system architecture of knowledge-based geovisualisation. The corresponding sub-section of each component is annotated in the figure.
4.1. Data
The study area was central Stockholm, Sweden, and three geospatial datasets (originally all in shapefiles) were used in the experiment (please note that due to licensing reasons, we are not permitted to publish the data):
A heritage building thematic dataset from Riksantikvarieämbetet (Swedish National Heritage Board). In this dataset, all recorded heritage buildings in Sweden are available as point features, namely a single point is used to represent each building. For most of the heritage buildings, construction time is recorded, while for some buildings, such information is missing.
A building map with detailed geometries from Lantmäteriet (Swedish NMA), in which all the buildings are represented by detailed polygons.
Another building map with coarse geometries from Lantmäteriet, where large and prominent buildings are represented by coarser geometries than in the previous dataset; other buildings (the small ones) are not present in this dataset. This dataset is used for visualising the buildings on small scale maps.
First, we created an MRDB from datasets ii and iii using the spatial join operation in ArcGIS Pro 2.0.0, and the matched (joined) features were manually checked to ensure each matched pair was semantically correct (we did not consider the aggregated buildings in dataset iii; as a proof-of-concept, we employed this semi-automatic matching approach, although more sophisticated methods do exist, see e.g. Zhang et al. (Citation2014); Zhu et al. (Citation2017)). The created MRDB consisted of a number of geospatial features, some of which had two geometries, while others had one geometry. The MRDB was then transformed to RDF according to the ontologies for geospatial data and metadata (see Section 3.1) using R2RMLFootnote19 transformations supported by ontop.Footnote20 The geometries with the same level of detail were organised in a geometry set (a named graph). The transformed data were exposed through a SPARQL endpoint provided by Stardog (denoted MRDB endpoint hereinafter).
Afterward, we matched datasets i and ii using the same matching method as in the previous step; that is, each heritage building was matched to its corresponding feature in the building dataset from Lantmäteriet. The dataset i was then transformed to RDF according to INSPIRE draft building vocabularies using R2RML transformations, and the matched features in datasets i and ii were associated by the property skos:closeMatch. The transformed dataset i (including the matching relations with dataset ii) was exposed through another SPARQL endpoint provided by Stardog (denoted heritage endpoint hereinafter).
4.2. Knowledge base for geovisualisation
The cartographic scale information was formalised for the datasets from Lantmäteriet (the datasets ii and iii) as metadata for GeometrySet, such information was taken from the recommendations in Lantmäteriet, in which dataset ii is visualised in large-scale maps, and iii is visualised in small-scale maps. The modelled cartographic scale information was exposed along with the metadata of the MRDB through the MRDB endpoint.
The knowledge for data portrayal was represented using ontologies and rules (cf. Section 3.3). Specifically, a number of rules were defined to formulate that at different visualisation scales, buildings are symbolised differently according to their ages. Several rules are also defined to form the knowledge about the geometry source and enable inferences concerning the geometries used for visualisation; specifically, in large-scale visualisations, detailed geometries from dataset ii were used; at the small scales, coarse polygon geometry was used if it is available for a heritage building (cf. ), otherwise point geometry from dataset i was used. The portrayal rules were dependent on the geometry source rules because different symbolisers applied according to the types of geometry (point or polygon). The knowledge base for data portrayal and geometry source had the application field dbpedia:Historic_sites_in_Sweden. Footnote21 All the semantic rules are stored in Turtle files and can be found online.Footnote22 The knowledge base was implemented using the RDF API JenaFootnote23 and the Topbraid SPIN APIFootnote24 (SPIN rule engine). The knowledge base was also implemented as a web service using the Java web framework Spring Boot.Footnote25 This service retrieves data from the two linked data endpoints in a federated manner, which is formulated in the semantic rules.
4.3. Geovisualisation application
We developed a geovisualisation application that was empowered by geospatial linked data and the geovisualisation knowledge base. The application was web-based; its backend is a Python server using the web framework DjangoFootnote26, and the frontend was developed in HTML and JavaScript employing LeafletFootnote27 for map visualisation.
In real-time, the frontend sends HTTP requests wrapping the visualisation context in the application to the backend server (the phenomenon to visualise is dbpedia:Listed_buildings_in_Sweden Footnote28, which means heritage buildings in Sweden, and has the skos:broader relation with dbpedia:Historic_sites_in_Sweden), and the backend server updates the context information in a named graph in the knowledge base through the SPARQL UPDATE protocol.Footnote29The server then retrieves the geospatial data and the symbolisers that are used to symbolise the data (mainly by exposing the SPARQL queries in and to the knowledge base). A lightweight parser is embedded in the backend server to obtain associated e.g. CSS data from the symbolisers. Features and parsed symbolisers are then sent to the frontend, and the features are visualised accordingly. Moreover, the semantically-enriched legend can also be retrieved and visualised in the frontend map to help the users understand the map content.
4.4. Result and evaluation
Knowledge-based geovisualisation can be evaluated with two competency questions:
What geometry should be used to render each feature?
What symboliser should be used to symbolise each feature?
These two questions can be answered by exposing the SPARQL queries in Listings and , respectively. The derived answers are context-aware. The queries are simple, because the complex logic lies in the ontologies and rules, e.g. an appropriate style is chosen based on semantic relations; different symbolisers apply depending on the attribute information, visualisation scale, and geometry type; different and distributed geometries are used according to the visualisation scale and the availability of multiple representations for the geospatial objects.
We also evaluated the approach using the visualisation results presented in the frontend application (). (a) shows the heritage building map at a large scale in the area of Gamla Stan (old town, the very centre of Stockholm). In this visualisation, the base map is OSM served through the Mapbox API.Footnote30 The heritage buildings are represented by the detailed geometries from dataset ii, and the features are rendered with different colours according to their ages. The ages are derived from the construction time of the heritage buildings recorded in dataset i, i.e. this visualisation utilises the semantic information (construction time) from one dataset and detailed geometric information from another distributed dataset. The legend presented in the map is created automatically according to the legend information in the knowledge base. Moreover, the features for which construction time information is missing are also successfully rendered on the map with the corresponding colour, and this indicates that the rule with non-monotonic semantics (the rule containing the keyword FILTER NOT EXISTS in the conditions) is effectively handled by the rule engine. (b) shows the heritage building map at a small scale in a large area of central Stockholm (including Gamla Stan in the dashed rectangle). In this visualisation, the large buildings are represented by coarse polygon geometries from dataset iii, and the small buildings are represented by point geometries from dataset i (with the same colours that indicate building age). Such a combined use of distributed geometry sources is formalised in the SPIN rules, and the application simply exposes the SPARQL query in to obtain the distributed multi-source geometries for visualisation. The small-scale map gives the map readers a rough sense of how the city expanded in terms of the ages of its heritage buildings. In this way, we observe that the city expanded roughly from Gamla Stan to its surroundings, and the buildings by the water are generally older than others.
Figure 5. Heritage building maps in central Stockholm underpinned by the knowledge-based geovisualisation. The base map is OSM, and the ages are calculated based on the beginning time of the construction of (part of) each building.
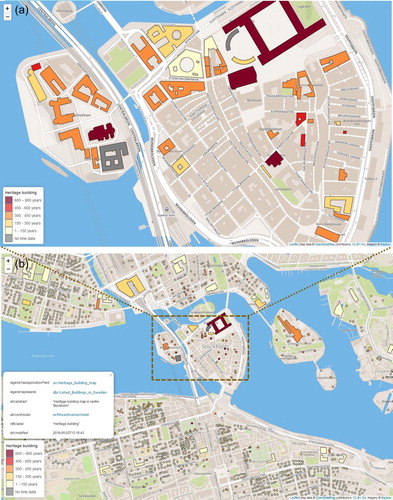
Furthermore, in (b), the enriched semantics of the legend is shown. The knowledge-based legend provides rich semantics that is organised according to the legend ontology (cf. Section 3.3 and ). In the application, the information shows in a pop-up as the user clicks the legend title. The pop-up provides the meaning of heritage building in Sweden, the providers of such information, and so forth; for instance, the legend is associated with the general knowledge base DBpedia’s entry Listed buildings in Sweden to help the users to explore and understand the map content.
4.5. Comparison with other geovisualisation means
The answer to research question (2) was determined with the experiment and evaluation. Although our knowledge-based approach shares some similar design principles with the SLD in terms of the data portrayal, they are fundamentally different. The SLD is confined to the niche of layer-based geospatial data organisation, and is unable visualise data in an integrated and distributed way. For instance, in the small-scale map in (bottom view), the buildings are coloured differently depending on the attribute from one dataset, while the geometries depend on mixed data from two distributed datasets. Such mixed use of semantic and geometric information can be very challenging using the current OGC technology stack, as WMS and WFS do not support federated distributed data retrieval (Zhao, Zhang, and Li Citation2017) and multiple representations, and the SLD uses a fixed type of symboliser for certain layers (e.g. applying point symbolisers to an entire dataset; the knowledge-based approach is able to assign different types of symbolisers according to the types of the retrieved geometries). Furthermore, the knowledge-based approach substantially reduces the need for ad-hoc parsers for the SLD, as the ontologies and rules are grounded in W3C recommendations (including OWL, RDFS, SPARQL, etc.), which lowers the barrier for the main stream IT community to utilise the geospatial (visualisation) knowledge; this is also in line with the data-centric vision in the IT world. More importantly, the enriched semantics (in contrast to the informal and inexplicit semantics modelled in the SLD) provided by our approach eases the interpretation of information by machines, which is illustrated, e.g. through automated and context-aware style/symbol selection (as shown in this study); it also provides a concrete basis for lifting semantic harmonisation from the data level to the visual level (cf. Karam et al. Citation2011). Furthermore, users also benefit from enriched semantics, e.g. through the semantically enriched legend, which can be hardly implemented using the SLD.
Using procedural codes (e.g. using a JavaScript mapping library) is an efficient way to develop visualisations, whereas how the data are visualised is not explicitly represented, and is difficult to transfer and interpret, especially by non-developers. Our approach substantially alleviates this issue.
5. Discussion
In this paper, we propose a knowledge-based approach for geovisualisation utilising Semantic Web technologies, in which the knowledge concerning cartographic scale, data portrayal and geometry source is represented using ontologies and rules. The represented knowledge can contribute to the foundation for a web of knowledge for geovisualisation, i.e. a distributed knowledge base to provide guidance for geovisualisation, and to facilitate the understanding of the visualisations and thus better reveal the potential for decision-making. The web of knowledge for geovisualisation can be used as a geovisualisation enablement layer for the linked open data (LOD) cloud to foster sensemaking and cartographically satisfactory visualisations for the increasing geospatial data available in the LOD cloud.
In this study, we discuss and compare our approach with the SLD and procedural codes and illustrate some advantages (see Section 4.5); this does not mean that we believe the latter two methods will become totally obsolete, and there certainly exist scenarios that they are better adapted to. For example, web developers would be more likely to choose JavaScript libraries. We argue that the knowledge-based approach is more suitable for long-term and cross-domain information transfer and preservation in scenarios such as heritage protection and disaster management, where the visualisations need to be understood by several domains and sectors. Also, for developing visualisations using geospatial linked data, our approach is more appropriate as they stem from the same technology stack.
We believe the presented approach is more friendly for cartographers. Nowadays, the geovisualisation is, in fact, majorly developed by web developers, who sometimes do not possess much cartographic knowledge. Cartographers have to learn rapidly evolving web development techniques to arm the visualisations with their knowledge. With our approach, cartographers could work with domain knowledge modelled in the ontologies and rules, not directly with web development codes, which makes a step forward of moving the visualisation development back to cartographers, who are more (likely to be) competent for mapping.
The knowledge-based approach builds on the premise that the geospatial linked data are interlinked, which is an essential and sometimes expensive work. This is in line with the long-standing research theme of geospatial data matching, which can be difficult especially for complex geometries (e.g. polygon, multi-polygon, etc.). In this regard, the knowledge graph embedding technique (see Wang et al. (Citation2017) for a survey) provides a promising way to facilitate the interlinking of geospatial linked data.
For geospatial data in conventional data models, e.g. PostGIS, our approach can also apply, as the data can be mapped to RDF using e.g. R2RML mapping, the mapped data can be retrieved and queried as virtual RDF graphs. The virtual RDF graph technique is also well-supported by various tools, e.g. Ontop.
A shift in the geospatial domain is underway today: from the creation and maintenance of data, to the creation and maintenance of knowledge as the primary source of value, a.k.a. a transition from SDIs to SKIs (spatial knowledge infrastructures) (Duckham et al. Citation2017). The SKIs are massively underpinned by Semantic Web technologies. The vision of SKIs is to automatically create, share, curate, deliver, and use knowledge (beyond and not only data or information). To this end, our approach is a way to address the representation of knowledge for visualisation in the SKIs, and such knowledge can also enable context-aware visualisation according to user’s specific context, such as previous analysis types and visualisation preference. In order to achieve this goal, we need to incorporate and model more user context data and metadata for the geovisualisation knowledge base to gauge users’ purpose and preference, which is a potential future work for this work.
6. Conclusions
This article proposes a knowledge-based approach for geovisualisation in the contemporary web mapping era. We design and implement a knowledge base comprising ontologies and semantic rules to formally represent geovisualisation knowledge in a semantically-enriched and machine-readable manner; the ontologies are mostly dependent on state-of-the-art vocabularies, e.g. GeoSPARQL and INSPIRE draft vocabularies. An architecture for knowledge-based geovisualisation is proposed and a prototype is implemented. A case study using our approach is presented, in which the thematic data for heritage building maps in central Stockholm, Sweden are visualised using the knowledge-based approach.
One incentive of our work is to develop a method for describing the visualisation of geospatial data that are available as linked data. Our approach accomplishes this goal, and such information can be released to the LOD cloud to underlay a web of knowledge for geovisualisation, and thus becomes more sharable.
Other advantages of our approach have been unveiled in this study. It is semantically enriched compared with current syntactic methods (e.g. the SLD), and facilitates the clarification of the meaning and selection of the styles and symbols. Furthermore, the enriched semantics is able to foster semantic integration at the visual level for geospatial information. The richer semantics makes the information easier to interpret and reuse, and eases understanding by visualisation end users. Compared with the state-of-the-art OGC technology stack, our approach enables distributed data retrieval, and thus visualisation, and also supports multiple representations for geospatial features. In the case study, the enriched semantics facilitates the style and symbol selection; the distributed geometric multiple representations foster better visualisation performance; the users benefit from the semantically-enriched legend to better perceive the visualisations.
We believe our approach can also facilitate domain experts (cartographers) to develop geovisualisation, as they will be able to work directly with domain knowledge rather than procedural codes.
Acknowledgments
We thank the editor and the three anonymous reviewers for their comments that helped to improve the quality of the article. We would also like to thank Dr. Carsten Keßler at Aalborg University Copenhagen for his insightful comments and suggestions, and Dr. Oleg Mirzov, Dr. Ali Mansourian and Eiður Eiðsson at Lund University for their advice. We also thank Lantmäteriet and Riksantikvarieämbetet for providing the geospatial data used in this study.
Disclosure statement
No potential conflict of interest was reported by the authors.
Correction Statement
This article has been republished with minor changes. These changes do not impact the academic content of the article.
Additional information
Funding
Notes
References
- Andersson, M., and M. Eklöf. 2017. “Stilsättning av geografiska data.” Master thesis in Geographic Information Technology at Lund University, Sweden. https://lup.lub.lu.se/student-papers/search/publication/8914527.
- Bassiliades, N. 2018. “SWRL2SPIN: Converting SWRL to SPIN.” Proceedings of the Doctoral Consortium and Challenge at RuleML+RR 2018 Hosted by 2nd International Joint Conference on Rules and Reasoning, edited by W. Faber, P. Fodor, G. D. Gasperis, A. Giurca, and K. Teymourian, Vol. 2204, CEUR.
- Berners-Lee, T. 2009. “Linked Data: Design Issues.” http://www.w3.org/DesignIssues/LinkedData.
- Carral, D., S. Scheider, K. Janowicz, C. Vardeman, A. A. Krisnadhi, and P. Hitzler. 2013. “An Ontology Design Pattern for Cartographic Map Scaling.” In The Semantic Web: Semantics and Big Data, edited by P. Cimiano, O. Corcho, V. Presutti, L. Hollink, and S. Rudolph, 76–93. Berlin, Heidelberg: Springer.
- Dadzie, A., and M. Rowe. 2011. “Approaches to Visualising Linked Data: A Survey.” Semantic Web 2 (2): 89–124. doi:10.3233/SW-2011-0037.
- Decker, S., S. Melnik, F. V. Harmelen, D. Fensel, M. Klein, J. Broekstra, M. Erdmann, and I. Horrocks. 2000. “The Semantic Web: The Roles of XML and RDF.” IEEE Internet Computing 4 (5): 63–73.
- Duckham M., L. Arnold, K. Armstrong, D. McMeekin, and D. Mottolini. 2017. “Towards a Spatial Knowledge Infrastructure.” https://www.crcsi.com.au/assets/Program-3/CRCSI-Towards-Spatial-Knowledge-Whitepaper-web-May2017.pdf.
- Falquet, G., C. Metral, S. Ozainne, and G. Giuliani. 2018. “An Abstract Specification Technique for the Publication of Linked Geospatial Data.” 21th AGILE conference on Geographic Information Science, Lund, Sweden, June 12–15.
- Fellah, S. 2015. “OGC Testbed-11 Symbology Mediation Engineering.” Open Geospatial Consortium. https://portal.opengeospatial.org/files/?artifact_id=64385.
- Fellah, S. 2017. “Testbed-12 Semantic Portrayal, Registry and Mediation Engineering Report.” Open Geospatial Consortium. http://docs.opengeospatial.org/per/16-059.html.
- Fellah, S. 2018. “OGC Testbed-13: Portrayal Engineering Report.” Open Geospatial Consortium. http://docs.opengeospatial.org/per/17-045.html.
- Goodchild, M. F., H. Guo, A. Annoni, L. Bian, K. de Bie, F. Campbell, M. Craglia, et al. 2012. “Next-generation Digital Earth.” Proceedings of the National Academy of Sciences 109 (28): 11088–11094. doi:10.1073/pnas.1202383109.
- Goodchild, M. F., and J. Proctor. 1997. “Scale in a Digital Geographic World.” Geographical and Environmental Modelling 1: 5–24.
- Goodwin, J., C. Dolbear, and G. Hart. 2008. “Geographical Linked Data: The Administrative Geography of Great Britain on the Semantic Web.” Transactions in GIS 12 (s1): 19–30. doi:10.1111/j.1467-9671.2008.01133.x.
- Gould, N., and W. Mackaness. 2016. “From Taxonomies to Ontologies: Formalizing Generalization Knowledge for On-demand Mapping.” Cartography and Geographic Information Science 43 (3): 208–222. doi:10.1080/15230406.2015.1072737.
- Grimm, S., P. Hitzler, and A. Abecker. 2007. “Knowledge Representation and Ontologies.” In Semantic Web Services: Concepts, Technology and Applications, edited by R. Studer, S. Grimm, and A. Abecker, 51–106. Heidelberg: Springer.
- Hahmann, S., and D. Burghardt. 2010. “Linked Data-a Multiple Representation Database at Web Scale?” Proceedings of the 13th ICA workshop on generalisation and multiple representation, Zürich, Switzerland, September 12–13.
- Hitzler, P., and B. Parsia. 2009. “Ontologies and Rules.” In Handbook on Ontologies, 111–132. Berlin, Heidelberg: Springer.
- Hofer, B., S. Mäs, J. Brauner, and L. Bernard. 2017. “Towards a Knowledge Base to Support Geoprocessing Workflow Development.” International Journal of Geographical Information Science 31 (4): 694–716. doi:10.1080/13658816.2016.1227441.
- Horrocks, I. 2008. “Ontologies and the Semantic Web.” Communications of the ACM 51 (12): 58–67.
- Horrocks, I., B. Parsia, P. Patel-Schneider, and J. Hendler. 2005. “Semantic Web Architecture: Tack or Two Towers?” Principles and Practice of Semantic Web Reasoning, Springer.
- Huang, W., A. Mansourian, E. Abdolmajidi, H. Xu, and L. Harrie. 2018. “Synchronising Geometric Representations for Map Mashups Using Relative Positioning and Linked Data.” International Journal of Geographical Information Science 32 (6): 1117–1137. doi:10.1080/13658816.2018.1441416.
- INSPIRE. 2017. “Linking INSPIRE Data: Draft Guidelines and Pilots.” https://inspire.ec.europa.eu/news/linking-inspire-data-draft-guidelines-and-pilots.
- Iosifescu-Enescu, I., and L. Hurni. 2007. “Towards Cartographic Ontologies or” How Computers Learn Cartography.” Proceedings 23rd International Cartographic Conference, Moscow, Russia, August 4–10.
- ISO. 2012. ISO 19117:2012 – Geographic Information – Portrayal. Geneva: International Organization for Standardization.
- ISO/TC211. 2009. ISO/DIS 19143: Geographic Information – Filter Encoding. Geneva: International Standards Organization.
- Janowicz, K., S. Schade, A. Bröring, C. Keßler, P. Maué, and C. Stasch. 2010. “Semantic Enablement for Spatial Data Infrastructures.” Transactions in GIS 14 (2): 111–129. doi:10.1111/j.1467-9671.2010.01186.x.
- Jones, C. B., D. B. Kidner, L. Q. Luo, G. L. I. Bundy, and J. M. Ware. 1996. “Database Design for a Multi-Scale Spatial Information System.” International Journal of Geographical Information Systems 10 (8): 901–920. doi:10.1080/02693799608902116.
- Jones, J., W. Kuhn, C. Keßler, and S. Scheider. 2014. “Making the Web of Data Available Via Web Feature Services.” Connecting a Digital Europe Through Location and Place, 341–361, Springer.
- Karam, R., F. Favetta, R. Kilany, and R. Laurini. 2011. “Location and Cartographic Integration for Multi-providers Location Based Services.” In Advances in Cartography and GIScience, 1 vol., 365–383. Berlin, Heidelberg: Springer.
- Kavouras, M., and M. Kokla. 2008. Theories of Geographic Concepts: Ontological Approaches to Semantic Integration. Boca Raton, FL: CRC Press.
- Keßler, C., M. Raubal, and C. Wosniok. 2009. “Semantic Rules for Context-aware Geographical Information Retrieval.” European Conference on Smart Sensing and Context, 77–92, Springer, Berlin, Heidelberg.
- Knublauch, H. 2011. “Spin-modeling vocabulary.” W3C Member Submission. https://www.w3.org/Submission/spin-modeling/.
- Lauriault, Tracey P., Barbara L. Craig, D. R. Fraser Taylor, and Peter L. Pulsifer. 2007. “Today’s Data are Part of Tomorrow’s Research: Archival Issues in the Sciences.” Archivaria 64: 123–179.
- Leon, A. D., F. Wisniewki, B. Villazón-Terrazas, and O. Corcho. 2012. “Map4rdf-Faceted Browser for Geospatial Datasets.” Proceedings of the First Workshop on Using Open Ddata, W3C, Brussels, Belgium, June 19–20.
- Lupp M. 2007. “OGC Implementation Specification 05-078r4: Styled Layer Descriptor Profile of the Web Map Service Implementation Specification.” Open Geospatial Consortium. http://portal.opengeospatial.org/files/?artifact_id=22364.
- MacEachren, A. M. 2004. How Maps Work: Representation, Visualization, and Design. New York: Guilford Press.
- Müller, M. 2006. “Symbology Encoding Implementation Specification 05-077r4.” Open Geospatial Consortium. http://portal.opengeospatial.org/files/?artifact_id=16700.
- Nikolaou, C., K. Kyzirakos, K. Bereta, K. Dogani, S. Giannakopoulou, P. Smeros, G. Schwarz, et al. 2014. “Improving Knowledge Discovery from Synthetic Aperture Radar Images Using the Linked Open Data Cloud and Sextant.” Proceedings of ESA-EUSC-JRC 2014-9th Conference on Image Information Mining Conference: The Sentinels Era, 63–66.
- Perry, M., and J. Herring. 2012. “OGC GeoSPARQL – A Geographic Query Language for RDF Data.” Open Geospatial Consortium. https://portal.opengeospatial.org/files/?artifact_id=47664.
- Regalia, B, K. Janowicz, G. Mai, D. Varanka, and E. L. Usery. 2018. “GNIS-LD: Serving and Visualizing the Geographic Names Information System Gazetteer as Linked Data.” European Semantic Web Conference, 528–540, Springer, Cham.
- Schade, S., and P. Smits. 2012. “Why Linked Data Should not Lead to Next Generation SDI.” Geoscience and remote sensing symposium (IGARSS), 2894–2897, IEEE.
- Scheider, S., Andrea Ballatore, and R. Lemmens. 2018. “Finding and Sharing GIS Methods Based on the Questions They Answer.” International Journal of Digital Earth. Advance online publication. doi:10.1080/17538947.2018.1470688.
- Smith, R. A. 2010. “Designing a Cartographic Ontology for Use with Expert Systems.” Proceedings of A Special Joint Symposium of ISORS Technical Commission IV & AutoCarto in Conjunction with ASPRS/CaGIS 2010 Fall Specialty Conference, Orlando, FL, November 15–19.
- Stadler, C., J. Lehmann, K. Höffner, and S. Auer. 2012. “Linkedgeodata: A Core for a Web of Spatial Open Data.” Semantic Web 3 (4): 333–354. doi:10.3233/SW-2011-0052.
- Varanka, Dalia E., and E. Lynn Usery. 2018. “The Map as Knowledge Base.” International Journal of Cartography 4 (2): 201–223. doi:10.1080/23729333.2017.1421004.
- Vilches-Blázquez, Luis M., Boris Villazón-Terrazas, Oscar Corcho, and Asunción Gómez-Pérez. 2014. “Integrating Geographical Information in the Linked Digital Earth.” International Journal of Digital Earth 7 (7): 554–575. doi:10.1080/17538947.2013.783127.
- W3C. 2007. “RDF Data Access WG Charter.” World Wide Web Consortium (W3C). https://www.w3.org/2003/12/swa/dawg-charter.
- W3C. 2013. “W3C Semantic Web Activity.” World Wide Web Consortium (W3C). https://www.w3.org/2001/sw/.
- Wang, Q., Z. Mao, B. Wang, and L. Guo. 2017. “Knowledge Graph Embedding: A Survey of Approaches and Applications.” IEEE Transactions on Knowledge and Data Engineering 29 (12): 2724–2743.
- Zhang, X., T. Ai, J. Stoter, and X. Zhao. 2014. “Data Matching of Building Polygons at Multiple Map Scales Improved by Contextual Information and Relaxation.” ISPRS Journal of Photogrammetry and Remote Sensing 92: 147–163. doi:10.1016/j.isprsjprs.2014.03.010.
- Zhao, T., C. Zhang, and W. Li. 2017. “Adaptive and Optimized RDF Query Interface for Distributed WFS Data.” ISPRS International Journal of Geo-Information 6 (4): 108. doi:10.3390/ijgi6040108.
- Zhu, Y., A. X. Zhu, J. Song, J. Yang, M. Feng, K. Sun, J. Zhang, Z. Hou, and H. Zhao. 2017. “Multidimensional and Quantitative Interlinking Approach for Linked Geospatial Data.” International Journal of Digital Earth 10 (9): 923–943. doi:10.1080/17538947.2016.1266041.