
 ?Mathematical formulae have been encoded as MathML and are displayed in this HTML version using MathJax in order to improve their display. Uncheck the box to turn MathJax off. This feature requires Javascript. Click on a formula to zoom.
ABSTRACT
This study investigates the effects of glacial lakes on the flow velocities of Duiya Glacier, southern Tibetan Plateau, by employing satellite Synthetic Aperture Radar (SAR) Pixel-Offset-Tracking Small-Baseline-Subset (PO-SBAS) technology. Duiya Glacier, which terminates in a lake, exhibits approximately 10 m/yr higher horizontal speed and a higher melting rate with a vertical Non-Surface-Parallel-Flow (nSPF) velocity of – 7 m/yr than those of its land-terminating counterpart – West Duosangpu Glacier. Notably, Duiya Glacier experiences significant seasonal velocity fluctuations with accelerated flow between May and October. By integrating glacier geometry, changes in glacier boundaries and the extent of proglacial lakes, the distribution of supraglacial lakes, and climatic variables, we reveal that proglacial and supraglacial lakes play a crucial role in increasing the flow velocities of Duiya Glacier. Duiya Glacier flows faster because of increased subglacial water pressure resulting from water influx from these lakes. This phenomenon becomes conspicuously evident during May – October, when increased meltwater due to increased temperatures and precipitation further elevates the subglacial water pressure. Our method highlights the potential for understanding the impact of glacial lakes on glacier movements at a large scale, leveraging the capabilities of satellite SAR PO-SBAS technology for continuous, wide-scale, high temporal resolution, and 3D velocity monitoring.
1. Introduction
Rising temperatures and shrinking glaciers are causing the rapid expansion of existing glacial lakes and the formation of new ones globally (Sahu et al. Citation2023; Shugar et al. Citation2020; Zhang et al. Citation2021). This rapid expansion of glacial lakes increases the risk of glacial lake outburst floods, posing a significant threat to the livelihoods and economic development of downstream communities (Ahmed et al. Citation2021; Taylor et al. Citation2023).
To control and prevent water-related risks in areas downstream of glacial lakes, the movements of glaciers under climate change need to be considered(Bolch et al. Citation2008; Haemmig et al. Citation2014). Recent studies have emphasized the effect of glacial lakes on glacier movement(King et al. Citation2019; Maurer et al. Citation2019; Sutherland et al. Citation2020; Taylor et al. Citation2023). Climate-induced changes in glacier mass, combined with the ice temperature distribution and hydrological conditions at the glacier bed, affect the glacier stress and lead to glacier flow variability(Benn and Evans Citation2010; Dehecq et al. Citation2019). The power of glacial flows changes the geometry of glaciers (area, length, thickness, volume, etc.), resulting in changes in the timing and magnitude of glacial water release(Dell et al. Citation2019). Nevertheless, glacial lakes can cause changes in longitudinal stress gradients and force imbalance at the glacier – lake boundary, which can ultimately result in glacier velocity changes(Benn, Warren, and Mottram Citation2007b; Carrivick and Tweed Citation2013). Hence, to comprehend glacier movement, it is important to consider not only the glaciers themselves but also the impact of glacial lakes.
Nevertheless, the extent to which glacial lakes affect glacier movement and the details of this influence have not yet been thoroughly examined. This limitation arises from challenges associated with acquiring glacier velocity data through conventional in situ observations or space-borne optical remote sensing methods. Specifically, these challenges are manifested both temporally and spatially. Temporally, velocity monitoring through in situ observations (e.g. optical unmanned aerial vehicles) is limited to periods of high visibility during daylight hours and requires a sufficiently large number of ground control points(Ryan et al. Citation2014; Wigmore and Mark Citation2017). Optical satellite images cannot provide continuous and seasonal glacier velocities because of the effect of cloud cover(Copland et al. Citation2011). Spatially, optical satellite and unmanned aerial vehicle methods are restricted to capturing horizontal glacier velocities. Consequently, the challenges associated with acquiring detailed information on the temporal and spatial variations in glacier flow velocity through conventional methods result in an incomplete understanding of glacier motion, especially with respect to the seasonal fluctuations and vertical characteristics of glacier flow velocity. This limitation significantly hinders the comprehension and interpretation of glacier movement.
Satellite synthetic aperture radar (SAR) technology offers unique advantages for glacier velocity monitoring and is unique in that it can penetrate clouds and provide visibility in cloud-covered areas both during daytime and nighttime(Kumar, Venkataramana, and Høgda Citation2011; Strozzi et al. Citation2002). This enables the monitoring of the spatial and interannual variabilities in the seasonal glacier flow pattern(Lemos et al. Citation2018; Solgaard et al. Citation2022). The SAR Pixel-Offset-Tracking Small-Baseline-Subset method (PO-SBAS) is the most widely used method for monitoring glacial flow(Euillades et al. Citation2016; Li et al. Citation2018; Samsonov, Tiampo, and Cassotto Citation2021a). In combination with ascending and descending SAR images, the PO-SBAS method can provide the seasonal variations in glacier surface velocity in three dimensions (3D; i.e. east – west, north – south, and vertical). The vertical velocity component is further decomposed into Non-Surface-Parallel-Flow (nSPF) and Surface-Parallel-Flow (SPF) components, which are induced by snow accumulation/melting at the glacier surface and surface slope, respectively(Samsonov, Tiampo, and Cassotto Citation2021b; Shi et al. Citation2022). This decomposition allows for a clear interpretation of the causes of velocity changes.
The objective of this study is to provide novel insights into the influence of glacial lakes on the movement of the lake-terminating Duiya Glacier, Shigatse Prefecture, southern Tibetan Plateau. In recent years, Duiya Glacier has exhibited a notable propensity for outburst floods originating from its proglacial lake, necessitating continuous monitoring and comprehensive analysis of its movement(King et al. Citation2017; King et al. Citation2018; Nie et al. Citation2017). However, previous studies have primarily focused on assessing the changes in glacier area, length, and ice volume based on limited optical remote sensing observations. Can the glacial lake potentially influence the flow velocity of Duiya glacier? How great is its influence? What is the underlying mechanism by which glacial lakes affect glacier movement? These and other questions require clarifications. In this study, we applied the 3D PO-SBAS method with vertical velocity decomposition to ascending and descending Sentinel-1A imagery and obtained seasonal 3D glacier velocity fields for Duiya Glacier and its neighboring land-terminating counterpart – West Duosangpu Glacier. We conducted a thorough analysis of the flow velocity variations between Duiya and West Duosangpu Glaciers. Using a combined analysis of glacier geometry (i.e. glacier surface topography, Accumulation Area Ratio (AAR), and surface slope), changes in the glacier terminus and proglacial lake area, air temperature and precipitation, and the development of supraglacial lakes, we addressed the aforementioned questions.
This paper is structured as follows: Section 2 provides an introduction to the study area and datasets used in this study. Section 3 summarizes the SAR PO-SBAS method with vertical velocity decomposition. Furthermore, this section introduces the methods employed for determining the glacier surface topography and AAR, delineating glacier boundaries, and identifying the extents of proglacial lakes. Section 4 provides a comprehensive description of the glacier velocity monitoring results and a detailed comparison of the glacier movement between Duiya and West Duosangpu Glaciers. Furthermore, this section presents the results from observations at the glacier terminus, proglacial lake area and supraglacial lakes. Section 5 presents a detailed examination of the multiple factors contributing to the differences in the movement patterns of Duiya and West Duosangpu Glaciers and thoroughly evaluates the importance and mechanisms by which glacial lakes influence the movement of Duiya Glacier.
2. Study area and datasets
2.1. Study area
Duiya Glacier (28° 20´ N; 86° 22´ E; GLIMS ID: G086358E28329N) is located on the northern slope of the middle Himalayas in Tingri County, Shigatse Prefecture, southern Tibetan Plateau (). The tongue of the glacier extends into Lake Duoyicuo (28° 23´ N; 86° 23´ E; Lake ID: GL086380E28395N). According to the Randolph Glacier Inventory (RGI 6.0), this glacier covers 22.526 km2 and has minimum and maximum elevations of 5,497 and 7,221 m above sea level (a.s.l.), respectively.
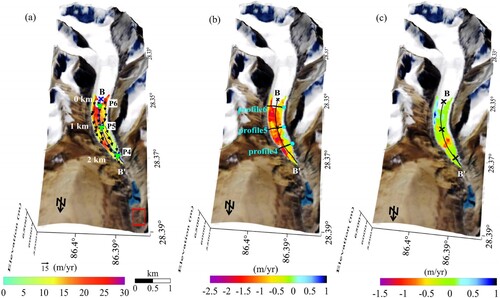
Figure 1. Map of the study area: (a) Location of the Duiya Glacier, marked with a red star. The cyan lines depict the coverage of the ascending and descending Sentinel-1A SAR images. The background is the ALOS World 3D-30 m (AW3D30) data. (b) 3D view of the lake-terminating Duiya Glacier and its counterpart West Duosangpu Glacier. The yellow color outlines of glacial lakes were manually delineated from the Landsat-8 OLI image taken on September 26, 2017.
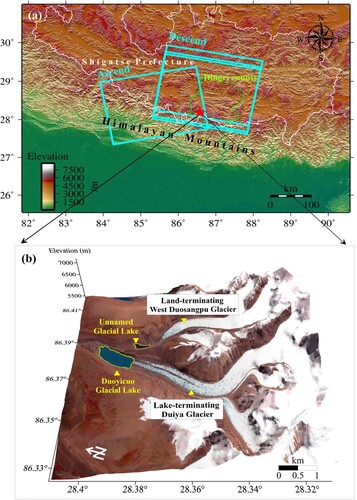
West Duosangpu Glacier (28° 20´ N; 86° 24´ E; GLIMS ID: G086396E28338N) borders Duiya Glacier to the east (). This glacier covers 7.77 km2 and has minimum and maximum elevations of 5,574 and 6,991 m a.s.l., respectively (source: RGI 6.0). West Duosangpu Glacier ends on land. An unnamed glacial lake (28° 23´ N; 86° 23´ E; Glacier Lake ID: GL086384E28380N) disconnected from West Duosangpu Glacier is situated at about 500 m from the glacier termini. This region is characterized by a type of dry and sub-humid climate, and precipitation is mainly concentrated during the summer(Nie et al. Citation2010; Wang et al. Citation2011).
From 1989 to 2015, Duiya Glacier experienced a mean ice front position change rate of – 33.62 m/yr, and the area of its proglacial lake increased from 0.7–0.95 km2 (Owen et al. Citation2018). Between 2000 and 2014/15, Duiya Glacier underwent a moderate area loss of 0.5 km2 (or 4.28% of its total area), and its mass balance was moderately negative with a value of – 0.45 ± 0.13 m.w.e./yr(Owen et al. Citation2017). In contrast, West Duosangpu Glacier exhibited minimal ablation primarily near its terminus, with an estimated glacier surface elevation change of – 1 m/yr between 2000 and 2014/15, while its extent remained mostly unchanged during this period(Owen et al. Citation2017).
2.2. Datasets
lists the satellite images and Digital Elevation Model (DEM) data used in this study. The satellite image types include Sentinel-1A SAR images for velocity retrieval, optical stereo images for DEM generation, reference elevation datasets, ‘terrain-corrected’ optical images for the extraction of glacier boundaries and glacial lake outline, as well as high spatial resolution Worldview-2 image with a resolution of 0.5 m for delineating supraglacial lakes.
Table 1. The satellite images and DEM used in this study.
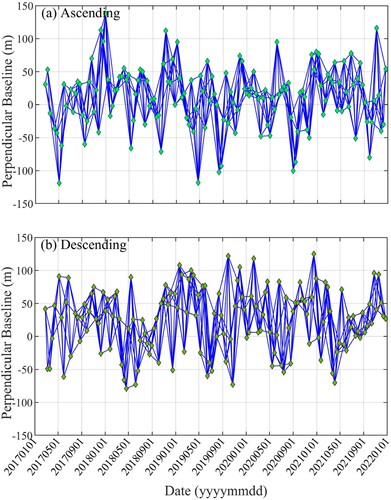
Glacier surface velocity was derived from the ascending and descending Sentinel-1A Interferometric Wide Swath (IWS) Level-1 SAR Single Look Complex (SLC) imagery acquired in the Terrain Observation with Progressive Scans (TOPS) mode. We utilized 292 Sentinel-1A SAR images acquired between February 2017 and December 2021, with 146 images acquired on the ascending path 85 and 146 images acquired on the descending path 121 (). The interval between two consecutive acquisitions along the same path was 12 days. In addition, Sentinel-1A Precise Orbit Ephemeride (POD) files were utilized to enhance the co-registration of SAR images during velocity retrieval processing.
Information on glacier surface topography is essential for separating the vertical SPF and nSPF velocities for the 3D PO-SBAS vertical velocity decomposition. In this study, an ASTER Level-1A(L1A) Visible Near Infrared (VNIR) stereo image with low cloud cover percentage (10%) acquired on March 9, 2019, was used to create a DEM of Duiya and West Duosangpu Glaciers. The DEM reconstruction using the ASTER L1A VNIR stereo image required an external reference DEM to correct the DEMs for geometric shifts. The AW3D30 DEM, which is freely accessible, exhibits a high vertical accuracy with a Root Mean Square Error (RMSE) of approximately 11.3 m over the glacierized area of the Tibetan Plateau (Chen et al. Citation2022). Owing to its accessibility and high quality, the AW3D30 DEM was utilized as a reference in the DEM geometric shift correction.
We used Landsat-8 Level-1 Precision Terrain (L1TP) products from the Operational Land Imager (OLI) instruments to map the terminus changes of Duiya and West Duosangpu Glaciers during 2017 and 2021. Landsat-8 L1TP scenes are already orthorectified and radiometrically inter-calibrated across the different Landsat sensors and are suitable for pixel-level time series analyses(Young et al. Citation2017). The selection of the Landsat-8 OLI image followed two criteria(Wang et al. Citation2020): First, select optical images with low cloud coverage (<10%) and no snow or shadows; second, select images acquired during summer and autumn (June – November), when proglacial lakes are expected to have approximately their maximum extents. Based on the above criteria, four Landsat OLI images () were selected to map annual glacier terminus changes. Notably, because of thick cloud cover in the image from November, we opted for an image from December 2021, which had low cloud content.
For meteorological data, we used monthly air temperature and precipitation data from the Dingri weather station, which is in the Pumqu Basin and the closest station to Duiya and West Duosangpu Glaciers. The temperature and precipitation data covered the period of February 2017 to December 2021.
3. Methods
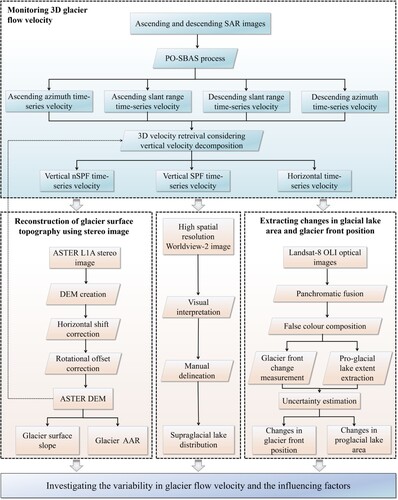
illustrates the research methodology. As outlined in the Introduction Section, our study focuses on examining the influence of glacial lakes on glacier movement through a range of observations, encompassing glacier geometry, supraglacial lakes, and changes in glacier terminus positions and proglacial lake extent. The Methods Section will provide a comprehensive explanation of the procedures involved in acquiring these observations. Specifically, we manually delineated supraglacial lakes from the Worldview-2 optical image captured on January 13, 2021, utilizing visual interpretation. This section will primarily elucidate the methods for extracting the time series of 3D glacier velocities using the improved 3D PO-SBAS technology (Section 3.1), as well as the techniques for reconstructing glacier surface topography and calculating AAR (Section 3.2), and analyzing changes in glacier terminus positions and proglacial lake areas (Section 3.3).
Figure 2. Research methodology flow chart.
3.1. Monitoring 3D glacier flow velocity
The 3D PO-SBAS method considering vertical velocity decomposition consists of three main steps(Shi et al. Citation2022). The first step is Pixel Offset Tracking (POT) processing. Under the constraint of temporal and perpendicular baseline threshold, the input SAR images are combined into a set of image pairs. The POT method is then employed to extract the displacements in azimuth and slant range directions for each image pair. Second, the Small Baseline Subset (SBAS) procedure is applied to obtain the time-series velocity field in the azimuth and range direction for both the ascending and descending tracks.
The third step is to compute the 3D velocities taking into consideration the decomposition of the vertical velocity. Velocities derived from SBAS processing along the slant range and azimuth direction for the ascending and descending tracks can be decomposed on the vertical, east and north directions. Specifically, it is worth noting that the vertical velocities actually represent the synthesis of both the glacier motion induced by surface slope and the mass change at the glacier surface(Samsonov, Tiampo, and Cassotto Citation2021b; Shi et al. Citation2022). By decomposing the vertical velocity in relation to the slope of the glacier surface, it is possible to estimate the glacier motion influenced by the surface slope, referred to as the vertical SPF component. The remaining vertical velocity is exclusively connected to glacier motion caused by a surface mass change, i.e. the vertical nSPF velocity, and can be determined by subtracting the SPF component from the vertical velocity. The glacier surface slope can be estimated by calculating the inverse of the glacier surface elevation in one order(Samsonov, Tiampo, and Cassotto Citation2021b). Information about the elevation of the glacier surface is provided by the DEM created with the ASTER Level 1A VNIR stereo image. Details on creating the DEM will be provided by Section 3.2.
Equation (1) explains the third step. and
represents the incidence angle.
and
is the azimuth angle of the radar beam with respect to the north direction. The ascending and descending tracks are indicated by the subscripts ‘A’ and ‘D’ respectively. ‘LOS’ and ‘AZI’ denote velocities along the range and azimuth directions. The velocities of east, north, vertical SPF, and nSPF are referred to by
,
,
, and
respectively. The negative nSPF velocity value indicates that the glacier surface melting is playing a leading role. If the SPF flow rate is negative, it means that the glacier is flowing downstream.
(1)
(1) In this study, the temporal and perpendicular reference thresholds are set at 48 days and 200 m to compromise between minimizing noise and ensuring sufficient redundant observations for SBAS processing. We combined 566 image pairs for descending tracks with perpendicular baselines less than 194 m, and 567 image pairs for ascending tracks with baselines no more than 196 m (). The searching window size is set at 150 (range)
30 (azimuth) pixels to balance the trade-off between processing efficiency and abundance of tracking information. The template is 10
2 pixels in size. The SNR threshold is set at 5.0, and
,
,
and
of the Sentinel-1A SAR data have respective values of 33.94°, 350.07°, 33.87°, and 190.17°. It should be noted that the time sequences of SBAS estimated velocity results for ascending and descending tracks differ. The same time sequence for two tracks was created by linearly interpolating the descending velocities to the time of ascending (Shi et al. Citation2022).
Figure 3. Spatial-temporal baseline distribution of Sentinel-1A SAR image pairs. (a) and (b) are respectively for ascending and descending tracks.
The uncertainty in SAR-derived glacier flow velocities was estimated by two ways. We first statistically analyzed the velocity residuals of the nonglacial region (Lv et al. Citation2019), and then compared the annual averages of horizontal velocities () derived from SAR to the velocity data derived from Landsat in the horizontal direction (Fahnestock et al. Citation2016). The nonglacial region was assumed to be stable, which means that the derived velocities in the nonglacial region are considered an error in the velocity estimate. To measure Landsat velocity, we used the image cross-correlation method on two Landsat-8 OLI images that were acquired on 26 September 2017 and 10 December 2021.
In order to analyze the changes in flow velocity during different monitoring periods, we extracted the flow velocity along the glacier center lines for each time period (Usman and Furuya Citation2018). The velocity and uncertainties of the velocity along the center line were determined by calculating the average and standard deviation (STD) for each center line pixel in a 33 neighborhood (Shi et al. Citation2022). For the derivation of glacier center lines, we adopted the automatic method proposed by Zhang et al. (Citation2022).
3.2. Reconstruction of glacier surface topography using stereo image
We used the open-source Ames Stereo Pipeline (ASP) v2.7.0 tool released by NASA to create the DEM from the ASTER Level 1A stereo image (Beyer et al. Citation2020). The spatial resolution of the output ASTER DEM was 30 m. Next, the output DEM was co-registered to the AW3D30 DEM to minimize errors associated with geometric shifts. We used the method of Nuth and Kääb (Citation2011) to correct the horizontal shift from the aspect – slope relationship and handled the rotational offset using the iterative closest point (ICP) of Besl and McKay (Citation1992). The open-source Python package xDEM (v0.0.2) was used to implement the offset corrections(xdem_contributors Citation2021). We plotted the differences between the reference DEM and the original/corrected ASTER DEM to analyze the DEM co-registration results (see Figure S1 in Supplemental Material). The difference between before and after co-registration reveals a significant reduction in the geometric shifts of the output ASTER DEM.
Following the reconstruction of the glacier surface topography, we computed the AAR, which is defined as the ratio of the accumulation area to the total area of a glacier. First, the Equilibrium Line Altitude (ELA) was determined by calculating the mid-range altitude of each glacier(Braithwaite and Raper Citation2017). Using the ASTER L1A image-derived DEM, the ELA was estimated to be approximately 6,250 m a.s.l. for both glaciers. Second, combining the glacier boundary from RGI 6.0 with the ELA values allowed us to compute the total glacier and accumulation areas for each glacier and derive the AAR. The results revealed comparable AAR values for both glaciers: 0.51 for Duiya Glacier and 0.47 for West Duosangpu Glacier. Because of the continuous changes in glacier terminus positions, we utilized the glacier boundaries derived from Landsat-8 on November 9, 2019 (see Section 3.3 for details), coinciding with the acquisition time of the ASTER DEM, as an approximation for the glacier terminus position. This was done to rectify the glacier boundary provided by RGI 6.0.
3.3. Extracting changes in glacial lake area and glacier front position
To examine the impact of the glacial lakes on glacier movement, it was necessary to check whether the contact between the glaciers and their glacial lakes changed during 2017–2021. For example, if Duiya Glacier is separated from its glacial lake, the separation between them must be considered when studying glacier – lake interactions. Furthermore, if West Duosangpu Glacier comes in contact with its lake during the study period, the impact of the pro-glacial lake should be considered. By monitoring the changes in the position of the glacier front and glacial lake area, we can check the contact between the glacier and its proglacial lake.
Glacial lake extraction was conducted following Wang et al. (Citation2020), whose method determines glacial lake boundaries by visually distinguishing among pure, mixed, and non-water pixels of a body of water. Considering the good contrast between the glacial lake and its surroundings, false-color composite images of bands 5, 4, and 3 from the Landsat OLI images were used to extract the glacial lake extent. The area uncertainty of proglacial lake mapping was estimated using the method proposed by Hanshaw and Bookhagen (Citation2014). The area error in the manual glacial lake delineation was assumed to follow a Gaussian distribution. Using the spatial resolution of the imagery, perimeter of the glacial lake, and total area of the glacial lake, we calculated the relative area error within one standard deviation.
We utilized the box method proposed by Moon and Joughin (Citation2008) to calculate the variations in the frontal positions of glaciers during 2017–2021. The box method uses an open box, which is defined by approximately delineated glacier sides and an arbitrarily chosen reference line upstream of the glacier. The glacier front changes are estimated by dividing the changes in the area of the open box by the width between the glacier sides. A proglacial lake defines the location of the lake-terminating glacier margin(Williams et al. Citation1997). Therefore, the false-color composite images of bands 5, 4, and 3, which were used to identify glacial lakes, were also used to digitize the glacier front position.
The method of Ye et al. (Citation2006) was used to calculate the uncertainty in measuring the glacial front position. This uncertainty stems from the pixel resolution of the imagery and the registration error of the image of the topographic map. To enhance glacier identification, the pixel resolution of the OLI 5, 4, and 3 bands was improved from 30 to 15 m by fusing the OLI panchromatic band. The geometric RMSE value provided in the Landsat image metadata (approximately 5 m in this study; Table S1) was used to determine the registration error. Consequently, the uncertainty in estimating the mean front position change was approximately 29 m for the various periods (Table S2).
4. Results
4.1. Glacier flow velocities
4.1.1. Annual average glacier velocity fields in 3D
The annual average flow velocities in the horizontal, vertical nSPF, and SPF directions for Duiya and West Duosangpu Glaciers are shown in and . After performing all the steps of the improved PO-SBAS processing, we obtained a 3D velocity time series from February 21, 2017, to December 21, 2021, with a 12-day interval. The annual average flow velocity fields were derived by averaging the 3D velocities over different periods.
Figure 4. The 3D annual average velocity field of Duiya Glacier during 2017–2021. (a) Horizontal velocity field. (b) and (c) represent vertical nSPF and SPF velocity fields, respectively. Distance posts are placed every 2 km along the central flow line (AA’). The red rectangle in (a) is utilized to evaluate the PO-SBAS velocity observation error. The black curves in (b) represent the profiles shown in , with the beginning points of these profiles indicated by black solid circles.
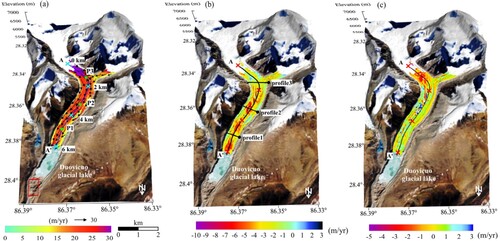
Figure 5. The 3D annual average velocity field of West Duosangpu Glacier during 2017–2021. Horizontal, vertical nSPF, and vertical SPF velocity fields are shown in (a), (b), and (c). Distance posts are placed every 2 km on the central flow line (BB’). The red rectangle in (a) is used to assess the error in PO-SBAS velocity observation. The black curves in (b) correspond to the profiles in , with the beginning points of these profiles denoted by cyan solid circles.
Duiya Glacier exhibits a uniform horizontal flow field throughout its middle and lower portions; furthermore, we noticed strong ablation. As shown in (a), two branches of Duiya Glacier intersect the trough at 1.5 km from both the northwest and northeast slopes of the valley and then flow through it towards the end of the glacier. The horizontal flow velocity is evenly distributed in space and fluctuates in the range of 15–30 m/yr. (b) and (c) show that the vertical SPF flow rates through the trough of the glacier are low, with a fluctuation of – 4–1 m/yr. Despite this, the vertical nSPF flow rate is negative and significantly higher, with a range of – 7 – −1 m/yr, which is an indicator of significant melting.
West Duosangpu Glacier is obviously slower than Duiya Glacier (), with its maximum horizontal and nSPF velocities being 20.0 and – 1.5 m/yr, i.e. much lower than the 30 and – 7 m/yr values, respectively, of Duiya Glacier. Furthermore, we found that the velocity of West Duosangpu Glacier has a clearly uneven spatial distribution. As shown in (a), the horizontal flow rates at 0–1.0 and 1.5 km fluctuate in the range of 15–20 m/yr. At 1.0–1.5 km and 1.75–2.20 km, the horizontal velocities are smaller and fluctuate between 10–15 m/yr.
4.1.2. 3D glacier flow velocity time series
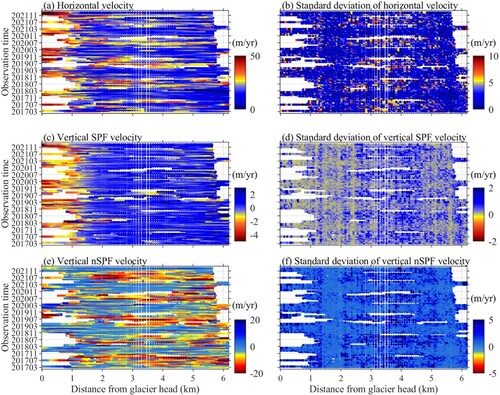
Duiya Glacier displays a clear seasonal change, with the flow rate increasing from May to September and decreasing from October to April. (a) shows that during the periods of October 2017 – April 2018, October 2018 – April 2019, October 2019 – April 2020, and October 2020 – April 2021, the horizontal flow rate was generally less than 20 m/yr and could be as low as 5–10 m/yr. The vertical nSPF flow rate was significantly lower and fluctuated around zero ((b)). From May to September during 2017–2021, the horizontal flow rate fluctuated between 20 and 30 m/yr, reaching a maximum of 40 m/yr ((a)). The vertical flow of nSPF also increased over this period, fluctuating from approximately – 20 to – 10 m/yr ((b)).
Figure 6. The Duiya glacier's time series changes of 3D velocities on the center line AA’ (marked in ) and corresponding error estimates from February 2017 to December 2021.
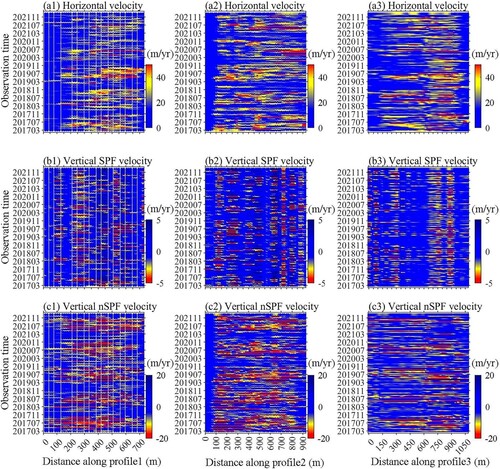
reveals consistent seasonal variation patterns of flow velocity across the three cross-sectional profiles on Duiya Glacier, with the most significant fluctuations occurring for the horizontal and vertical nSPF flow velocities. Between May and September, the horizontal flow velocity varied within the range of approximately 30–40 m/yr, as depicted in (a1 – a3), whereas the vertical nSPF flow velocity can reach speeds of up to – 20 m/yr, as depicted in (c1 – c3).
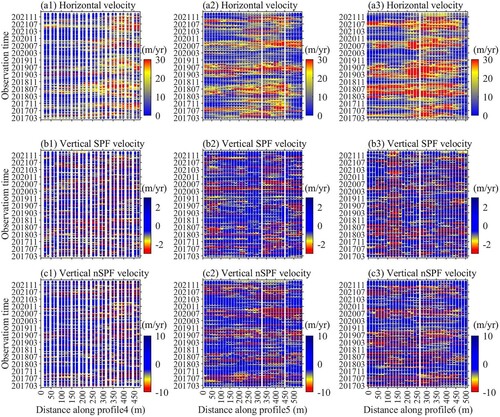
Figure 7. The Duiya glacier's time series changes of 3D velocities along the 3 profiles (marked in (b)) from February 2017 to December 2021. Top to bottom rows: horizontal, vertical SPF and nSPF velocity; left to right columns: profiles 1–3.
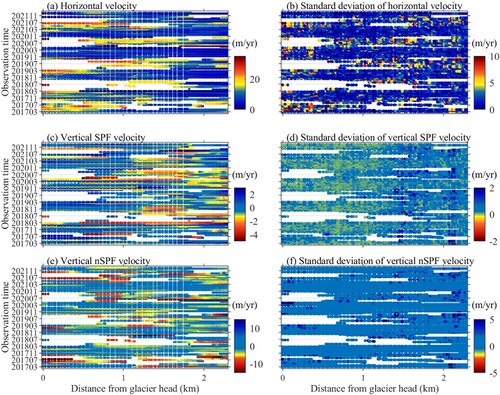
West Duosangpu Glacier also exhibits seasonal velocity variation. From October to April, the horizontal flow rate is lower, fluctuating around 10 m/yr ((a)). The vertical nSPF flow rate is also low, fluctuating around zero ((b)). Conversely, the horizontal flow and vertical nSPF flow velocities increase significantly between May and September. The former fluctuates between 15 and 25 m/yr ((a)), whereas the latter fluctuates between – 5 and – 2 m/yr ((b)).
Figure 8. Temporal variations in the 3D velocity of the central line BB’ (marked in ) on the West Duosangpu Glacier and error estimates from February 2017 to December 2021.
Furthermore, we noticed that West Duosangpu Glacier exhibits clear seasonal fluctuations in flow velocity along the cross-sectional profiles, particularly in the horizontal and vertical components of the nSPF flow velocity, as illustrated in . Between May and September, the horizontal flow velocity typically varies between 15 and 30 m/yr, whereas the vertical nSPF flow velocity varies around – 5 m/yr. Additionally, as depicted in (a2), (a3), (c2), and (c3), compared with that in profile 4 near the glacier terminus, flow velocities in profiles 5 and 6 in the middle of the glacier are notably higher.
Figure 9. Temporal variations in the 3D velocity along the profiles (marked in (b)) on the West Duosangpu Glacier from February 2017 to December 2021. Top to bottom rows: horizontal, vertical SPF and nSPF velocity; left to right columns: profiles 4–6.
4.1.3. Velocity error analysis
The horizontal velocities calculated using SAR and Landsat-8 are in agreement. The results indicate that the mean and standard deviation of the velocity difference between SAR and Landsat-8 are low. Duiya Glacier has a mean and standard deviation of velocity difference of 4.12 and 9.55 m/yr, respectively. These two values for West Duosangpu glacier are 9.10 and 4.85 m/yr, respectively. The velocity fields derived from SAR and Landsat are shown in Figures S2 and S3, respectively.
The velocity error estimates obtained by statically analyzing the residuals in the nonglacial region also verified the high accuracy of the SAR velocity measurements. The velocity residuals were calculated for the areas downstream of Duiya and West Duosangpu Glaciers (red boxes in (a) and 5(a)). The results indicated that the horizontal velocity observation errors were 7.232 ± 0.668 and 7.272 ± 0.663 m/yr for Duiya and Western Duosangpu Glaciers, respectively. For Duiya and West Duosangpu Glaciers, the velocity measurement errors in the vertical direction were only – 0.064 ± 0.074 and 0.004 ± 0.070 m/yr, respectively.
4.2. Frontal position change and proglacial lake development
Duiya Glacier maintained contact with its proglacial lake from 2017 to 2021 and simultaneously experienced a significant ice front retreat ((a)). The proglacial lake continued to grow ((b)), with its area growing from 1.05 km2 in 2017 to 1.20 km2 in 2021 ((c)). Compared with its position in 2017, the cumulative retreat of Duiya Glacier reached approximately 220 m in 2021 ((c)). The relative area error for the extraction of glacial lakes fluctuated between 4.641% and 4.768% (Table S3).
Figure 10. (a) Changes in glacier frontal position of Duiya and West Duosangpu Glacier during 2017–2021. The black lines depicted the open-ended boxes used to estimate front position changes. (b) Area development of the Duoyicuo Glacial lake and the ice-uncontacted West Duosangpu Glacial lake during 2017–2021. The background for (a) and (b) is the Landsat-8 OLI image taken on September 26, 2017. (c) Cumulative ice front change (black line) and lake area increase (red line) for Duiya glacier and its lake. (d) Lake area and cumulative ice front change for the West Duosangpu glacier and its un-contacted lake. Error bars in (c) and (d) represent uncertainties in estimating the glacial lake area and digitizing the glacier front positions (data from Table S2 – S4).
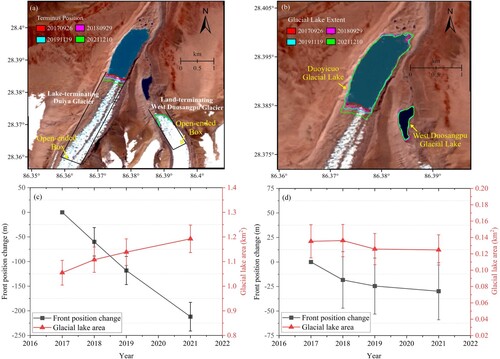
Between 2017 and 2021, West Duosangpu Glacier and its proglacial lake remained separate, with the glacier maintaining a consistent ice front position ((a)). The glacial lake area exhibited a small fluctuation in the range of 0.12–0.14 km2 during 2017–2021 ((d)). The relative area error of the Duosangpu glacial lake was higher than that of the Duoyicuo proglacial lake, fluctuating between 14.506% and 15.145% (Table S4).
4.3. Distribution of supra-glacial lakes
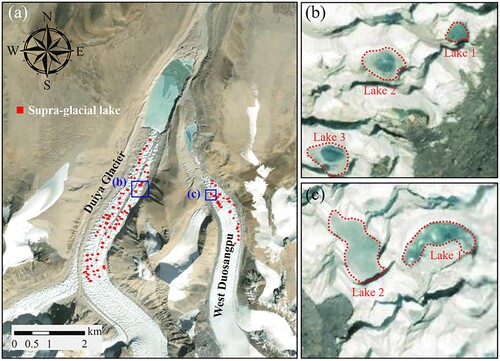
According to , it is apparent that the extent and abundance of supraglacial lakes on the Duiya Glacier far exceed those observed on the West Duosangpu Glacier. In the midstream and downstream regions of the Duiya Glacier and in areas near the proglacial lake, numerous supraglacial lakes are densely distributed. In contrast, the West Duosangpu Glacier exhibits minimal development of supraglacial lakes, with only a sparse distribution near the glacier terminus.
Figure 11. The distribution of supraglacial lakes on Duiya Glacier and West Duosangpu Glacier. The area within the black boxes in (a) is shown in enlarged images (b) and (c).
5. Discussion
By conducting a thorough analysis of the velocities generated using 3D PO-SBAS monitoring, significant flow velocity disparities were identified between the lake-terminating Duiya and land-terminating West Duosangpu Glaciers. These disparities suggest that distinct factors govern the flow behavior of each glacier. The objective of this section is to systematically investigate the factors that contribute to these contrasting flow behaviors. First, we will examine the geometric controls on the flow behavior of Duiya and West Duosangpu Glaciers, focusing specifically on glacier thickness, AAR, and surface slope in Section 5.1. Section 5.2 will further examine the influence exerted by proglacial and supraglacial lakes. Finally, Section 5.3 will examine the effects of climatic factors, specifically air temperature and precipitation, on the seasonal flow behaviors of glaciers.
5.1. Geometric controls on glacier flow behavior
The downward movement of a glacier is caused by gravity, the driving force of which depends on the glacier surface slope and thickness(Nye Citation1951). The gravitational driving force is proportional to the glacier thickness and surface slope, and a greater gravitational force results in faster glacier flow(Nye Citation1951). Glacier thickness is primarily determined by the amount of snow and ice accumulation, which is influenced by temperature, precipitation, solar radiation exposure, and elevation(Huss and Farinotti Citation2012; Paul and Svoboda Citation2009; Tang, Lv, and He Citation2013). Lower temperatures, adequate precipitation, reduced solar exposure, and higher elevations lead to greater snow accumulation and thicker glaciers. Duiya and West Duosangpu Glaciers, situated close to each other on the northern slope, likely experience similar local climates and solar radiation levels. Their elevation ranges are comparable, with Duiya Glacier ranging from 5,497–7,221 m a.s.l. and West Duosangpu Glacier ranging from 5,574–6,991 m a.s.l. (see Section 2.1). Hence, it is reasonable to deduce that the snow and ice accumulation conditions are similar for both glaciers. However, Duiya Glacier, which is larger, can accumulate significantly more snow and ice than West Duosangpu Glacier under similar conditions. This enhanced accumulation increases the internal ice deformation and can cause Duiya Glacier to flow at a faster rate.
However, despite the significant glacier area difference between Duiya and West Duosangpu Glaciers, their AAR values are close to each other (i.e. 0.51 and 0.47, respectively). Based on this, we hypothesize that the substantial flow velocity disparity between Duiya and West Duosangpu Glaciers may not be solely attributable to their distinct initial snow and ice accumulation levels due to area differences. The mass balance patterns and rates of snow/ice accumulation and ablation of these glaciers are similar, as indicated by their comparable AAR values(Meier Citation1962; Miles et al. Citation2021). This implies that additional factors may influence glacier dynamics and play a role in the significant flow velocity disparity between the two glaciers.
Subsequently, we obtained the glacier surface slope and 3D average annual velocities along the central lines of Duiya and West Duosangpu Glaciers to investigate the impact of glacier surface slope on velocity fluctuations. The results are shown in . The ice surface slope of West Duosangpu Glacier is significantly steeper than that of Duiya Glacier. The former fluctuates gently, with most values oscillating around 5°, and generally does not exceed 10°; the latter exhibits greater variations. At 0–1 km, the glacier surface slopes exhibit a variation of approximately 5°, followed by an increase of approximately 3° to 15° at a distance of 1.6 km. Beyond 1.6 km, the surface slopes generally exhibit fluctuations within the range of 10–17°.
Figure 12. Variations in 3D velocities and glacier surface slope along the central flow line AA’ for Duiya glacier (a) and BB’ for West Duosangpu glacier (b). The central flow lines AA’ and BB’ are marked in (a) and (a) respectively.
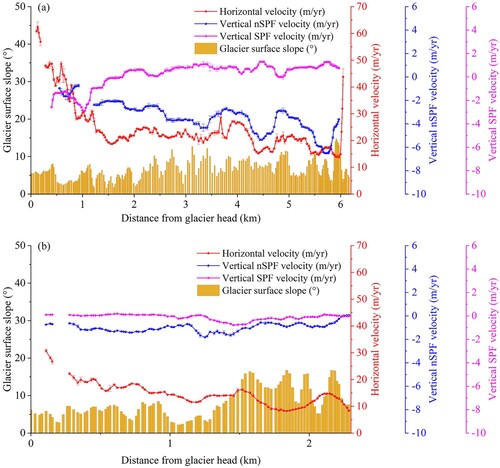
According to the analysis of the glacier surface slope, West Duosangpu Glacier, given its significantly steeper slope than that of Duiya Glacier, should exhibit significantly higher flow velocity. However, our analysis reveals a notable disparity, wherein Duiya Glacier exhibits a significantly higher flow rate despite possessing a comparatively lower surface slope. As discussed in Section 4.1.1, the horizontal velocity of Duiya Glacier fluctuates from 15 to 30 m/yr along its center line, whereas the vertical nSPF and SPF flow velocities fluctuate from – 7 to – 1 m/yr and from – 4–1 m/yr, respectively. West Duosangpu Glacier has an average horizontal flow rate of 10–20 m/yr, and the vertical nSPF flow rate varies slightly around – 1.5 m/yr. Despite a noticeable increase in the vertical SPF velocity of – 1 m/yr at 1.5 km, it fluctuates around zero. These findings indicate that the surface slope is not likely to be the main factor causing the significant velocity disparity between Duiya and West Duosangpu Glaciers.
5.2. Influences of the proglacial and supra-glacial lakes on glacier flow velocity
Duiya and West Duosangpu Glaciers are neighboring glaciers situated on the northern slope. The most prominent difference between these two glaciers is their different interactions with their terminal glacial lakes. Based on , the front position of West Duosangpu Glacier remained relatively unchanged during 2017–2021, and the area of the lake without direct contact with the glacier remained constant. This result indicates that during 2017–2021, West Duosangpu Glacier and its uncontacted lake remained separate. Conversely, Duiya Glacier consistently maintained contact with its proglacial lake. According to Section 5.1, despite its steeper slope, West Duosangpu Glacier demonstrates a significantly lower flow velocity than that of Duiya Glacier, with the maximum difference in flow velocity being 10 m/yr. Hence, we hypothesize that there may be a correlation between lake – glacier contact and the accelerated flow of Duiya Glacier.
Higher flow velocities of lake-terminating glaciers have also been observed in other regions of the Himalayas (King et al. Citation2018; Liu et al. Citation2020; Pronk et al. Citation2021; Zhang et al. Citation2019). The topographic constraints of these glaciers are similar to that of Duiya Glacier. Research has shown that the accelerated flow of these lake-terminating glaciers is due to increases in subglacial water pressure caused by proglacial lakes. The flow velocity of a glacier is positively correlated with the effective pressure, with the latter being determined by the difference between the subglacial water pressure and overburden ice(Stubblefield et al. Citation2019). Glacier flow velocity increases through a reduction in effective pressure caused by rising subglacial water pressure or thinning of the overburden ice(Benn, Hulton, and Mottram Citation2007a). Ice – lake contact at the glacier terminus causes upglacial propagation of water from the proglacial lake, which increases the subglacial water pressure(Carrivick and Tweed Citation2013). The increase in subglacial pressure leads to a decrease in positive effective pressure, thereby accelerating the glacier flow(Sugiyama et al. Citation2011). In addition, ice margin calving leads to the loss of glacial ice mass, and frontal calving and subaqueous melting can amplify the thinning of the host glacier(Benn, Warren, and Mottram Citation2007b; Truffer and Motyka Citation2016; Zhang et al. Citation2023).
The influence of proglacial lakes on such lake-terminating glaciers leads to several distinct characteristics, including accelerated glacier velocity, intense glacier ablation, continuous glacier retreat, and expansion of proglacial lakes. Duiya Glacier exhibits similar characteristics, flowing much faster than West Duosangpu Glacier. Duiya Glacier continued to retreat during 2017–2021, and the area of the proglacial lake expanded. The average annual vertical nSPF velocity over Duiya Glacier is – 7 m/yr, i.e. much higher than that of West Duosangpu Glacier (−1.5 m/yr), indicating that Duiya Glacier appears to have melted strongly. Base on these comparison, it is reasonable to assume that the ice – lake interactions in the case of Duiya Glacier are similar to those of lake-terminating glaciers in other regions of the Himalayas. The flow of Duiya Glacier may be significantly facilitated by its proglacial lake, which lifts the subglacial water pressure to reduce the effective pressure.
Besides, we observed that the Duiya Glacier displays a larger extent and quantity of supraglacial lakes in comparison to the West Duosangpu Glacier (). It is hypothesized that the differences in flow rates between the Duiya and West Duosangpu glaciers may also be attributed to variations in the volume of meltwater from supraglacial lakes. Given the higher prevalence of supraglacial lakes on the Duiya Glacier, there is a greater potential for an increased influx of meltwater into the subglacial drainage system. This subsequently raises subglacial water pressure, leading to an enhancement in the flow velocity of the Duiya Glacier.
5.3. Climatic controls on the seasonal glacier flow velocity
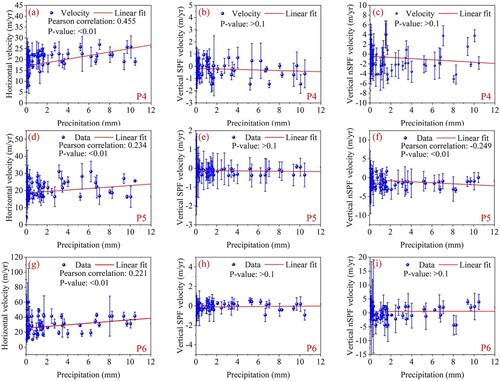
As mentioned previously, snow/ice accumulation, the presence of proglacial lakes, and the prevalence of supraglacial lakes notably enhance the flow velocity of Duiya Glacier. In addition, our velocity monitoring results () revealed previously unexplored seasonal flow velocity variations of Duiya and West Duosangpu Glaciers. These findings provide a new perspective for investigating the underlying mechanisms controlling glacier velocity fluctuations. Six points (P1 – P6 in and ) were selected from the upper, middle, and lower portions of the two glaciers to investigate the reasons for the seasonal variations in glacier flow velocity. After selecting these points, we analyzed the relationship between the 3D velocity changes at each point and climatic variables, including air temperature and precipitation ().
Figure 13. The relationship between air temperature and horizontal, vertical nSPF and SPF velocities at points P1 – P3 of the Duiya Glacier. Solid red lines show the result of the linear fit.
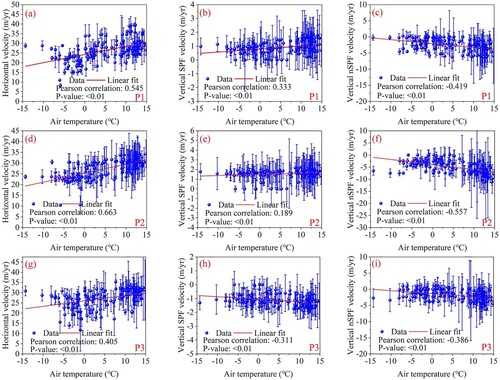
Figure 14. The relationship between the 3D glacier flow velocities and precipitation fluctuations at points P1 – P3 of the Duiya Glacier.
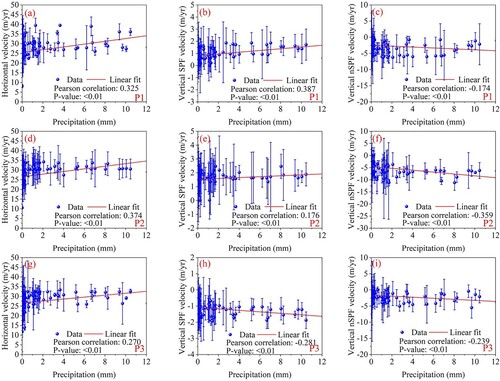
Figure 15. The statistical relationship between horizontal, vertical SPF, and nSPF velocities and air temperature at points P4 – P6 of the West Duosangpu Glacier.
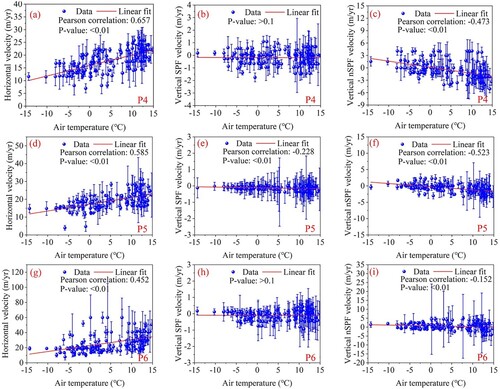
Figure 16. The statistical relationship between the 3D flow velocities and precipitation at points P4 – P6 of the West Duosangpu Glacier.
Duiya Glacier exhibits significantly stronger correlations between velocity changes and air temperature/precipitation than those of West Duosangpu Glacier. As shown in and , the correlation coefficients for the horizontal velocity and air temperature are between 0.405 and 0.663, whereas for the horizontal velocity and precipitation, they are between 0.270 and 0.374. The correlation coefficients for the SPF velocity and temperature (precipitation) can reach up to 0.333 (0.387). The vertical nSPF velocity is also significantly correlated with air temperature and precipitation, with correlation coefficients ranging from – 0.557 to – 0.386 and from – 0.359 to – 0.174, respectively.
On West Duosangpu Glacier, the correlations between the flow velocities and air temperature and precipitation are weaker. As shown respectively in and , the correlation coefficient for the horizontal velocity and air temperature ranges between 0.452 and 0.657, and that for the horizontal velocity and precipitation ranges between 0.221 and 0.455. The vertical nSPF velocity is correlated with air temperature, but it barely correlates with precipitation. Furthermore, there is no significant correlations between SPF velocity and air temperature and precipitation. These findings suggest that the influences of air temperature and precipitation on the flow of Duiya Glacier are stronger than those on the flow of West Duosangpu Glacier.
Glacial crevasses modulate glacier flow velocity primarily by regulating water within the glacier(Tsutaki et al. Citation2011). For glaciers ending in lakes, water from the proglacial lake propagates beneath the glacier, which can lead to a large amount of water remaining on the ice bed(Carrivick and Tweed Citation2013). On the one hand, the abundance of water on the ice bed facilitates the formation of subglacial crevasses(van der Veen Citation1998). On the other hand, the presence of water increases pressure, promoting the vertical extension of subglacial crevasses(Harper et al. Citation2010). The presence of a lake at the terminus of Duiya Glacier elevates the water pressure beneath the glacier. Therefore, it is plausible that the vertical expansion of crevasses within Duiya Glacier might be substantial because of high subglacial water pressure. In addition, water can counteract the ice creep that causes crevasses to close within the glacier by exerting pressure on both sides of the crevasses, thereby allowing them to expand(Alley et al. Citation2005; van der Veen Citation2007). We also discovered numerous supraglacial lakes on Duiya Glacier (). Hence, crevasses can receive water from supraglacial lakes. Consequently, Duiya Glacier may experience increased crevasse formation owing to the substantial inflow of water from these supraglacial lakes, as water can counterbalance the compressive forces acting on the crevasses from both sides.
Our study revealed that the correlations between the velocity of West Duosangpu Glacier and temperature and precipitation decreased compared to those of Duiya Glacier. We inferred that this could be due to differing crevasse development between Duiya and West Duosangpu Glaciers. The well-developed crevasses of Duiya Glacier allow for the transfer of meltwater to the glacier bed, which effectively regulates the subglacial water pressure and accelerates ice flow. During the warm season, high air temperature and concentrated precipitation increase the amount of meltwater, leading to faster glacier flow. Conversely, West Duosangpu Glacier terminates on land, with its supraglacial lakes showing restricted development (). It is plausible that the formation and growth of crevasses are hindered without proglacial and supraglacial lakes providing large amounts of water. Underdeveloped crevasses impede the ability of surface meltwater to effectively regulate the subglacial water pressure, thereby diminishing the influence of meltwater on glacier flow. Thus, despite notable variations in meltwater caused by changes in air temperature and precipitation, the glacier velocity is unlikely to undergo a significant change.
Overall, our study shows that the satellite SAR PO-SBAS technology has the potential to monitor the flow velocities of glaciers that terminate on land and lakes, with the advantages of continuous, wide-scale, high temporal resolution, and 3D assessment. In future research, we aim to use satellite SAR PO-SBAS to measure 3D glacier flow velocities with high temporal resolution on a regional scale. This will allow the comparison of the flow velocities of multiple lake – and land-terminating glaciers in different regions. By conducting a detailed comparative analysis, we can better evaluate the differences in how glacial lakes affect glacier flow in different regions. This is of great significance for analyzing the current state of glacier changes at regional or even global scales in the face of the extensive formation or expansion of glacial lakes under global climate warming.
6. Conclusion
This study investigated the flow velocity differences between the lake-terminating Duiya and land-terminating West Duosangpu Glaciers, both of which are situated in the southern Tibetan Plateau. This study further investigated the significance and mechanisms by which glacial lakes contribute to these flow velocity variations. The velocity data for the glaciers were derived from SAR images acquired by the Sentinel-1A satellite during 2017–2021. The glacier flow velocities were derived using an improved PO-SBAS method that incorporates vertical velocity decomposition.
For 2017–2021, we discovered significant differences flow velocity differences between Duiya and West Duosangpu Glaciers. Duiya Glacier has an average annual horizontal velocity approximately 10 m/yr higher than that of West Duosangpu Glacier. The vertical nSPF flow rate of West Duosangpu Glacier is only – 1.5 m/yr, whereas that of Duiya Glacier is as high as – 7 m/yr. Strong melting of Duiya Glacier was observed in the nSPF velocity comparison. In addition, we found that the velocity of Duiya Glacier has seasonal fluctuation characteristics and is significantly influenced by temperature and precipitation changes. The rate of glacial flow from May to October is higher than that during the winter season. The flow velocity of West Duosangpu Glacier also exhibits seasonal variations; however, its relationships with temperature and precipitation changes are significantly weaker. Additionally, we observed that Duiya Glacier has more supraglacial lakes than West Duosangpu Glacier.
We suggest that on the one hand, the large accumulation area and substantial snow/ice mass of Duiya glacier lead to accelerated internal deformation, contributing significantly to its higher flow velocities. On the other hand, our study shows that proglacial and supraglacial lakes also exert a substantial influence on accelerating the flow of Duiya Glacier. We propose that the water of its proglacial and supraglacial lakes decreases the effective positive pressure beneath the glacier, resulting in an increase in the flow velocity of Duiya Glacier. Furthermore, water from numerous supraglacial lakes contributes to the vertical extension of glacial crevasses, which facilitate the flow of meltwater into the glacier bed, thereby augmenting the ability of surface meltwater to regulate subglacial water pressure. By controlling the amount of meltwater on the glacier surface, air temperature and precipitation can exert a notable influence on Duiya glacier flow.
This method, which was utilized to study Duiya and West Duosangpu Glaciers, enables us to acquire high-resolution 3D information on glacier flow velocity, including long-term seasonal fluctuations and vertical changes, that are fairly difficult to obtain with conventional velocity monitoring methods. The detailed velocity monitoring results provide new insights into how glacial lakes affect glacier motion. This method can be broadly applied to glaciers that currently lack direct large-scale observational data. This is beneficial for acquiring a complete understanding of the current large-scale state of glaciers in the context of the rapid expansion of glacial lakes caused by global warming.
Supplemental Material
Download MS Word (1.5 MB)Acknowledgments
The Copernicus Open Access Hub provided data for Sentinel-1A SAR and POD (https://scihub.copernicus.eu/), NASA Earthdata provided Landsat-8 OLI data (https://earthdata.nasa.gov/), and JAXA provided the AW3D30 DEM data (https://www.eorc.jaxa.jp/ALOS/en/aw3d30/index.htm). Worldview-2 data were source from World Imagery Wayback (https://wayback.maptiles.arcgis.com), and air temperature and precipitation data were obtained from China Meteorological Data Service Center (http://data.cma.cn/).
The NASA ASP software for generating the DEM using the ASTER Level-1A stereo images is available at https://github.com/NeoGeographyToolkit/StereoPipeline. The open-source xDEM toolbox for DEM co-registration is available at https://github.com/GlacioHack/xdem.
Disclosure statement
No potential conflict of interest was reported by the author(s).
Additional information
Funding
References
- Ahmed, R., G. F. Wani, S. T. Ahmad, M. Sahana, H. Singh, and P. Ahmed. 2021. “A Review of Glacial Lake Expansion and Associated Glacial Lake Outburst Floods in the Himalayan Region.” Earth Systems and Environment 5 (3): 695–708. https://doi.org/10.1007/s41748-021-00230-9.
- Alley, R. B., T. K. Dupont, B. R. Parizek, and S. Anandakrishnan. 2005. “Access of Surface Melt-Water to Beds of sub-Freezing Glaciers: Preliminary Insights.” Annals of Glaciology 40: 8–14. https://doi.org/10.3189/172756405781813483.
- Benn, D. I., and D. J. A. Evans. 2010. Glaciers and Glaciation. 2nd ed. Routledge. https://doi.org/10.4324/9780203785010.
- Benn, D. I., N. R. J. Hulton, and R. H. Mottram. 2007a. “‘Calving Laws’, ‘Sliding Laws’ and the Stability of Tidewater Glaciers.” Annals of Glaciology 46: 123–130. https://doi.org/10.3189/172756407782871161.
- Benn, D. I., C. R. Warren, and R. H. Mottram. 2007b. “Calving Processes and the Dynamics of Calving Glaciers.” Earth-Science Reviews 82 (3): 143–179. https://doi.org/10.1016/j.earscirev.2007.02.002.
- Besl, P. J., and N. D. McKay. 1992. “A Method for Registration of 3-d Shapes.” IEEE Transactions on Pattern Analysis and Machine Intelligence 14 (2): 239–256. https://doi.org/10.1109/34.121791.
- Beyer, R., O. Alexandrov, Scott McMichael, M. Broxton, M. Lundy, K. Husmann, L. Edwards, et al. 2020. “Neogeographytoolkit/stereopipeline 2.7.0 (2.7.0).” Zenodo. https://doi.org/10.5281/zenodo.3963341.
- Bolch, T., M. F. Buchroithner, J. Peters, M. Baessler, and S. Bajracharya. 2008. “Identification of Glacier Motion and Potentially Dangerous Glacial Lakes in the mt. Everest Region/Nepal Using Spaceborne Imagery.” Natural Hazards and Earth System Sciences 8 (6): 1329–1340. https://doi.org/10.5194/nhess-8-1329-2008.
- Braithwaite, R. J., and S. C. B. Raper. 2017. “Estimating Equilibrium-Line Altitude (ELA) from Glacier Inventory Data.” Annals of Glaciology 50 (53): 127–132. https://doi.org/10.3189/172756410790595930.
- Carrivick, J. L., and F. S. Tweed. 2013. “Pro-glacial Lakes: Character, Behaviour and Geological Importance.” Quaternary Science Reviews 78: 34–52. https://doi.org/10.1016/j.quascirev.2013.07.028.
- Chen, W., T. Yao, G. Zhang, F. Li, G. Zheng, Y. Zhou, and F. Xu. 2022. “Towards ice-Thickness Inversion: An Evaluation of Global Digital Elevation Models (Dems) in the Glacierized Tibetan Plateau.” The Cryosphere 16 (1): 197–218. https://doi.org/10.5194/tc-16-197-2022.
- Copland, L., T. Sylvestre, M. P. Bishop, J. F. Shroder, Y. B. Seong, L. A. Owen, A. Bush, and U. Kamp. 2011. “Expanded and Recently Increased Glacier Surging in the Karakoram.” Arctic, Antarctic, and Alpine Research 43 (4): 503–516. https://doi.org/10.1657/1938-4246-43.4.503.
- Dehecq, A., N. Gourmelen, A. S. Gardner, F. Brun, D. Goldberg, P. W. Nienow, E. Berthier, C. Vincent, P. Wagnon, and E. Trouvé. 2019. “Twenty-first Century Glacier Slowdown Driven by Mass Loss in High Mountain Asia.” Nature Geoscience 12 (1): 22–27. https://doi.org/10.1038/s41561-018-0271-9.
- Dell, R., R. Carr, E. Phillips, and A. J. Russell. 2019. “Response of Glacier Flow and Structure to pro-Glacial Lake Development and Climate at Fjallsjökull, South-East Iceland.” Journal of Glaciology 65 (250): 321–336. https://doi.org/10.1017/jog.2019.18.
- Euillades, L. D., P. A. Euillades, N. C. Riveros, M. H. Masiokas, L. Ruiz, P. Pitte, S. Elefante, F. Casu, and S. Balbarani. 2016. “Detection of Glaciers Displacement Time-Series Using sar.” Remote Sensing of Environment 184: 188–198. https://doi.org/10.1016/j.rse.2016.07.003.
- Fahnestock, M., T. Scambos, T. Moon, A. Gardner, T. Haran, and M. Klinger. 2016. “Rapid Large-Area Mapping of ice Flow Using Landsat 8.” Remote Sensing of Environment 185: 84–94. https://doi.org/10.1016/j.rse.2015.11.023.
- Haemmig, C., M. Huss, H. Keusen, J. Hess, U. Wegmüller, Z. Ao, and W. Kulubayi. 2014. “Hazard Assessment of Glacial Lake Outburst Floods from Kyagar Glacier, Karakoram Mountains, China.” Annals of Glaciology 55 (66): 34–44. https://doi.org/10.3189/2014AoG66A001.
- Hanshaw, M. N., and B. Bookhagen. 2014. “Glacial Areas, Lake Areas, and Snow Lines from 1975 to 2012: Status of the Cordillera Vilcanota, Including the Quelccaya ice cap, Northern Central Andes, Peru.” The Cryosphere 8 (2): 359–376. https://doi.org/10.5194/tc-8-359-2014.
- Harper, J. T., J. H. Bradford, N. F. Humphrey, and T. W. Meierbachtol. 2010. “Vertical Extension of the sub-Glacial Drainage System Into Basal Crevasses.” Nature 467 (7315): 579–582. https://doi.org/10.1038/nature09398.
- Huss, M., and D. Farinotti. 2012. “Distributed ice Thickness and Volume of all Glaciers Around the Globe.” Journal of Geophysical Research: Earth Surface 117 (F04010). https://doi.org/10.1029/2012JF002523.
- King, O., A. Bhattacharya, R. Bhambri, and T. Bolch. 2019. “Glacial Lakes Exacerbate Himalayan Glacier Mass Loss.” Scientific Reports 9 (1): 18145. https://doi.org/10.1038/s41598-019-53733-x.
- King, O., A. Dehecq, D. Quincey, and J. Carrivick. 2018. “Contrasting Geometric and Dynamic Evolution of Lake and Land-Terminating Glaciers in the Central Himalaya.” Global and Planetary Change 167: 46–60. https://doi.org/10.1016/j.gloplacha.2018.05.006.
- King, O., D. J. Quincey, J. L. Carrivick, and A. V. Rowan. 2017. “Spatial Variability in Mass Loss of Glaciers in the Everest Region, Central Himalayas, Between 2000 and 2015.” The Cryosphere 11 (1): 407–426. https://doi.org/10.5194/tc-11-407-2017.
- Kumar, V., G. Venkataramana, and K. A. Høgda. 2011. “Glacier Surface Velocity Estimation Using sar Interferometry Technique Applying Ascending and Descending Passes in Himalayas.” International Journal of Applied Earth Observation and Geoinformation 13 (4): 545–551. https://doi.org/10.1016/j.jag.2011.02.004.
- Lemos, A., A. Shepherd, M. McMillan, and A. E. Hogg. 2018. “Seasonal Variations in the Flow of Land-Terminating Glaciers in Central-West Greenland Using Sentinel-1 Imagery.” Remote Sensing 10 (12): 1878. https://doi.org/10.3390/rs10121878.
- Li, J., Z. Li, L. Wu, B. Xu, J. Hu, Y. Zhou, and Z. Miao. 2018. “Deriving a Time Series of 3d Glacier Motion to Investigate Interactions of a Large Mountain Glacial System with its Glacial Lake: Use of Synthetic Aperture Radar Pixel Offset-Small Baseline Subset Technique.” Journal of Hydrology 559: 596–608. https://doi.org/10.1016/j.jhydrol.2018.02.067.
- Liu, Q., C. Mayer, X. Wang, Y. Nie, K. Wu, J. Wei, and S. Liu. 2020. “Interannual Flow Dynamics Driven by Frontal Retreat of a Lake-Terminating Glacier in the Chinese Central Himalaya.” Earth and Planetary Science Letters 546: 116450. https://doi.org/10.1016/j.epsl.2020.116450.
- Lv, M., H. Guo, X. Lu, G. Liu, S. Yan, Z. Ruan, Y. Ding, and D. J. Quincey. 2019. “Characterizing the Behaviour of Surge- and non-Surge-Type Glaciers in the Kingata Mountains, Eastern Pamir, from 1999 to 2016.” The Cryosphere 13 (1): 219–236. https://doi.org/10.5194/tc-13-219-2019.
- Maurer, J. M., J. M. Schaefer, S. Rupper, and A. Corley. 2019. “Acceleration of ice Loss Across the Himalayas Over the Past 40 Years.” Science Advances 5 (6): eaav7266. https://doi.org/10.1126/sciadv.aav7266.
- Meier, M. F. 1962. “Proposed Definitions for Glacier Mass Budget Terms.” Journal of Glaciology 4 (33): 252–263. https://doi.org/10.3189/S0022143000027544.
- Miles, E., M. McCarthy, A. Dehecq, M. Kneib, S. Fugger, and F. Pellicciotti. 2021. “Health and Sustainability of Glaciers in High Mountain Asia.” Nature Communications 12: 2868. https://doi.org/10.1038/s41467-021-23073-4.
- Moon, T., and I. Joughin. 2008. “Changes in ice Front Position on Greenland's Outlet Glaciers from 1992 to 2007.” Journal of Geophysical Research: Earth Surface 113 (F02022), https://doi.org/10.1029/2007JF000927.
- Nie, Y., Y. Sheng, Q. Liu, L. Liu, S. Liu, Y. Zhang, and C. Song. 2017. “A Regional-Scale Assessment of Himalayan Glacial Lake Changes Using Satellite Observations from 1990 to 2015.” Remote Sensing of Environment 189: 1–13. https://doi.org/10.1016/j.rse.2016.11.008.
- Nie, Y., Y. Zhang, L. Liu, and J. Zhang. 2010. “Monitoring Glacier Change Based on Remote Sensing in the mt. Qomolangma National Nature Preserve, 1976-2006.” Acta Geographica Sinica 65 (1): 13–28. https://doi.org/10.11821/xb201001003.
- Nuth, C., and A. Kääb. 2011. “Co-registration and Bias Corrections of Satellite Elevation Data Sets for Quantifying Glacier Thickness Change.” The Cryosphere 5 (1): 271–290. https://doi.org/10.5194/tc-5-271-2011.
- Nye, J. F. 1951. “The Flow of Glaciers and ice-Sheets as a Problem in Plasticity.” Proceedings of the Royal Society of London 207 (1091): 554–572. https://royalsocietypublishing.org/doi/pdf/10.1098rspa.1951.0140.
- Owen, K., A. Dehecq, D. Quincey, and J. Carrivick. 2018. “Contrasting Geometric and Dynamic Evolution of Lake and Land-Terminating Glaciers in the Central Himalaya.” Global and Planetary Change 167: 46–60. https://doi.org/10.1016/j.gloplacha.2018.05.006.
- Owen, K., D. J. Quincey, J. L. Carrivick, and A. V. Rowan. 2017. “Spatial Variablity in Mass Loss of Glaciers in the Everest Region, Central Himalayas, Between 2000 and 2015.” The Cryosphere 11: 407–426. https://doi.org/10.5194/tc-11-407-2017.
- Paul, F., and F. Svoboda. 2009. “A new Glacier Inventory on Southern Baffin Island, Canada, from Aster Data: Ii. Data Analysis, Glacier Change and Applications.” Annals of Glaciology 50 (53): 22–31. https://doi.org/10.3189/172756410790595921.
- Pronk, J. B., T. Bolch, O. King, B. Wouters, and D. I. Benn. 2021. “Contrasting Surface Velocities Between Lake- and Land-Terminating Glaciers in the Himalayan Region.” The Cryosphere 15 (12): 5577–5599. https://doi.org/10.5194/tc-15-5577-2021.
- Ryan, J. C., A. L. Hubbard, J. Todd, J. R. Carr, J. E. Box, P. Christoffersen, T. O. Holt, and N. Snooke. 2014. “Repeat uav Photogrammetry to Assess Calving Front Dynamics at a Large Outlet Glacier Draining the Greenland ice Sheet.” The Cryosphere Discussions 8 (2): 2243–2275. https://doi.org/10.5194/tcd-8-2243-2014.
- Sahu, R., R. Ramsankaran, R. Bhambri, P. Verma, and P. Chand. 2023. “Evolution of Supra-Glacial Lakes from 1990 to 2020 in the Himalaya–Karakoram Region Using Cloud-Based Google Earth Engine Platform.” Journal of the Indian Society of Remote Sensing 51 (12): 2379–2390. https://doi.org/10.1007/s12524-023-01773-2.
- Samsonov, S., K. Tiampo, and R. Cassotto. 2021a. “Measuring the State and Temporal Evolution of Glaciers in Alaska and Yukon Using Synthetic-Aperture-Radar-Derived (sar-Derived) 3D Time Series of Glacier Surface Flow.” The Cryosphere 15 (9): 4221–4239. https://doi.org/10.5194/tc-15-4221-2021.
- Samsonov, S., K. Tiampo, and R. Cassotto. 2021b. “Sar-derived Flow Velocity and its Link to Glacier Surface Elevation Change and Mass Balance.” Remote Sensing of Environment 258: 112343. https://doi.org/10.1016/j.rse.2021.112343.
- Shi, Y., G. Liu, X. Wang, Q. Liu, C. K. Shum, J. Bao, and W. Mao. 2022. “Investigating the Intra-Annual Dynamics of Kunlun Glacier in the West Kunlun Mountains, China, from Ascending and Descending Sentinel-1 sar Observations.” IEEE Journal of Selected Topics in Applied Earth Observations and Remote Sensing 15: 1272–1282. https://doi.org/10.1109/JSTARS.2022.3142990.
- Shugar, D. H., A. Burr, U. K. Haritashya, J. S. Kargel, C. S. Watson, M. C. Kennedy, A. R. Bevington, R. A. Betts, S. Harrison, and K. Strattman. 2020. “Rapid Worldwide Growth of Glacial Lakes Since 1990.” Nature Climate Change 10 (10): 939–945. https://doi.org/10.1038/s41558-020-0855-4.
- Solgaard, A. M., D. Rapp, B. P. Y. Noël, and C. S. Hvidberg. 2022. “Seasonal Patterns of Greenland ice Velocity from Sentinel-1 sar Data Linked to Runoff.” Geophysical Research Letters 49 (24): e2022GL100343. https://doi.org/10.1029/2022GL100343.
- Strozzi, T., A. Luckman, T. Murray, U. Wegmuller, and C. L. Werner. 2002. “Glacier Motion Estimation Using sar Offset-Tracking Procedures.” IEEE Transactions on Geoscience and Remote Sensing 40 (11): 2384–2391. https://doi.org/10.1109/TGRS.2002.805079.
- Stubblefield, A. G., T. T. Creyts, J. Kingslake, and M. Spiegelman. 2019. “Modeling Oscillations in Connected Glacial Lakes.” Journal of Glaciology 65 (253): 745–758. https://doi.org/10.1017/jog.2019.46.
- Sugiyama, S., P. Skvarca, N. Naito, H. Enomoto, S. Tsutaki, K. Tone, S. Marinsek, and M. Aniya. 2011. “Ice Speed of a Calving Glacier Modulated by Small Fluctuations in Basal Water Pressure.” Nature Geoscience 4 (9): 597–600. https://doi.org/10.1038/ngeo1218.
- Sutherland, J. L., J. L. Carrivick, N. Gandy, J. Shulmeister, D. J. Quincey, and S. L. Cornford. 2020. “Pro-glacial Lakes Control Glacier Geometry and Behavior During Recession.” Geophysical Research Letters 47 (19): e2020GL088865. https://doi.org/10.1029/2020GL088865.
- Tang, X., X. Lv, and Y. He. 2013. “Features of Climate Change and Their Effects on Glacier Snow Melting in Xinjiang, China.” Comptes Rendus Geoscience 345 (2): 93–100. https://doi.org/10.1016/j.crte.2013.01.005.
- Taylor, C., T. R. Robinson, S. Dunning, J. Rachel Carr, and M. Westoby. 2023. “Glacial Lake Outburst Floods Threaten Millions Globally.” Nature Communications 14 (1): 487. https://doi.org/10.1038/s41467-023-36033-x.
- Truffer, M., and R. J. Motyka. 2016. “Where Glaciers Meet Water: Subaqueous Melt and its Relevance to Glaciers in Various Settings.” Reviews of Geophysics 54 (1): 220–239. https://doi.org/10.1002/2015RG000494.
- Tsutaki, S., D. Nishimura, T. Yoshizawa, and S. Sugiyama. 2011. “Changes in Glacier Dynamics Under the Influence of pro-Glacial Lake Formation in Rhonegletscher, Switzerland.” Annals of Glaciology 52 (58): 31–36. https://doi.org/10.3189/172756411797252194.
- Usman, M., and M. Furuya. 2018. “Interannual Modulation of Seasonal Glacial Velocity Variations in the Eastern Karakoram Detected by Alos-1/2 Data.” Journal of Glaciology 64 (245): 465–476. https://doi.org/10.1017/jog.2018.39.
- van der Veen, C. J. 1998. “Fracture Mechanics Approach to Penetration of Bottom Crevasses on Glaciers.” Cold Regions Science and Technology 27 (3): 213–223. https://doi.org/10.1016/S0165-232X(98)00006-8.
- van der Veen, C. J. 2007. “Fracture Propagation as Means of Rapidly Transferring Surface Melt-Water to the Base of Glaciers.” Geophysical Research Letters 34 (1): L01501. https://doi.org/10.1029/2006GL028385.
- Wang, X., X. Guo, C. Yang, Q. Liu, J. Wei, Y. Zhang, S. Liu, Y. Zhang, Z. Jiang, and Z. Tang. 2020. “Glacial Lake Inventory of High-Mountain Asia in 1990 and 2018 Derived from Landsat Images.” Earth System Science Data 12 (3): 2169–2182. https://doi.org/10.5194/essd-12-2169-2020.
- Wang, X., S. Liu, H. Mo, X. Yao, Z. Jiang, and W. Guo. 2011. “Expansion of Glacial Lakes and its Implication for Climate Changes in the Chinese Himalaya.” Acta Geographica Sinica 66 (7): 895–904. https://doi.org/10.11821/xb201107003.
- Wigmore, O., and B. Mark. 2017. “Monitoring Tropical Debris-Covered Glacier Dynamics from High-Resolution Unmanned Aerial Vehicle Photogrammetry, Cordillera Blanca, Peru.” The Cryosphere 11 (6): 2463–2480. https://doi.org/10.5194/tc-11-2463-2017.
- Williams, R. S., D. K. Hall, O. Sigurðsson, and J. Y. L. Chien. 1997. “Comparison of Satellite-Derived with Ground-Based Measurements of the Fluctuations of the Margins of Vatnajökull, Iceland, 1973–92.” Annals of Glaciology 24: 72–80. https://doi.org/10.3189/S0260305500011964.
- xdem_contributors. 2021. “Xdem (v0.0.2).” Zenodo. https://doi.org/10.5281/zenodo.4809698.
- Ye, Q., S. Kang, F. Chen, and J. Wang. 2006. “Monitoring Glacier Variations on Geladandong Mountain, Central Tibetan Plateau, from 1969 to 2002 Using Remote-Sensing and gis Technologies.” Journal of Glaciology 52 (179): 537–545. https://doi.org/10.3189/172756506781828359.
- Young, N. E., R. S. Anderson, S. M. Chignell, A. G. Vorster, R. Lawrence, and P. H. Evangelista. 2017. “A Survival Guide to Landsat Preprocessing.” Ecology 98 (4): 920–932. https://doi.org/10.1002/ecy.1730.
- Zhang, G., T. Bolch, S. Allen, A. Linsbauer, W. Chen, and W. Wang. 2019. “Glacial Lake Evolution and Glacier–Lake Interactions in the Poiqu River Basin, Central Himalaya, 1964–2017.” Journal of Glaciology 65 (251): 347–365. https://doi.org/10.1017/jog.2019.13.
- Zhang, G., T. Bolch, T. Yao, D. R. Rounce, W. Chen, G. Veh, O. King, S. K. Allen, M. Wang, and W. Wang. 2023. “Underestimated Mass Loss from Lake-Terminating Glaciers in the Greater Himalaya.” Nature Geoscience 16 (4): 333–338. https://doi.org/10.1038/s41561-023-01150-1.
- Zhang, G., Y. Ran, W. Wan, W. Luo, W. Chen, F. Xu, and X. Li. 2021. “100 Years of Lake Evolution Over the Qinghai–Tibet Plateau.” Earth System Science Data 13 (8): 3951–3966. https://doi.org/10.5194/essd-13-3951-2021.
- Zhang, D., G. Zhou, W. Li, S. Zhang, X. Yao, and S. Wei. 2022. “A new Global Dataset of Mountain Glacier Centerlines and Lengths.” Earth System Science Data 14 (9): 3889–3913. https://doi.org/10.5194/essd-14-3889-2022.