
 ?Mathematical formulae have been encoded as MathML and are displayed in this HTML version using MathJax in order to improve their display. Uncheck the box to turn MathJax off. This feature requires Javascript. Click on a formula to zoom.
ABSTRACT
Hillside urban expansion (HUE) force nature and semi-nature habitats (referred as nature habitats) to migrate to higher slope areas, potentially resulting in modifications to the landscapes of these habitats, and affect biodiversity and human well-being. To date, few studies have considered the implications of HUE on nature habitat landscapes across different scales. Thus, a spatial identification framework was developed for HUE through the utilization of multisource data. Landscape metrics and spatial econometric models were employed to quantify and assess the impacts of HUE on nature habitat landscapes in China at the city, county, and grid scales, respectively. Results reveal that HUE accounted for 43.25% of urban expansion in China from 2000 to 2020. At the city scale, low HUE was found to have the most significant impact on nature habitat landscape fragmentation. Medium HUE and heavy HUE had more impact of specific landscape metrics with smaller areas at detailed spatial resolutions, and medium HUE have the more considerable impact and surpassed that of low HUE and heavy HUE. HUE exhibited a more pronounced impact on nature habitat landscape fragmentation in regions with larger city sizes and population densities, as well as lower topographic relief and elevations.
1. Introduction
The migration of the population to cities, which is due to rapid urban economic development, has increased the global urbanization rate to over 13% in the past three decades (Zhang et al. Citation2021). Over 50% of the global population resides in urban areas that account for approximately 0.5% of the planet’s landmass, and this is expected to increase to 66% by 2050 (DESA Citation2018). The accelerated growth of urbanization necessitates an expansion of urban land, and extensive studies on urban sustainable development by numerous academics from population capacity (Mao and Jiao Citation2024; Yang, Luan, and Zhang Citation2023), environmental and ecological effects (McDonald et al. Citation2020). However, suitable flat land for living and production is always limited (Liu and Lo Citation2022). The scarcity of resources makes the conflict of urban expansion and land has been exacerbated by rapid population growth and concerns on food security (Kleemann, Struve, and Spyra Citation2023; van Vliet Citation2019). Thus, hillside urban expansion (HUE) has been regarded as a strategic approach to address this contradiction (Shi, Cui, et al. Citation2023). HUE exhibits a notable trend in urban development, wherein construction activities progressively shift from low-lying or flat regions to more elevated or inclined areas. This transition is accompanied by distinct features in terms of landscape, urban layout, and governance, as the natural coverage of sloped territories undergoes a transformation into urbanized land (Shi, Yu, et al. Citation2023; Yang, Guo, et al. Citation2022). Thus, proper implementation of HUE is important for realizing the Sustainable Cities and Communities and 15th Life on Land goals of the Sustainable Development Goals to guide global urban development in harmony with the environment (United Nations Citation2015).
According to the habitat classification scheme established by the International Union for Conservation of Nature (IUCN Citation2013), nature habitats include forests, grasslands, wetlands, et al. In addition, semi-nature habitats like cultivated land and orchards have also been proposed to have an important impact on the environment (Mohamed et al. Citation2024). Intrinsically, understanding the impacts of HUE encroachment on nature habitats (nature and semi-nature habitats referred as nature habitats) can be a fundamental conflict between human activities and the nature environment. This conflict arises from the tension between the expansion of human population and the resulting need for production and living spaces, as well as the preservation of nature habitats characterized by diverse ecosystems (Shi, Liu, et al. Citation2023). HUE has forced the migration of nature habitats to higher altitudes (van Vliet, Eitelberg, and Verburg Citation2017), resulting in significant changes in the landscape of these nature habitats (Jiang et al. Citation2024). In particular, HUE projects that disregard scientific guidelines could have irreversible consequences for the cultivated land (Huang et al. Citation2020), population capacity (Mao and Jiao Citation2024), protected areas (Liu et al. Citation2024) and ecological environment (Jiang et al. Citation2024). These issues considerably threatened the ecological well-being, economic stability, and public safety of surrounding regions (He et al. Citation2021; Ozturk et al. Citation2022; Rentschler et al. Citation2023). Gaining a comprehensive understanding of the spatiotemporal dynamics of HUE, along with its landscape implications, is of utmost importance to effectively guide sustainable land spatial planning and governance strategies.
China has become one of the countries experiencing rapid urbanization on a global scale, leading to a significant conflict between urban development and the preservation of nature habitats since the implementation of reforms and opening-up policies. Since China possesses a substantial population and scarce flat land resources, with hills, mountains, and plateaus covering 70% of the entire land area, more than 50% of the cities are situated in hillside regions (China National Bureau of Statistics Citation2021), which makes conflicts between HUE and nature habitats particularly typical on a large scale. Although the Chinese government has implemented stringent measures to protect the ecological environment in hillside areas (Bai et al. Citation2018; Yang et al. Citation2022), some regions witnessed excessive or extensive development of urban land on sloped terrain. During the decade from 2007 to 2017, HUE in China encroached upon extensive mountainous forest areas and led to the loss of sloped forest land over 1536 km2 (Yang et al. Citation2022). This change has caused an increase in the frequency of nature habitat loss, soil erosion, and wildlife attacks on humans (Gao Citation2019; Shen, Yang, and Wang Citation2023). Therefore, quantifying and characterizing the impacts of HUE on nature habitats hold great importance in facilitating rational land spatial planning for the community in China.
The utilization of a landscape pattern perspective allows for a quantitative evaluation of the impacts of HUE on nature habitats (Li and Qi Citation2019; Shi, Liu, et al. Citation2023). Current remote sensing technologies can offer expedient and efficient means of detecting HUE and its consequential impact on nature habitat landscapes (Huang, Schneider, and Friedl Citation2016; Middel et al. Citation2019). A few studies have identified a growing trend of HUE in recent years through remote sensing data. They found that HUE could significantly reduce damage to arable land, which contributes to food security (Yang, Liu, et al. Citation2022). However, the presence of granularity impact in spatial images with relatively low resolution tends to result in the smoothing or simplification of terrain features, thereby reducing their impacts. Meanwhile, overly roughed data may discretize terrain information, which leads to distortion and nonsignificant results (Zheng et al. Citation2023). For instance, previous studies utilized slope classification criteria with thresholds, such as an elevation difference of 200 m and slopes of 6° and 25° (Yang et al. Citation2021), along with coarse data resolutions (100 or 500 m) (Shi, Wu, and Liu Citation2022; Zhou et al. Citation2021). As a result, the researchers faced difficulties in examining the modifying impact of HUE on the morphological characteristics of nature habitats at a detailed level. The impacts of HUE on nature habitat landscapes, from a macro perspective, were often subject to hierarchical impacts from the national level down to the smallest administrative units (Yuan, Wei, and Xiao Citation2019). However, the administrative scale sacrifices the examination of internal heterogeneity because the existence of the Modifiable Areal Unit Problem (MAUP) caused significant spatial heterogeneity, which introduced uncontrollable errors in conclusions (Chang et al. Citation2022; Ju et al. Citation2021). Reasonably selecting the suitable grid scale incorporating spatial dimension information is crucial to mitigate MAUP inherent in administrative scales. In general, existing studies still have the following deficiencies: (1) The patterns and characteristics of HUE across various scales remain undisclosed. (2) The potential consequences of HUE on natural habitat landscapes remain uncertain at present.
Thus, this study aimed to address two issues: (1) How did the spatiotemporal evolution of HUE vary at different scales? (2) How did HUE affect nature habitat landscape at different scales? To achieve this purpose, a classification framework was developed for identifying HUE. Then, the impacts of HUE on nature habitat landscapes were explored by integrating auxiliary data and spatial econometric models from various scales. Our study fills the gap in studying the impact of HUE on nature habitats at multiple scales and offers new insights for land spatial development, protection, and management in similar regions.
2. Study areas and data sources
2.1. Study areas
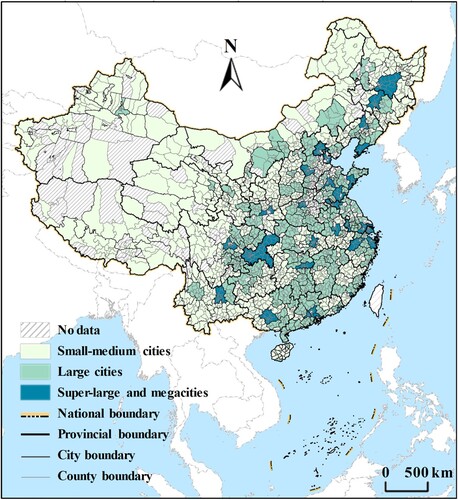
Our study focused on China and selected three scales: city, county, and grid. The city-scale units comprised 367 entities, including direct-administered municipalities, prefecture-level cities, regions, prefectures, autonomous prefectures, and vice-provincial cities. The four direct-administered municipalities of Beijing, Tianjin, Shanghai, and Chongqing were also considered municipal units for statistical analysis to maintain the integrity of the nested structure. The county scale units encompassed 2768 entities, including county-level cities, districts, counties and autonomous counties (). Considering that cities and counties in China vary in size, a grid scale was introduced to objectively depict the dynamic changes in nature habitat landscape. In general, 10 km was seen as the maximum distance of human impact on nature habitats and also commonly regarded as the boundary for Chinese townships (Ren et al. Citation2022; Shi et al. Citation2022), hence the 10 km was chosen as the grid scale (Li and Qi Citation2019). To further explore the impacts of HUE on nature habitat landscapes in cities of different sizes, all cities were classified into three size categories based on the urban population statistics in 2020, following specific criteria outlined in Table S1 (The State Council of P.R.China Citation2014). Notably, certain entities were excluded from spatial econometric analysis due to the lack of statistical data during this process.
Figure 1. Map of the study areas in mainland China.
2.2. Data sources and data processing
This study utilized three types of data: Global Land Cover (GLC30), DEM data, and auxiliary data. GLC30, which was releveled by the National Geomatics Center of China, was based on Landsat TM/ETM images for different periods. It was interpreted through interactive human–machine methods to generate 10 primary land cover types at a global resolution of 30 m. The DEM was derived from the SRTMGL1 v3.0 dataset released by NASA, with a resolution of 30 m and an elevation accuracy of 10 m. Furthermore, auxiliary data included Spatial Population (POP) density data computed using WorldPOP grid data and statistical data, spatial matrix data derived from Point of Interest (POI) data, and administrative boundaries, as detailed in Table S2.
In data processing, multisource spatial data were extracted by administrative boundaries for multiscale analysis. According to the habitat classification scheme developed by the International Union for Conservation of Nature and Natural Resources (IUCN Citation2013), nature habitat mainly refers to the environmental background habitat such as primary forest, grassland, wetland, water, bare land, etc., but also includes cultivated land, economic forest, and shrubland. Therefore, GLC30 for the years 2000 and 2020 served as the foundational data for constructing nature habitat landscapes. Population constraints were applied using county-level population census statistics to address potential issues of underestimated urban population estimates in areas with unconstrained WorldPOP data (Chang et al. Citation2023; Ye et al. Citation2019). The spatial POP density at different scales was calculated to effectively explore the endogenous impact of population density differences in HUE on nature habitat landscapes. All the data were projected in WGS84-Albers at the data preprocessing stage.
3. Methods
3.1. Identifying HUE
A framework was developed to construct and validate the identification of HUE in China, utilizing urban topographical features for enhanced accuracy. First, using the GLC30 for the years 2000 and 2020, artificial land surface data were selected. Following Li, Pan, and Han (Citation2008) and Xiong et al. (Citation2021), the basic landforms were categorized into six types (Table S3). DEM was employed to calculate the Relief Amplitude (RA) and slope of the study area using neighborhood statistics and inverse trigonometric functions (Shi, Wu, and Liu Citation2022), Details can be represented as follows:
(1)
(1) where Hmax and Hmin are the max and min elevations within the neighborhood window. The mean change point method was used to calculate the average RA at different n × n (n = 3, 5, 9, … , 49) windows and identified the optimal statistical window size. Subsequently, considering the difficulty in terraced transformation, HUE was classified into several categories in accordance with the criteria introduced by Xu, Zhao, and Fan (Citation2021) (). Then, considering the combining RA and slope division criteria, the spatial patterns of HUE were refined into four types: no HUE, low HUE, medium HUE, and heavy HUE ( and Table S4).
Figure 2. The classification framework of HUE.
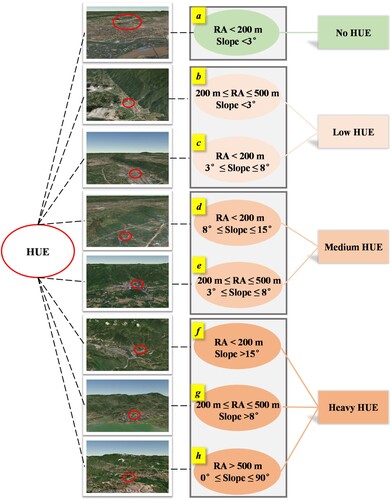
Table 1. The grading criteria of slope land.
Finally, the accuracy of HUE was assessed through random sampling visual comparison. The samples were randomly selected from each type of identified HUE results across China to analyze slope, terrain, and urban blocks on the high-resolution map of Google Earth (Duque et al. Citation2015). The accuracy of HUE identification was evaluated using both overall accuracy (OA) and the Kappa coefficient.
3.2. Calculating nature habitat landscape metrics
The external performance of nature habitats can be represented by landscape metrics. For a comprehensive analysis of nature habitats, selected six nature habitat landscape metrics, including ED, MPS, AWMSI, MENNI, CONTAG and SHDI. These metrics cover aspects like area edge, density, differences, shape complexity, proximity, aggregation, and diversity (Aguilera, Valenzuela, and Botequilha-Leitão Citation2011; Zheng, Wang, and Li Citation2023). Moreover, another six nature habitat landscape metrics were selected for robustness testing, including LPI, NP, AWMPFD, MP, COHESION and SHEI (Li and Qi Citation2019). The specific nature habitat landscape metrics are detailed in .
Table 2. Interpretations of nature habitat landscape metrics.
3.3. Developing the analytical model
The spatial econometric model can analyze the distribution, connections, and impacts of objects in space. Thus, it mitigates the shortcomings in traditional regression models arising from spatial heterogeneity and autocorrelation of variables (Anselin Citation2022; Qiang et al. Citation2021). Given the spatial heterogeneity and autocorrelation present at different scales for the HUE and nature habitats, the utilization of spatial econometric models was deemed suitable for enhancing the accuracy of results. Concerning the selection of spatial weight matrices, administrative scales were often more affected by policy than the nature environment. By contrast, the impact of regional nature environments was more pronounced at the grid scale. Consequently, at the city and county scales, the corresponding locations of governmental entities were chosen, and their respective inverse distance spatial matrices were computed using Euclidean distance. At the grid scale, proximity spatial matrices were calculated for neighboring spaces, which served as the basis for analyses and discussions at different scales. Notably, urban expansion is significantly affected by nature environmental and social factors (e.g. urban development). Thus, four control variables, namely, DEM, Relief Degree of Land Surface (RDLS), no HUE, and POP density, were selected to control the impacts. The spatial auto regressive (SAR) and the spatial error model (SEM) were employed to solve issues of individual heterogeneity and multicollinearity. The respective formulations of these models are as follows:
(2)
(2)
(3)
(3) where i and j represent different research units at i and j scales, i, j = 1,2, … ,N.
represents the nature habitat landscape metric for unit j in different years t,
is the element of the spatial weight matrix,
stands for the selected four explanatory variables,
represents spatial specific effects,
represents spatial correlation errors, and
represents the error term.
Considering that DEM and RDLS were time-invariant variables among the control variables, a combined Ordinary Least Squares (OLS) and spatial fixed effects model were utilized for discussion. On this basis, Lagrange Multiplier (LM) tests and robust LM tests were introduced. The optimal selection between SAR and SEM was determined by comparing the significance and magnitude of the LM test. POP density was derived from WorldPOP data and constrained by the Fifth (2000) and Seventh (2020) Population Censuses of China. RDLS was calculated from DEM data within research units at different scales, as detailed below:
(4)
(4) where H denotes the elevations of DEM data within the research unit; A is the total area and P(A) is the slope less than 3° area within the research unit.
4. Results
4.1. Spatiotemporal evolution of HUE at different scales
At the city scale, HUE in China exhibited a significant and differentiated trend. During the study period, the newly built-up areas of HUE accounted for 43.25% of urban expansion, with a growth rate 2.36 times higher than that of the contemporaneous urban expansion ( (a)–(b)). The areas of HUE proportion of urban expansion in China increased from 28.59% in 2000 to 35.53% in 2020 ( (a)–(f)), in which the growth rates of low HUE, medium HUE, and heavy HUE were 68.16%, 17.86%, and 13.36%, respectively. Low HUE mainly occurred in regions other than Qinghai, Tibet, and the three northeastern provinces. The medium and heavy HUE cities were distributed in the southwestern mountainous areas, southeastern hills, and the Loess Plateau. This distribution indicates that hillside cities in China were mainly dominated by low HUE. Meanwhile, the proportion of medium and heavy HUE was more prominent in mountainous and plateau areas.
Figure 3. Spatiotemporal evolution of HUE at different scales.
Note: HUE is expressed by the Hillside urban expansion areas; (a) is spatial arrangement of HUE at city scale in 2000, (b) is spatial arrangement of HUE at city scale in 2020, (c) is spatial arrangement of HUE at county scale in 2000, (d) is spatial arrangement of HUE at county scale in 2020, (e) is spatial arrangement of HUE at grid scale in 2000, and (f) is spatial arrangement of HUE at grid scale in 2020.
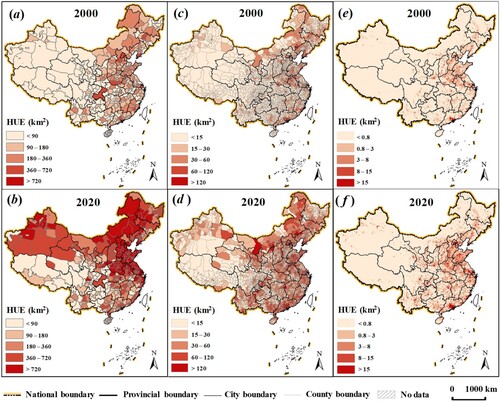
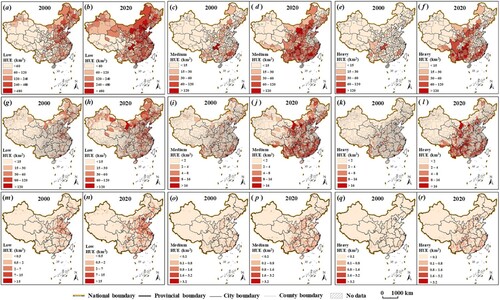
Figure 4. Spatiotemporal evolution of HUE types at different scales.
Note: HUE expressed by the areas of HUE (a) is spatial arrangement of low HUE at city scale in 2000, (b) is spatial arrangement of low HUE at city scale in 2020, (c) is spatial arrangement of medium HUE at city scale in 2000, (d) is spatial arrangement of medium HUE at city scale in 2020, (e) is spatial arrangement of heavy HUE at city scale in 2000, (f) is spatial arrangement of heavy HUE at city scale in 2020. (g) is spatial arrangement of low HUE at county scale in 2000, (h) is spatial arrangement of low HUE at county scale in 2020, (i) is spatial arrangement of medium HUE at county scale in 2000, (j) is spatial arrangement of medium HUE at county scale in 2020, (k) is spatial arrangement of heavy HUE at county scale in 2000, (l) is spatial arrangement of heavy HUE at county scale in 2020. (m) is spatial arrangement of low HUE at 10 km grid scale in 2000, (n) is spatial arrangement of low HUE at grid scale in 2020, (o) is spatial arrangement of medium HUE at grid scale in 2000, (p) is spatial arrangement of medium HUE at grid scale in 2020, (q) is spatial arrangement of heavy HUE at grid scale in 2000, (r) is spatial arrangement of heavy HUE at grid scale in 2020. Note: HUE is hillside urban expansion.
HUE at the county scale exhibited a more dispersed trend than that at the city scale ( (c)–(d)). The HUE along the Qinling–Huaihe Line north and south difference was further narrowed compared with that at the city scale. HUE is mainly concentrated in various provincial capitals and their surrounding towns. According to the HUE types depicted in (g)–(l), low HUE at the county scale is mainly distributed in the North and Northeast China Plain, and Inner Mongolia ranges, with proportions significantly different from those at the city scale. Medium HUE is more clearly distributed in areas with complex terrain than at the city scale. Therein, a substantial portion of counties in Yunnan, Chongqing, Guizhou, Guangdong, Fujian, Zhejiang, Inner Mongolia, and the southeastern part of Gansu experienced extensive expansion of heavy HUE.
At the grid scale ( (e)–(f) and (i)–(r)), the distribution of HUE was more clearly identifiable around urban entities, especially major urban clusters and provincial capitals. The HUE at 10 km scale revealed details imposed by the surface features that city and county scales cannot capture. For example, the HUE in Henan and Hebei was mainly concentrated at the junction of the Taihang Mountains on the east side and the North China Plain. The Greater Khingan Range and the Shandong hilly region exhibited a more distinct HUE pattern. The HUE in other regions also aligned closely with the orientation of the mountain slope. For example, the HUE in Gansu, Ningxia, Inner Mongolia, and Shaanxi was impacted by the Hexi Corridor and the Yellow River.
4.2. Landscape characteristics of nature habitats in China
To comprehensively investigate the impacts of HUE on nature habitat landscapes, it is imperative to initially acquire a comprehensive understanding of nature habitat landscapes in China across various scales. The analysis shows that China’s nature habitats across complex terrains underwent a transformation marked by fragmentation and a rise in variety, with evidence of more significant fragmentation at smaller scales between 2000 and 2020.
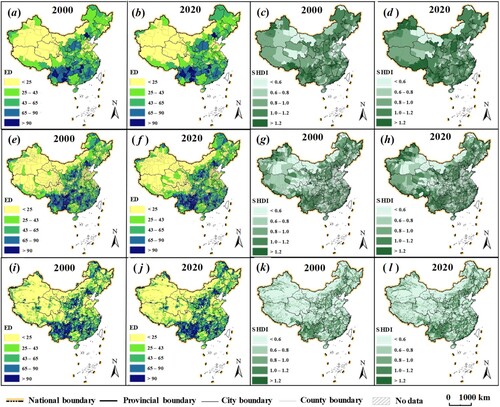
shows that CONTAG decreases by 1.05 at the city scale, 1.73 at the county scale, and 0.49 at the grid scale. The results indicate an increasing trend of nature habitat landscape fragmentation as the scale decreases. MENNI increases by 22.89, 13.49, and 18.13 at the three scales, respectively, which suggests a trend of increasing separation and dispersion of similar nature habitat landscapes at different scales. ED increases by 0.24, 0.50, and 0.63 at the three scales, which implies that nature habitat landscapes tend to become more fragmented with urbanization. MPS shows increases of 3.78 and 5.23 at the city and county scales and a decrease of 92.47 at the grid scale, which indicates that nature habitat landscape fragmentation intensifies at the grid scale but decreases at the administrative scale. The AWMSI decreases by 3.71, 0.99, and 0.01 at the three scales, which means that a smaller scale corresponds to a more regular habitat pattern. In terms of nature habitat landscape diversity, SHDI increases by 0.07, 0.07, and 0.05 at the three scales, which suggests that the overall species diversity within nature habitats continues to increase as urbanization develops.
Table 3. Nature habitat landscape metrics at different scales.
From the perspective of spatial evolution (, S1, and S2), the nature habitat landscapes exhibit increased fragmentation and diversification in the Yungui Plateau, Loess Plateau, Greater Khingan Mountains, Southeast Hills, and the Beijing–Tianjin–Hebei region in China. ED and SHDI in this region present large values, and MENNI, CONTAG, and MPS present low values at the three scales. In the northeast region of China Plain, the nature habitat landscapes are more regular and concentrated due to the large area of deserts and grasslands. AWMSI reveals high values in the western regions such as Inner Mongolia, Xinjiang, and Tibet at the city and county scales due to differences in unit area. However, at the grid scale, areas with higher values of AWMSI, which means more complex and diverse nature habitat landscapes, appear in regions consistent with the conclusions drawn from other indices. The findings suggest that nature habitat landscapes experienced more fragmentation and complexity in intricate terrains and dense populations. The HUE uphill due to population growth could be a significant contributing factor to the increased fragmentation and complexity observed in natural habitat landscapes, to some degree.
Figure 5. Evolutions of nature habitat landscapes in China.
Note: (a) is ED distribution at city scale in 2000, (b) is ED distribution at city scale in 2020, (c) is SHDI distribution at city scale in 2000, (d) is SHDI distribution at city scale in 2020, (e) is ED distribution at county scale in 2000, (f) is ED distribution at county scale in 2020. (g) is SHDI distribution at county scale in 2000, (h) is SHDI distribution at county scale in 2020, (i) is ED distribution at grid scale in 2000, (j) is ED distribution at grid scale in 2020, (k) is SHDI distribution at grid scale in 2000, and (l) is SHDI distribution at grid scale in 2020.
4.3. Impacts of HUE on nature habitat landscapes
The fragmentation of nature habitat landscapes is predominantly shaped by anthropogenic influences. Larger scales of urbanization may yield more intricate and varied nature habitat landscapes. For example, urbanization in hilly areas has the potential to exacerbate nature habitat landscape fragmentation (). The OLS regression analysis reveals the variations of correlation observed across different scales between HUE and nature habitat landscapes (, S3, and S4). However, given the significant spatial autocorrelation of the nature habitat landscapes, as indicated by the test of Moran’s I (Table S5), the spatial econometric model was chosen to avoid biases in the results caused by the failure to consider spatial heterogeneity and autocorrelation. The spatial panel measurement model of Time Fixed Effect (TFE) was also selected due to that the nature of data for the control variables remained constant over time. The SEM model was determined to be the best choice by the LM test. report the spatial metrology results of nature habitat landscape metrics at the city, county, and grid scales, respectively. The coefficient λ of the space matrix was significant at different scales.
Figure 6. HUE encroaches nature habitats in typical regions. (a) is urban area in GLC30 at city scale in 2000, (b) is urban area in slope types at city scale in 2000, (c) is HUE in GLC30 at city scale in 2020, (d) is HUE in slope types at city scale in 2020, (e) is urban area in GLC30 at county scale in 2000, (f) is urban area in slope types at county scale in 2000, (g) is HUE in GLC30 at county scale in 2020, (h) is HUE in slope types at county scale in 2020, (i) is urban area in GLC30 at grid scale in 2000, (j) is urban area in slope types at grid scale in 2000, (k) is HUE in GLC30 at grid scale in 2020, and (l) is HUE in slope types at grid scale in 2020.
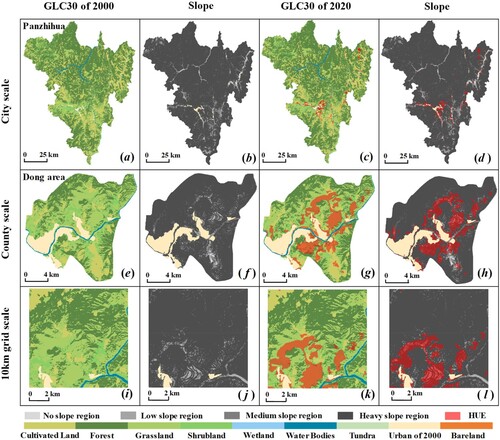
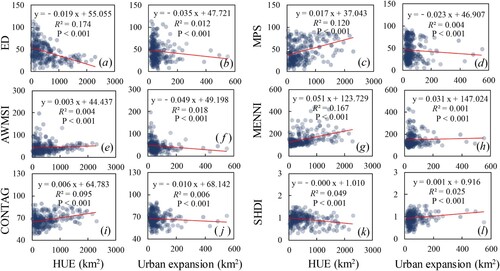
Figure 7. Correlations between HUE and nature habitat landscapes at different scales in 2020.
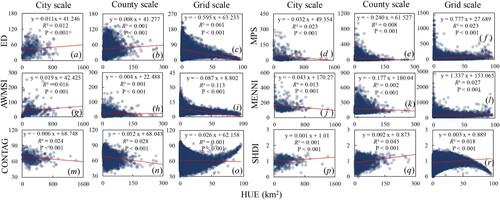
Table 4. Results of spatial panel regression at the city scale.
Table 5. Results of spatial panel regression at the county scale.
Table 6. Results of spatial panel regression at the grid scale.
At the city scale, the correlation shows that nature habitat landscapes tend to be more fragmented with the increase in HUE (, S6, and S7). When HUE increases by 1‰, ED enhances by 2.3%, MPS decreases by 1.7%, AWMSI increases by 1.6%, MENNI declines by 1.2%, CONTAG reduces by 0.3%, and SHDI improves by 0.8%. Low HUE has the greatest impact on nature habitat landscapes, and medium HUE has a greater impact on ED, MENNI, COUTAG, and SHDI than heavy HUE. Heavy HUE has a greater impact on MPS and AWMSI than medium HUE. Among the control factors, the impact of HUE on nature habitat landscape fragmentation tends to decrease with an increase in slope. RDLS shows a significant negative correlation among many indicators, which indicates that HUE in areas with smaller fluctuation had a greater impact on nature habitat landscape fragmentation. In addition, AWMSI value decreases by 2.6% for each 1‰ increase in POP density with a significant negative correlation. Other indicators maintain the same correlation impact with HUE, except MENNI, which is insignificant at different types of HUE.
At the county scale (, S8, and S9), with the exception of the increased impact degree of AWMSI, the remaining indicators exhibit a declining trend in impact. Meanwhile, the correlation between HUE and nature habitat landscapes remains consistent. The impact of medium and heavy HUE on nature habitat landscapes at the county scale is significantly greater than the city scale, with both reaching twice the impact degree. Compared with the city scale, the correlation between DEM and nature habitat landscapes is insignificant for medium and heavy HUE at the county scale. RDLS shows a similar pattern as observed at the city scale. POP density is positively correlated with MENNI but it is insignificant for medium and heavy HUE. The positive correlation between ED and the negative correlation of MPS is reduced by an average of 67%, the positive correlation of SHDI is reduced by 30%, and the negative correlation of AWMSI is increased by an average of 35%.
At the grid scale (, S10, and S11), the correlation between HUE and nature habitat landscapes remains consistent with that at the city scale, except for AWMSI. Its impact degree shows a decreasing trend, except for CONTAG and SHDI, which increase Different from the city and county scales, the impact of HUE on AWMSI at the grid scale presents a significant negative correlation, which remains negative even in low HUE scenarios. A positive correlation is observed in medium and heavy HUE, but the correlation coefficients are only 0.008 and 0.007. Among the control factors, the correlation of DEM at the grid scale is consistent with that at the city scale but has a lower impact and medium and heavy HUE are more significant than those at the county scale. The impact of RDLS remains consistent with the correlation observed at the city scale, except that MENNI is found to be insignificant. The impact of POP density at the grid scale is between those observed at the city and county scales. However, it shows positive and negative correlation with AWMSI and MENNI, respectively.
5. Discussion
5.1. The HUE identification framework accurately identifies HUE in China
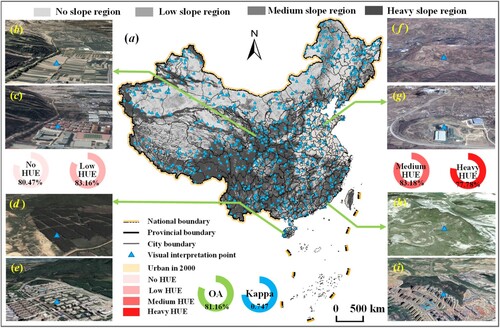
The spatial identification framework for HUE was devised by considering geomorphic types, RA, and slope classification criteria, which resulted in improved recognition accuracy following a visual examination of Google Earth images. Specifically, 1,000 points were randomly selected according to the HUE types for visual interpretation. Then, the occurrence of urban expansion was determined using Google Earth historical images (). The results show that the OA reaches 81.16%, and the Producer’s Accuracy rates of no, low, medium, and heavy HUE are 80.47%, 83.16%, 83.18%, and 77.78%, respectively. The Kappa coefficient is 0.747 and has good precision.
Figure 8. Spatial verification of the HUE and Google earth images in China.
Note: (b), (d), (f), and (h) represent non-urban land in 2000 on slope area; (c), (e), (g), and (i) represent the land cover change to urban land in 2020 on slope area. HUE stands for hillside urban expansion, and OA is overall accuracy.
Based on the constructed HUE framework, high-precision results for the spatiotemporal evolution of HUE at different scales can be obtained using GLC30 land use/cover and DEM data at a resolution of 30 m. The evaluation is superior to that of Zhou et al. (Citation2021), who used CNLUCC data with a 100 m resolution, and Shi, Wu, and Liu (Citation2022), who utilized nighttime light data with a 500 m resolution for analyzing HUE exploration at the city scale. According to basic topography, urban planning guidelines, and slope standards in land use, a more refined framework with four categories and eight subcategories was formulated. We specifically defined areas with no HUE as those with a low amplitude of less than 200 m and a slope of less than 3°. We also defined different slope types as areas eligible for natureization based on meeting a threshold of relief or slope. It avoids the insufficient accuracy caused by the rough judgment of slope area caused by the judgment criteria of slope above 6° and RA under 200 m slope above 6° or RA above 200 m (Ju et al. Citation2021; Shi, Wu, and Liu Citation2022). This approach also improves the reliability of identifying and delineating HUE areas.
5.2. HUE exhibits significant spatiotemporal differences in China
The spatiotemporal distribution of HUE was affected by the scale effect, and endogenous differences can be demonstrated by refining the scale. At the city scale, HUE in China has a significant regional pattern, and that at the county scale is more specific than the city scale. At the grid scale, the spatiotemporal characteristics include agglomeration in large-scale cities, development around urban entities, and continuous distribution along terrain and land use types. Given the generally large urban area and multiple urban agglomeration areas in Northwest China, the total area of HUE for cities in the northwest of the Qinling–Huaihe Line is inaccurately high at the coarse scale due to the MAUP effect (Ju et al. Citation2021). Only the grid scale shows that HUE is mainly distributed near the urban entities, and the HUE area is insignificantly higher than that of the cities in the southern Qinling–Huaihe Line. Although Qinghai and Tibet also have large city units, the steep terrain, harsh environment, and low population in the cities of the Qinghai–Tibet Plateau limited widespread urban expansion.
HUE is significantly affected by the socioeconomic development of the city. The volume of HUE was related to the distribution of urban population, economic development, urban development, and other policies (Zhou et al. Citation2021). The terrain in densely populated areas would affect urban expansion, and the progress of the economy and technology, as well as the relative enrichment of human resources, has led to a situation of large-scale slope development. The Chinese government also actively promoted the coordinated development of regions from 2000 to 2020. It implemented the western development policy (Zheng et al. Citation2022), set up urban agglomerations to form a regional development pattern between each other, and vigorously developed infrastructures to facilitate transportation in mountainous cities in western China (Li and Li Citation2019). The built-up area of mountainous cities in densely populated cities exceeded the population growth rate by 29.9 times in 20 years (China National Bureau of Statistics Citation2021). Therefore, the total area of HUE was small but concentrated around the city, especially in the western mountain cities.
HUE also presented a significant urban–rural gradient effect with the refinement of the scale. Low HUE was mainly found in the northeastern Qinling–Huaihe Line of China. The reason is that the flat land was mostly classified as the cultivated land red line. The low-slope area at the junction of flat land and slope land is essential to solve the contradiction between agricultural land and urban land. Medium and heavy HUE were mainly distributed in urban development areas and significantly limited by the large differences in topography. The population in China’s Second Ladder and the Southeastern hills was relatively concentrated in urban areas. HUE types also had significant spatiotemporal differences at various scales. HUE in Xinjiang, Inner Mongolia, and other regions, which cannot be assessed on the city and county scales, was clearly identified as mainly low HUE in a small range of population clusters at the grid scale. This may result from the limited urban expansion in these regions, given that they generally had unlivable environments and sparse populations. In medium HUE areas, the main differences were mainly observed in regions with steep terrain, while other areas had minor spatiotemporal differences at the city and county scales. The spatial distribution of medium HUE was mainly dominated by terrain and river trends at the grid scale. In contrast with medium HUE, heavy HUE was more prominent in areas with a developed economy, large population, or steep terrain. Thus, the extreme scarcity of available flat land resources necessitated urban expansion to develop on steeper slopes.
5.3. HUE exacerbates nature habitat landscape fragmentation
Through the analysis of the results in Section 4.3, we found that HUE can lead to more fragmentation of nature habitat landscapes. Six metrics were used to validate the robustness of the results. LPI, NP, and MPI had contrary correlation results compared with ED, MPS, and MENNI, respectively. AWMPFD, COHESION, and SHEI show consistent correlation results as AWMSI, CONTAG, and SHDI, respectively. The results in and S12 show that the remaining conclusions were consistent with the spatial econometric regression at the city and county scales, except for some parts of the proximity index that did not pass the significance test in the HUE types. The proximity index and the cohesion and dispersion index failed the robustness test at the grid scale, which may be due to that the selected MPI was highly sensitive to the patch size. The large patch had a lower proximity, and according to the results of MPS at the grid scale, it was significantly higher than the administrative scale. The MENNI results remained reliable.
Table 7. Partial results of robustness test of spatial panel regression.
China’s economic development has promoted the rapid growth of urbanization. This situation has led to competition between construction land and agricultural land for flat land resources. Nevertheless, with the advancement and implementation of technologies such as land grading and sea reclamation (Yan et al. Citation2023; Yang, Guo, et al. Citation2022), urban expansion to slope land has become a way to alleviate the contradiction. Since 2000, China has not only vigorously promoted the policy of large-scale development of the west in the region but also actively promoted the integrated growth of different-level cities in the west with a large amount of capital, technology, and talent (Zheng et al. Citation2022). Cities across the country experienced large-scale HUE at different scales from 2000 to 2020 to alleviate the increasing scarcity of flat land resources and protect agricultural land (). However, HUE has a more significant impact on nature habitat landscape fragmentation than urban expansion in the same period (). Especially, medium HUE had a greater adverse impact on biodiversity, environmental carrying capacity, and biological information exchange in a small range. For example, according to the statistical data on geological disasters in China, man-made geological disasters during the period of 2005–2018 showed a rapid rising trend (Zhou et al. Citation2021).
Figure 9. Correlations between HUE and urban expansion by entities area on landscape pattern in 2000.
The significant urban–rural gradient effect of HUE exacerbated the impact on habitat fragmentation, complexity, and diversification, as indicated by the results of spatial metrology, particularly at larger scales. HUE at the city scale led to a significant decrease in the average area of nature habitats with a rise in the proximity of the same habitats. The impact was greater than that observed at the county and grid scales in intensifying the diversity of the nature habitat landscapes. The trend of habitat fragmentation at different scales also means that the development of urbanization increased the difficulty in an ecological material exchange between patches and inhibited ecological exchanges such as species migration between patches. Low HUE had the greatest impact on nature habitat landscape metrics at the city scale. Medium HUE had more impact on MPS and MENNI at the county and grid scales than at the city scale. Heavy HUE had the least impact on all scales. The impact of medium HUE (with a total area of 17%) on habitat fragmentation was consistent with that of low HUE (with a total area of 70%) on a smaller scale, according to the abovementioned analysis. This finding indicates that, with the refinement of the scale, habitat fragmentation was significantly affected by low HUE of a large range and medium HUE of a high destruction degree. It suggests that HUE in China still has non-compliant destructive expansion in some areas. Considering the different sizes of urban construction, the discussion at the county scale reveals that low HUE was the primary factor causing the complexity of the nature habitat landscapes ( and S13). The impact degree increased with the rise in city sizes. Medium and heavy HUE had U-shaped trends. Specifically, they decreased first and then increased. The same conclusion is confirmed in the results of other nature habitat landscapes, which verifies that the impact of HUE on ecological habitats in China was still dominated by low HUE. Meanwhile, small-medium cities were mostly located in areas with more complex terrain and had a small construction land base. Thus, it had a more obvious impact on nature habitat landscapes cutting and thinning under the same HUE, and the impact of medium and heavy HUE on habitat complexity was relatively more substantial.
Table 8. The spatial panel regression results of AWMSI in different urban sizes at the county scale.
According to the results of the impact factors, the impact of HUE on surface transformation was significantly greater than that of no HUE on ecology at different scales. This result indicates that HUE can promote the development of nature habitats to become more diversified, fragmented, and complicated. However, no HUE makes the nature habitat landscapes develop in a more clustered and structured direction. The impact of no HUE on nature habitat landscape fragmentation at different scales was opposite to that of HUE, except for AWMSI (, , and S3–S8). No HUE in AWMSI at the city scale was insignificant, and the impact was opposite under the county scale. However, the impact was consistent under the grid scale. By considering the magnitude of a correlation coefficient, the positive impact of HUE on nature habitat landscape fragmentation was higher than the negative impact of no HUE, and the difference in impact was larger at the city scale than at the county and grid scales. The restrictions and laws on the development of flat land are relatively perfect in the urban development process, which has made the development of flat land give importance to the conservation of the environment and nature habitats. However, the protection of nature habitat landscape fragmentation is still relatively lacking in the development of mountainous areas. In addition, larger-sized cities had a significant impact on the fragmentation of different ecological habitats by HUE. These cities are located in areas with superior nature conditions and a relatively concentrated population, economy, and technology. This concentration makes the artificial environmental remediation in the process of HUE more scientifically oriented (Shi, Liu, et al. Citation2023). The trend leads to greater diversity, complexity, and functional zoning of nature habitats [45].
In addition, the impact of HUE on nature habitat landscape fragmentation at the city scale was greater in areas with higher altitudes, more complex terrain, and densely populated areas. Meanwhile, the impact at the county and grid scales was reduced by steps. However, blindly increasing urban population density cannot promote the agglomeration development of nature habitats. Thus, in the future, more consideration should be given to the division of HUE functional areas. In addition, ecologically sustainable development requires the institution of proper land use and population density planning.
5.4. Methodological implications
The administrative scales reflected the difference in the hierarchical relationship and policy orientation of HUE in urban development concerning nature habitat landscape fragmentation (Yu, Chi-Man Hui, and Shen Citation2023). The grid scale broke administrative boundaries and provided a new understanding for the detailed understanding of spatiotemporal changes and governance of nature habitat landscape fragmentation. The hierarchical structure of the urban administrative system in China significantly impacts the coordinated development of humans and the environment (Ma, He, and Wu Citation2016). Thus, regional land use indicators were controlled by different-level governments, which led to direct and significant differences in the impact of HUE on nature habitat landscape fragmentation at different scales. Therefore, two administrative scales, namely, city and county, were selected for analysis. However, the land types contained in larger scales, such as the city scale, are more complex. Furthermore, the different sizes of urban areas may lead to inconsistent results, and exploration regarding the impact between different administrative areas is lacking. Therefore, the grid scale was introduced, which revealed that the impact of the administrative scale on HUE was significantly higher than that of the grid scale due to the traditional boundary of urban sustainable development dominated by a policy in the region. The grid size of 10 km was defined as the maximum disturbance distance of nature habitat by human activities, as referred to by Ren et al. (Citation2022). In addition, 10 km is generally considered the division limit of human agglomeration units (Chen, Chen, and Li Citation2020). This scale usually includes man-made land cover changes and nature habitat changes. Therefore, the grid scale of 10 km was added to explore the spatiotemporal differences in HUE and its impact on nature habitat landscape fragmentation.
In addition, HUE may have a certain spatial autocorrelation and heterogeneity due to the differences in spatiotemporal patterns, and the nature environment in the process of urban development significantly affects the pixel-level POP density, economic development, and nature habitat distribution. Thus, multicollinearity may exist among different variables. Although multiple linear regression can eliminate the multicollinearity within factors, HUE can also be used in urban development. However, the spatial autocorrelation between variables cannot be considered and the selection of a spatial econometric model can more accurately show the impact of HUE and no HUE on nature habitat landscape fragmentation. The accuracy of the model can be further improved by adding control variables. The outcomes of this study further reveal that the spatial econometric model is capable of adequately quantifying the impact of complex HUE on nature habitat landscape fragmentation at multiple scales.
5.5 Limitations and future work
In light of the practical need for collaborative optimization of HUE and the protection of nature habitat, this study had innovatively constructed an HUE recognition framework. Based on the fine identification of China’s HUE in 2000 and 2020, we have demonstrated that complex HUEs have important impacts on nature habitat landscape fragmentation at multiple scales. This discover provides new ideas and perspectives for urban field research and offers empirical references for the sustainable development of Chinese and similar global cities. Despite this, there are still the following two prospects to address limitations in the future. First, this study was based on a simple spatial measurement of HUE on nature habitat landscape fragmentation in China. In the future, the impact mechanism of slope climbing on ecology will be explored, and machine learning models will be used to conduct simulations in different situations. This way will enrich the understanding of the impact of HUE on nature habitat landscape fragmentation. Second, our study explored nature habitat landscape fragmentation caused by HUE from the landscape perspective, but the significant impact of nature habitat landscape fragmentation on biodiversity should also be considered (Teckentrup, Kramer-Schadt, and Jeltsch Citation2019). The control of HUE to alleviate the deterioration of biodiversity caused by nature habitat landscape fragmentation will be a supplement and improvement in the future. Accordingly, empirical references will be provided for formulating more reasonable land use policies and environmental protection methods.
6. Conclusion
An advanced understanding of the nexus between HUE and nature habitats are essential for the enduring development of mountain cities. The conclusions were extracted from GLC30 and DEM data with a 30 m resolution based on the perspective of the landscape pattern. First, HUE accounted for 43.25% of newly urban land in China from 2000 to 2020. Low HUE was the primary type in China, and it concentrated in the North China Plain, provincial capitals, and the vicinity of major urban agglomerations. Medium and heavy HUE were mainly found in mountainous areas like Yunnan–Guizhou Plateau in southwestern China, the Southeastern Hilly Belt, and the Loess Plateau. Second, HUE was one of the main factors leading to nature habitat landscape fragmentation at different scales, and it affected and inhibited the habitats agglomeration effect of no HUE. The wide distribution of low HUE had a significant impact on nature habitat landscape fragmentation, whereas heavy HUE had a smaller role. But nature habitat landscape fragmentation was more sensitive to medium and heavy HUE, which was reflected in that the impact increased with the refinement of the scale. Finally, HUE had a significant urban–rural gradient effect on nature habitat landscape fragmentation. The greater impact between HUE and nature habitat landscape fragmentation was positively correlated with urban size and POP density but negatively correlated with RDLS and altitude.
Acknowledgements
The authors also want to express our respect and gratitude to the anonymous reviewers and editors for their valuable comments on improving the quality of the paper.
Disclosure statement
No potential conflict of interest was reported by the authors.
Data availability statement
Global land cover data, DEM data, WorldPOP data, point of interest data, and China’s national and provincial administrative boundaries were all utilized in our study. Please refer to 2.2 section for details.
Additional information
Funding
References
- Aguilera, Francisco, Luis M Valenzuela, and André Botequilha-Leitão. 2011. “Landscape Metrics in the Analysis of Urban Land Use Patterns: A Case Study in a Spanish Metropolitan Area.” Landscape and Urban Planning 99 (3-4): 226–238. https://doi.org/10.1016/j.landurbplan.2010.10.004.
- Anselin, Luc.. 2022. “Chapter 6: Spatial econometrics.” In Handbook of Spatial Analysis in the Social Sciences, edited by Sergio J. Rey and Rachel Franklin , 101–122. Cheltenham, UK: Edward Elgar Publishing. https://doi.org/10.4337/9781789903942.00014.
- Bai, Yang, Christina P Wong, Bo Jiang, Alice C Hughes, Min Wang, and Qing Wang. 2018. “Developing China’s Ecological Redline Policy Using Ecosystem Services Assessments for Land Use Planning.” Nature Communications 9 (1): 3034. https://doi.org/10.1038/s41467-018-05306-1.
- Chang, Zhijian, Shirao Liu, Yizhen Wu, and Kaifang Shi. 2022. “The Regional Disparity of Urban Spatial Expansion is Greater Than That of Urban Socioeconomic Expansion in China: A New Perspective from Nighttime Light Remotely Sensed Data and Urban Land Datasets.” Remote Sensing 14 (17): 4348. https://doi.org/10.3390/rs14174348.
- Chang, Zhijian, Yizhen Wu, Lili Liu, Jingwei Shen, and Kaifang Shi. 2023. “Exploring the Correlations Between SNPP-VIIRS Nighttime Light Data and Population from a Multiplescale Perspective.” IEEE Geoscience and Remote Sensing Letters 20:3001905. https://doi.org/10.1109/LGRS.2023.3285551.
- Chen, Shili, Haohui Chen, and Xun Li. 2020. “The Ability of Nighttime Imagery in Monitoring Economic Activity in Different Scales.” Scientia Geographica Sinica 40 (09): 1476–1483. https://doi.org/10.13249/j.cnki.sgs.2020.09.009.
- China National Bureau of Statistics. 2021. China City Statistical Yearbook. Beijing: China Statistics Press.
- DESA, UN. (United Nations Economic & Social Affairs). 2018. World Urbanization Prospects: The 2018 Revision. https://www.un.org/development/desa/pd/.
- Duque, Juan C, Jorge E Patino, Luis A Ruiz, and Josep E Pardo-Pascual. 2015. “Measuring Intra-Urban Poverty Using Land Cover and Texture Metrics Derived from Remote Sensing Data.” Landscape and Urban Planning 135:11–21. https://doi.org/10.1016/j.landurbplan.2014.11.009.
- Gao, Jixi. 2019. “How China Will Protect One-Quarter of Its Land.” Nature 569 (7755): 457–458. https://doi.org/10.1038/d41586-019-01563-2.
- General Assembly Resolution of United Nations. 2015. “Transforming Our World: The 2030 Agenda for Sustainable Development.” UN Doc. A/RES/70/1 (September 25, 2015).
- He, Chunyang, Qingxu Huang, Xuemei Bai, Derek T Robinson, Peijun Shi, Yinyin Dou, Bo Zhao, Jubo Yan, Qiang Zhang, and Fangjin Xu. 2021. “A Global Analysis of the Relationship Between Urbanization and Fatalities in Earthquake-Prone Areas.” International Journal of Disaster Risk Science 12:805–820. https://doi.org/10.1007/s13753-021-00385-z.
- Huang, Qingxu, Ziwen Liu, Chunyang He, Siyuan Gou, Yansong Bai, Yihang Wang, and Miaogen Shen. 2020. “The Occupation of Cropland by Global Urban Expansion from 1992 to 2016 and Its Implications.” Environmental Research Letters 15 (8): 084037. https://doi.org/10.1088/1748-9326/ab858c.
- Huang, Xiaoman, Annemarie Schneider, and Mark A Friedl. 2016. “Mapping Sub-Pixel Urban Expansion in China Using MODIS and DMSP/OLS Nighttime Lights.” Remote Sensing of Environment 175:92–108. https://doi.org/10.1016/j.rse.2015.12.042.
- IUCN (International Union for Conservation of Nature). 2013. Habitats Classification Scheme (Version 3.1)in The IUCN Red List of Threatened Species (Version 2013.1). https://www.iucnredlist.org/.
- Jiang, Yuefeng, Liang Zhou, Bao Wang, Qian Zhang, Hong Gao, Shaohua Wang, and Mengqiu Cui. 2024. “The Impact of Gradient Expansion of Urban–Rural Construction Land on Landscape Fragmentation in Typical Mountain Cities, China.” International Journal of Digital Earth 17 (1): 2310093. https://doi.org/10.1080/17538947.2024.2310093.
- Ju, Hongrun, Chunyan Niu, Shengrui Zhang, Wei Jiang, Zhaohui Zhang, Xuliang Zhang, Ziyi Yang, and Yurong Cui. 2021. “Spatiotemporal Patterns and Modifiable Areal Unit Problems of the Landscape Ecological Risk in Coastal Areas: A Case Study of the Shandong Peninsula, China.” Journal of Cleaner Production 310:127522. https://doi.org/10.1016/j.jclepro.2021.127522.
- Kleemann, Janina, Berenike Struve, and Marcin Spyra. 2023. “Conflicts in Urban Peripheries in Europe.” Land Use Policy 133:106849. https://doi.org/10.1016/j.landusepol.2023.106849.
- Li, Guangdong, and Feng Li. 2019. “Urban Sprawl in China: Differences and Socioeconomic Drivers.” Science of The Total Environment 673:367–377. https://doi.org/10.1016/j.scitotenv.2019.04.080.
- Li, Bingyuan, Baotian Pan, and Jiafu Han. 2008. “Basic Terrestrial Geomorphological Types in China and Their Circumscriptions.” Quaternary Sciences 28 (4): 535–543. https://doi.org/10.3321/j.issn:1001-7410.2008.04.004.
- Li, Guangdong, and Wei Qi. 2019. “Impacts of Construction Land Expansion on Landscape Pattern Evolution in China.” Journal of Geographical Sciences 74:2572–2591. https://doi.org/10.11821/dlxb201912011.
- Liu, Minsi, and Kevin Lo. 2022. “The Territorial Politics of Urban Expansion: Administrative Annexation and Land Acquisition.” Cities 126:103704. https://doi.org/10.1016/j.cities.2022.103704.
- Liu, Mingzhe, Qiang Ren, Cheng Liu, Weichen Zhang, Chen Song, Peiyuan Chen, and Qingxu Huang. 2024. “Urban Land Expanded Closer to Protected Areas in China: A Three Decade Investigation Over 2622 Protected Areas.” International Journal of Sustainable Development World Ecology 31 (5): 578–592. https://doi.org/10.1080/13504509.2024.2303757.
- Ma, Qun, Chunyang He, and Jianguo Wu. 2016. “Behind the Rapid Expansion of Urban Impervious Surfaces in China: Major Influencing Factors Revealed by a Hierarchical Multiscale Analysis.” Land Use Policy 59:434–445. https://doi.org/10.1016/j.landusepol.2016.09.012.
- Mao, Wenjing, and Limin Jiao. 2024. “Land-Use Intensification Dominates China's Land Provisioning Services: From the Perspective of Land System Science.” Journal of Environmental Management 356:120541. https://doi.org/10.1016/j.jenvman.2024.120541.
- McDonald, Robert I, Andressa V Mansur, Fernando Ascensão, Katie Crossman, Thomas Elmqvist, Andrew Gonzalez, Burak Güneralp, Dagmar Haase, Maike Hamann, and Oliver Hillel. 2020. “Research Gaps in Knowledge of the Impact of Urban Growth on Biodiversity.” Nature Sustainability 3 (1): 16–24. https://doi.org/10.1038/s41893-019-0436-6.
- Middel, Ariane, Jonas Lukasczyk, Sophie Zakrzewski, Michael Arnold, and Ross Maciejewski. 2019. “Urban Form and Composition of Street Canyons: A Human-Centric Big Data and Deep Learning Approach.” Landscape and Urban Planning 183:122–132. https://doi.org/10.1016/j.landurbplan.2018.12.001.
- Mohamed, Awaz, Fabrice DeClerck, Peter H Verburg, David Obura, Jesse F Abrams, Noelia Zafra-Calvo, Juan Rocha, Natalia Estrada-Carmona, Alexander Fremier, and Sarah K Jones. 2024. “Securing Nature’s Contributions to People Requires at Least 20%–25%(Semi-) Natural Habitat in Human-Modified Landscapes.” One Earth 7 (1): 59–71. https://doi.org/10.1016/j.oneear.2023.12.008.
- Ozturk, Ugur, Elisa Bozzolan, Elizabeth A Holcombe, Roopam Shukla, Francesca Pianosi, and Thorsten Wagener. 2022. “How Climate Change and Unplanned Urban Sprawl Bring More Landslides.” Nature 608 (7922): 262–265. https://doi.org/10.1038/d41586-022-02141-9.
- Qiang, Wei, Ziwei Lin, Pengyu Zhu, Kang Wu, and Harry F Lee. 2021. “Shrinking Cities, Urban Expansion, and Air Pollution in China: A Spatial Econometric Analysis.” Journal of Cleaner Production 324:129308. https://doi.org/10.1016/j.jclepro.2021.129308.
- Ren, Qiang, Chunyang He, Qingxu Huang, Peijun Shi, Da Zhang, and Burak Güneralp. 2022. “Impacts of Urban Expansion on Natural Habitats in Global Drylands.” Nature Sustainability 5 (10): 869–878. https://doi.org/10.1038/s41893-022-00930-8.
- Rentschler, Jun, Paolo Avner, Mattia Marconcini, Rui Su, Emanuele Strano, Michalis Vousdoukas, and Stéphane Hallegatte. 2023. “Global Evidence of Rapid Urban Growth in Flood Zones Since 1985.” Nature 622 (7981): 87–92. https://doi.org/10.1038/s41586-023-06468-9.
- Shen, Wenhan, Aoxi Yang, and Yahui Wang. 2023. “Attributions and Implications of Human and Wild Boar Conflicts in China’s Cities: A Case Study of Nanjing City, China.” Ecological Indicators 156:111089. https://doi.org/10.1016/j.ecolind.2023.111089.
- Shi, Kaifang, Yuanzheng Cui, Shirao Liu, and Yizhen Wu. 2023. “Global Urban Land Expansion Tends to Be Slope Climbing: A Remotely Sensed Nighttime Light Approach.” Earth's Future 11 (4): e2022EF003384. https://doi.org/10.1029/2022EF003384.
- Shi, Kaifang, Guifen Liu, Liang Zhou, Yuanzheng Cui, Shirao Liu, and Yizhen Wu. 2023. “Satellite Remote Sensing Data Reveal Increased Slope Climbing of Urban Land Expansion Worldwide.” Landscape and Urban Planning 235:104755. https://doi.org/10.1016/j.landurbplan.2023.104755.
- Shi, Kaifang, Yizhen Wu, Deren Li, and Xi Li. 2022. “Population, GDP, and Carbon Emissions As Revealed by SNPP-VIIRS Nighttime Light Data in China with Different Scales.” IEEE Geoscience and Remote Sensing Letters 19:1–5. https://doi.org/10.1109/LGRS.2022.3195266.
- Shi, Kaifang, Yizhen Wu, and Shirao Liu. 2022. “Slope Climbing of Urban Expansion Worldwide: Spatiotemporal Characteristics, Driving Factors and Implications for Food Security.” Journal of Environmental Management 324:116337. https://doi.org/10.1016/j.jenvman.2022.116337.
- Shi, Kaifang, Bailang Yu, Jinji Ma, Weidong Cao, and Yuanzheng Cui. 2023. “Impacts of Slope Climbing of Urban Expansion on Global Sustainable Development.” The Innovation 4 (6): 100529. https://doi.org/10.1016/j.xinn.2023.100529.
- The State Council of P.R.China. 2014. “Circular on Adjusting the Standard of City Size Division.” November 20, 2014. http://www.gov.cn/zhengce/content/2014-11/20/content_9225.htm.
- Teckentrup, Lisa, Stephanie Kramer-Schadt, and Florian Jeltsch. 2019. “The Risk of Ignoring Fear: Underestimating the Effects of Habitat Loss and Fragmentation on Biodiversity.” Landscape Ecology 34:2851–2868. https://doi.org/10.1007/s10980-019-00922-8.
- van Vliet, Jasper. 2019. “Direct and Indirect Loss of Natural Area from Urban Expansion.” Nature Sustainability 2 (8): 755–763. https://doi.org/10.1038/s41893-019-0340-0.
- van Vliet, Jasper, David A Eitelberg, and Peter H Verburg. 2017. “A Global Analysis of Land Take in Cropland Areas and Production Displacement from Urbanization.” Global Environmental Change 43:107–115. https://doi.org/10.1016/j.gloenvcha.2017.02.001.
- Xiong, Liyang, Guoan Tang, Xin Yang, and Fayuan Li. 2021. “Geomorphology-oriented Digital Terrain Analysis: Progress and Perspectives.” Journal of Geographical Sciences 31:456–476. https://doi.org/10.1007/s11442-021-1853-9.
- Xu, Yong, Shen Zhao, and Jie Fan. 2021. “Urban Planning Construction Land Standard and Its Revision Based on Climate and Topography in China.” Journal of Geographical Sciences 31:603–620. https://doi.org/10.1007/s11442-021-1861-9.
- Yan, Fengqin, Xuege Wang, Chong Huang, Junjue Zhang, Fenzhen Su, Yifei Zhao, and Vincent Lyne. 2023. “Sea Reclamation in Mainland China: Process, Pattern, and Management.” Land Use Policy 127:106555. https://doi.org/10.1016/j.landusepol.2023.106555.
- Yang, Chao, Wenhao Guo, Chenchen Zhang, Aihong Cui, Xuecao Li, Tianhong Zhao, Huizeng Liu, et al. 2022. “Characteristics and Trends of Hillside Urbanization in China from 2007 to 2017.” Habitat International 120:102502. https://doi.org/10.1016/j.habitatint.2021.102502.
- Yang, Chao, Huizeng Liu, Qingquan Li, Xuqing Wang, Wei Ma, Cuiling Liu, Xu Fang, et al. 2022. “Human Expansion Into Asian Highlands in the 21st Century and Its Effects.” Nature Communications 13 (1): 4955. https://doi.org/10.1038/s41467-022-32648-8.
- Yang, Di, Wei-Xin Luan, and Xiaoling Zhang. 2023. “Projecting Spatial Interactions Between Global Population and Land Use Changes in the 21st Century.” Nature Sustainability 3 (1): 53. https://doi.org/10.1038/s42949-023-00131-y.
- Yang, Chao, Rongling Xia, Qingquan Li, Huizeng Liu, Tiezhu Shi, and Guofeng Wu. 2021. “Comparing Hillside Urbanizations of Beijing-Tianjin-Hebei, Yangtze River Delta and Guangdong–Hong Kong–Macau Greater Bay Area Urban Agglomerations in China.” International Journal of Applied Earth Observation and Geoinformation 102:102460. https://doi.org/10.1016/j.jag.2021.102460.
- Ye, Tingting, Naizhuo Zhao, Xuchao Yang, Zutao Ouyang, Xiaoping Liu, Qian Chen, Kejia Hu, Wenze Yue, Jiaguo Qi, and Zhansheng Li. 2019. “Improved Population Mapping for China Using Remotely Sensed and Points-of-Interest Data Within a Random Forests Model.” Science of The Total Environment 658:936–946. https://doi.org/10.1016/j.scitotenv.2018.12.276.
- Yu, Qing, Eddie Chi-Man Hui, and Jianfu Shen. 2023. “Do Local Governments Capitalise on the Spillover Effect in the Housing Market? Quasi-Experimental Evidence from House Purchase Restrictions in China.” Land Use Policy 133:106851. https://doi.org/10.1016/j.landusepol.2023.106851.
- Yuan, Feng, Yehua Dennis Wei, and Weiye Xiao. 2019. “Land Marketization, Fiscal Decentralization, and the Dynamics of Urban Land Prices in Transitional China.” Land Use Policy 89:104208. https://doi.org/10.1016/j.landusepol.2019.104208.
- Zhang, Yatao, Xia Li, Shaojian Wang, Yao Yao, Qingquan Li, Wei Tu, Hongfang Zhao, Hui Zhao, Kuishuang Feng, and Laixiang Sun. 2021. “A Global North-South Division Line for Portraying Urban Development.” Iscience 24:102729. https://doi.org/10.1016/j.isci.2021.102729.
- Zheng, Chunji, Feng Deng, Chengyou Li, and Zhiming Yang. 2022. “The Impact of China's Western Development Strategy on Energy Conservation and Emission Reduction.” Environmental Impact Assessment Review 94:106743. https://doi.org/10.1016/j.eiar.2022.106743.
- Zheng, Qiming, Karen C Seto, Yuyu Zhou, Shixue You, and Qihao Weng. 2023. “Nighttime Light Remote Sensing for Urban Applications: Progress, Challenges, and Prospects.” ISPRS Journal of Photogrammetry and Remote Sensing 202:125–141. https://doi.org/10.1016/j.isprsjprs.2023.05.028.
- Zheng, Liang, Ying Wang, and Jiangfeng Li. 2023. “Quantifying the Spatial Impact of Landscape Fragmentation on Habitat Quality: A Multi-Temporal Dimensional Comparison Between the Yangtze River Economic Belt and Yellow River Basin of China.” Land Use Policy 125:106463. https://doi.org/10.1016/j.landusepol.2022.106463.
- Zhou, Liang, Xuewei Dang, Haowei Mu, Bo Wang, and Shaohua Wang. 2021. “Cities are Going Uphill: Slope Gradient Analysis of Urban Expansion and Its Driving Factors in China.” Science of The Total Environment 775:145836. https://doi.org/10.1016/j.scitotenv.2021.145836.